prahlad@prl.res.in (PE); snaik@prl.res.in (SN); gaurava@prl.res.in (GKJ)
Broad-band spectroscopy of the transient X-ray binary pulsar KS 1947+300 during 2013 giant outburst: Detection of pulsating soft X-ray excess component
Abstract
We present the results obtained from detailed timing and spectral studies of the Be/X-ray binary pulsar KS 1947+300 during its 2013 giant outburst. We used data from Suzaku observations of the pulsar at two epochs i.e. on 2013 October 22 (close to the peak of the outburst) and 2013 November 22. X-ray pulsations at 18.81 s were clearly detected in the light curves obtained from both observations. Pulse periods estimated during the outburst showed that the pulsar was spinning up. The pulse profile was found to be single-peaked up to 10 keV beyond which a sharp peak followed by a dip-like feature appeared at hard X-rays. The dip-like feature has been observed up to 70 keV. The 1-110 keV broad-band spectroscopy of both observations revealed that the best-fit model comprised of a partially absorbed Negative and Positive power law with EXponential cutoff (NPEX) continuum model along with a blackbody component for the soft X-ray excess and two Gaussian functions at 6.4 and 6.7 keV for emission lines. Both the lines were identified as emission from neutral and He-like iron atom. To fit the spectra, we included the previously reported cyclotron absorption line at 12.2 keV. From the spin-up rate, the magnetic field of the pulsar was estimated to be 1.21012 G and found to be comparable to that obtained from the detection of the cyclotron absorption feature. Pulse-phase resolved spectroscopy revealed the pulsating nature of the soft X-ray excess component in phase with the continuum flux. This confirms that the accretion column and/or accretion stream are the most probable regions of pulsar’s soft X-ray excess emission. The presence of the pulsating soft X-ray excess in phase with continuum emission may be the possible reason for not observing the dip at soft X-rays.
keywords:
pulsars: individual (KS 1947+300) –stars: neutron; X-rays:binaries1 Introduction
Be/X-ray binaries (BeXBs) are known to be the largest subclass (60%) of high-mass X-ray binaries (Caballero & Wilms 2012). The majority of BeXBs consist of a neutron star as compact object and a Be star as optical companion. The optical companions in these binary systems are non-supergiant B-type stars of luminosity class III-V that show emission lines at their evolutionary phase (Okazaki & Negueruela 2001; Reig 2011). The neutron star in BeXBs accretes matter from the circumstellar disk of Be star usually at periastron passage. This abrupt accretion of huge amount of matter causes significant enhancement of the X-ray emission from the pulsating neutron star. These periodic enhancements of the X-ray intensity are known as Type I X-ray outbursts (peak luminosity 1035 - 1037 ergs s-1). The neutron star in these systems, however, occasionally shows rare X-ray outbursts (Type II), lasting for several tens of days to a few months during which the peak luminosity reaches up to 1038 ergs s-1. For a brief review of the properties of BeXBs, refer to Paul & Naik (2011).
The transient Be/X-ray binary pulsar KS 1947+300 was discovered on 1989 June 8 with the Kvant/TTM coded-mask X-ray spectrometer on Mir space station (Skinner 1989; Borozdin et al. 1990). The pulsar was first detected at a flux level of 70 mCrab that later decreased to 10 mCrab within 2 months of the detection. The spectra obtained from these observations were described by an absorbed power-law with photon-index of 1.72 (Borozdin et al. 1990). In 1994 April, the X-ray pulsar GRO J1948+32 was discovered close to the coordinates of KS 1947+300 by the Burst and Transient Source Experiment (BATSE) instrument on-board Compton Gamma Ray Observatory (CGRO) (Chakrabarty et al. 1995). The pulsation from this new source was found to be 18.7 s. Based on the spin period analysis, later Swank & Morgan (2000) established that KS 1947+300 and GRO J1948+32 are the same source. A Be star of 14.2 visible magnitude at a distance of 10 kpc was discovered as the optical counterpart of the pulsar (Negueruela et al. 2003).
KS 1947+300 was inactive from 1995 to 2000 without showing any major X-ray outburst. Subsequent RXTE observations showed that the source became active in October 2000 and went into a strong X-ray outburst (Levine & Corbet 2000). The pulsar spectrum in the 2-80 keV range during the outburst was described with a Comptonization continuum model along with a blackbody component for the soft X-ray excess and a Gaussian component for the iron emission line at 6.5 keV (Galloway et al. 2004). The orbital parameters of the binary system were also estimated from observations during October and are reported in Galloway et al. (2004). A glitch in the pulsar frequency, generally seen in anomalous X-ray pulsars and radio pulsars and rare in accretion powered X-ray pulsars, was first detected in KS 1947+300 (Galloway et al. 2004). A low frequency quasi-periodic oscillation (QPO) at 20 mHz was detected at several occasions in declining phase of 2001 outburst with RXTE (James et al. 2010). Detection of low frequency QPOs and strong pulsations at low luminosity levels indirectly indicated that the magnetic field of the neutron star is G as predicated from spin-up torque and luminosity correlation (James et al. 2010). Using BeppoSAX observations of 2001 X-ray outburst, Naik et al. (2006) described the broad-band pulsar spectrum in 0.1-100 keV with a Comptonization model along with a blackbody component at 0.6 keV and detected a weak 6.7 keV emission line from helium-like iron atoms. However, iron Kα emission line was absent in the spectrum during 2001 outburst.
A series of weak outbursts were observed from KS 1947+300 during the period of 2002-2004. Among these outbursts, the strongest one was detected with INTEGRAL in April 2004. A high energy cutoff power-law model was used to describe the spectra obtained from INTEGRAL/ISGRI and JEM-X data during this outburst (Tsygankov et al. 2005). However, there was no signature of cyclotron absorption lines in the pulsar spectra. In October 2013, KS 1947+300 was detected in a giant outburst with a peak flux of 130 mCrab in 3-10 keV range (Fürst et al. 2014). Several Swift/XRT and three NuSTAR pointed observations were performed at different phases of the X-ray outburst. Combined spectra from Swift/XRT and NuSTAR in 0.8-79 keV range were described by a power law with an exponential cutoff continuum model along with a blackbody and an iron line component at 6.5 keV (Fürst et al. 2014). A cyclotron absorption line at 12.2 keV was discovered in the pulsar spectra only during the second NuSTAR observation. The surface magnetic field of the pulsar was estimated to be 1.1(1+z) G. Though KS 1947+300 had gone through several major X-ray outbursts, cyclotron absorption line was not detected in the spectra obtained from earlier RXTE, BeppoSAX or INTEGRAL observations.
As 2013 October outburst was a giant outburst, the pulsar was active for a few months during which it was observed with different X-ray observatories. We have used two Suzaku observations of the pulsar during this outburst to study its broad-band timing and spectral properties. The details on the observations, analysis, results and conclusions are presented in the following sections of the paper.
2 Observations and Data Analysis
The fifth Japanese X-ray satellite, Suzaku, was launched on 2005, July 10 (Mitsuda et al. 2007). The X-ray imaging spectrometers (XISs; Koyama et al. 2007) and the hard X-ray detectors (HXDs; Takahashi et al. 2007) onboard Suzaku covered the 0.5-600 keV range. The XISs are CCD cameras located at the focal points of each of the four X-ray telescopes (XRTs; Serlemitsos et al. 2007). XISs (XIS-0, XIS-2 and XIS-3) are front-illuminated while XIS-1 is back-illuminated. The hard X-ray unit of Suzaku consists of two non-imaging detectors e.g. HXD/PIN and HXD/GSO. HXD/PIN consists of silicon diode detectors that work in 10-70 keV range and HXD/GSO consists of crystal scintillator detectors covering 40-600 keV range. The field of view of XIS is in open window mode. HXD/GSO has same field of view of as HXD/PIN up to 100 keV.

Target of opportunity (ToO) observations of KS 1947+300 were carried out with Suzaku at two epochs during its giant outburst in 2013 October-November. The first observation was performed on 2013 October 22, close to the peak of the outburst for an effective exposure of 29 ks. The second observation was carried out on 2013 November 22-23 at the peak of the outburst for an effective exposure of 8 ks and 32 ks for XIS and HXD, respectively. The XIS detectors were operated in normal and burst clock mode with 2 s and 0.5 s time resolutions for first and second observations, respectively. Both the observations were carried out in ‘XIS nominal’ position. Swift/BAT monitoring light curve of the pulsar in 15-50 keV range covering the giant X-ray outburst is shown in Fig. 1. The arrows marks in the figure represent the date of Suzaku observations of the pulsar. In the present study, we used the publicly available data with Observation IDs: 908001010 and 908001020 (hereafter Obs.1 and Obs.2).
| MJD | Date | Period (s) | References |
|---|---|---|---|
| 56586.79 | 2013-10-21 | 18.80584(16) | Fürst et al. (2014) |
| 56587.22 | 2013-10-22 | 18.8088(1) | present work |
| 56618.61 | 2013-11-22 | 18.7878(1) | present work |
| 56618.91 | 2013-11-22 | 18.78399(7) | Fürst et al. (2014) |
| 56635.75 | 2013-12-09 | 18.77088(6) | Fürst et al. (2014) |
| 57053 | 2015-01-31 | 18.76255 | Finger et al. (2015) |
2.1 Data reduction
Unfiltered XIS and HXD event data were reprocessed by using aepipeline task in Heasoft (version 6.16) analysis package. Calibration database (CALDB) files released on 2012 November 06 (XIS) and 2011 September 13 (HXD) were used during data reprocessing. Cleaned event files generated after reprocessing were used in the present study. The aebarycen task of FTOOLS was applied on the cleaned event data to neutralize the effects of motions of the satellite and the earth around the Sun. We checked the effect of thermal flexing by applying the attitude correction S-lang script aeattcor.sl111http://space.mit.edu/ASC/software/suzaku/aeattcor.sl on XISs data. After attitude correction, the XIS cleaned events were examined for possible photon pile-up by using the S-lang script pile_estimate.sl222http://space.mit.edu/ASC/software/suzaku/pile_estimate.sl. During Obs.1, we detected a pile-up of 31%, 21% & 33% at the centers of XIS-0, XIS-1 and XIS-3 images, respectively. Therefore, an annulus region with inner and outer radii of 75\arcsecand 200\arcsecwas chosen to reduce the pile-up below 4%. As in case of Obs.1, we estimated photon pile-up for Obs.2 which was found to be 15%, 12% and 18% at the centers of XIS-0, XIS-1 and XIS-3 images, respectively. An annulus region with inner and outer radii of 35\arcsecand 200\arcsecwas considered for the pile-up correction in second observation. The light-curves and spectra of the pulsar were extracted from the XIS cleaned event data by applying the annulus regions in XSELECT package. Background light curves and spectra were accumulated from a source free region in the XIS image frame. Response and effective area files for XISs were created from the “resp=yes” task during the spectral extraction in XSELECT. HXD/PIN and HXD/GSO source light curves and spectra were extracted from the cleaned event data by applying GTI selection in XSELECT. The PIN and GSO background light curves and spectra were generated in a similar manner from the simulated tuned non-X-ray background event data provided by the instrument team. The response file released on June 2011 was used for HXD/PIN for both the observations. However, GSO response and additional effective area files released on 2010 May 24 and 2010 May 26, respectively, were used while analyzing HXD/GSO data.

3 Timing Analysis
Source and background light curves were extracted from the reprocessed and barycentric corrected XISs, PIN & GSO event data with time resolutions of 2 s, 1 s, 1 s for Obs.1 and 0.5 s, 1 s, 1 s for Obs.2, respectively. The -maximization technique was applied to search for the periodicity in the background subtracted XIS and PIN light curves. Pulsations at periods of 18.8088(1) and 18.7878(1) s were detected in the light curves obtained from the first and second Suzaku observations, respectively. Though the observations were carried out within a time interval of one month, the decrease of the pulse period during later epoch suggests that the pulsar was spinning up. The pulse period history of KS 1947+300, obtained from NuSTAR and Suzaku observations during October-November 2013 outburst, is given in Table 1. Decreasing values of the spin period with time confirmed that the pulsar was spinning-up during the outburst. Recent measurement of pulse period of KS 1947+300 in 2015 January-February outburst (see Table 1) also indicated the long term spin-up trend in the pulsar.
Pulse profiles of the pulsar in different energy bands were generated from the XIS, PIN and GSO light curves, obtained from both observations, are shown in Fig. 2 & 3. During the first observation, the soft X-ray pulse profile (below 5 keV) was found to be smooth and single peaked. However, with increase in energy, a narrow dip-like feature appeared in the pulse profile and became prominent in 30-40 keV range. Beyond this energy, the depth of dip decreased and disappeared from the pulse profiles in 70-100 keV range. During second observation, the pulse profiles were found to show similar type of energy dependence as seen during first observation. X-ray pulsations in the light curves were detected up to 120 keV and 150 keV during first and second observations, respectively. Absorption dips in the pulse profiles of Be/X-ray binary pulsars during X-ray outbursts are found to be prominent in soft X-rays and weak in hard X-ray bands (Paul & Naik 2011 and references therein; Naik et al. 2013; Naik & Jaisawal 2015). However, in the case of Suzaku observations of KS 1947+300, the dip was found to be absent in the soft X-ray pulse profiles and prominent in the hard X-ray pulse profiles. It is, therefore, interesting to investigate the spectral properties of the pulsar to understand the causes of the absence/presence of absorption dip in soft/hard X-ray pulse profiles.

4 Spectral Analysis
4.1 Pulse-phase averaged spectroscopy
We performed phase-averaged spectroscopy of KS 1947+300 by using data from both Suzaku observations carried out during the giant outburst. Data from XIS-0, XIS-1, XIS-3, PIN and GSO detectors were used in our analysis. The procedure followed to extract source and background spectra was described in the earlier section. To improve statistics, we re-binned the source spectra obtained from XISs and PIN event data to have a minimum of 20 counts per energy channel. However, GSO spectra were grouped as suggested by instrument team. As in case of other bright X-ray sources where a systematic error of up to 3% was added to XIS spectra (Cyg X-1; Nowak et al. 2011), a systematic error of 1% was added to XIS spectra of KS 1947+300 for the cross calibration issues between back and front illuminated CCDs. Simultaneous spectral fitting was carried out in 1-110 keV range for both observations by using XSPEC (version 12.8.2) package. During spectral fitting, data in 1.7-1.9 keV and 2.2-2.4 keV ranges were ignored due to the presence of known Si and Au edges in XISs spectra. All the model parameters were tied together except the values of relative normalization of detectors which were kept free during simultaneous spectral fitting.
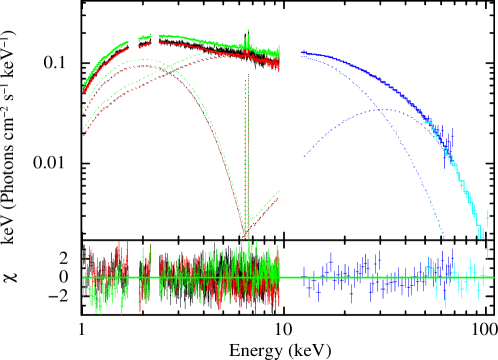
We used a high-energy cut-off power law, a cut-off power law and the NPEX model to describe the pulsar continuum. We found that all three models can explain the continuum spectrum well. Along with the interstellar absorption, a blackbody component for the soft X-ray excess and a Gaussian function for iron emission were required to fit the spectra. Though the broad-band spectral fitting yielded an emission line at 6.5 keV with a width of 0.2 keV, careful investigations of the residuals near the line energy confirmed the presence of two iron emission lines at 6.4 and 6.7 keV. Therefore, we added Gaussian functions at 6.4 and 6.7 keV in our broad-band spectral fitting. We identified these lines as emission from neutral and He-like iron atoms. It was found that the addition of partial covering component to above continuum models improved the spectral fitting further with significant improvement in the values ( 70). This component has been used to investigate the cause of absorption dips at certain phases of the pulse profiles of Be/X-ray binary pulsars (Paul & Naik 2011). This component, therefore, was used to probe the cause of observed absorption dip in the pulse profiles of KS 1947+300. A cyclotron line at 12.2 keV as detected from NuSTAR observations was also included in the spectral model. Since Suzaku data cannot constrain well the line region, in our analysis, we fixed the cyclotron line parameters i.e. line energy at 12.2 keV, width at 2.5 keV and depth at 0.16 as obtained from NuSTAR observation (Fürst et al. 2014). Among the three continuum models, the partial covering NPEX model along with other spectral components was found to be the best-fit model for both Suzaku observations.
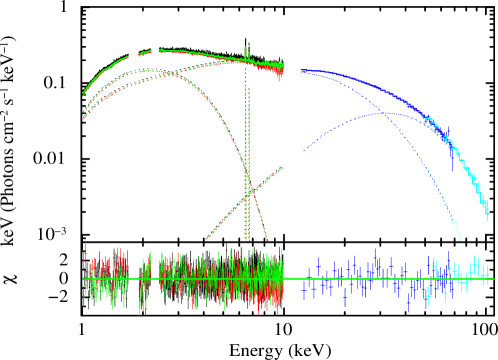
Best-fitted spectral parameters obtained from all three models are given in Table LABEL:spec_par for both observations. The energy spectra for the partial covering NPEX continuum model along with residuals are shown in Figure 4 & 5 for first and second Suzaku observations, respectively. The values of additional absorption column density (N) were found to be significantly higher than the values of Galactic absorption column density (N) (Table LABEL:spec_par). The pulsar spectrum was marginally hard at the peak of the outburst i.e. during second observation compared to the first observation. The soft excess component was found to be stronger during the second observation (peak of the outburst) with higher values of blackbody temperature and flux compared to that during the first observation.
4.2 Pulse-phase resolved spectroscopy
To investigate the nature of the absorption dip in hard X-ray pulse profiles, as well as the nature of the soft excess component and the evolution of other spectral parameters during both Suzaku observations, pulse-phase resolved spectroscopy was carried out by accumulating source spectra from XISs, PIN and GSO detectors in 9 and 10 phase bins for first and second observations, respectively. Background spectra, response matrices and effective area files used in phase-averaged spectroscopy were also used in the phase-resolved spectroscopy. Simultaneous spectral fitting was carried out for phase-resolved spectra obtained from both observations by using partial covering NPEX continuum model along with other components. During fitting, the equivalent galactic hydrogen column density (N; expected to be constant along the source direction), energy and width of iron emission lines, cyclotron line parameters (line energy, width and depth) and relative instrument normalizations were fixed at corresponding phase-averaged values. Due to lack of sufficient photons, the iron emission lines were not resolved during the phase-resolved spectral fitting. It was found that the change in spectral parameters over pulse phase are similar for both the observations and are shown in Figures 6 & 7 for the first and second observation, respectively. Pulse profiles of the pulsar obtained from XIS-0 and PIN light curves of both observations are shown in top two panels of left and right panels of Figures 6 & 7. Changes in the spectral parameters such as additional column density (N), covering fraction, blackbody temperature for soft X-ray excess and soft X-ray excess flux with pulse phases are shown in subsequent panels on the left sides of Figures 6 & 7. The panels in right side of Figures 6 & 7 show the changes in soft (1-10 keV) and hard X-ray (10-100 keV) fluxes, power-law photon index and cutoff energy.
All the spectral parameters plotted in Figures 6 & 7 were found to be variable with pulse phase of the pulsar. Additional column density was found to be marginally higher at the phase of the absorption dip in hard X-ray pulse profile. Blackbody temperature, blackbody flux and source flux in the 1-10 keV range showed similar variation pattern as the soft X-ray pulse profile over pulse phases. This confirmed the pulsating nature of the soft X-ray excess component in phase with the source flux. The values of power-law photon index and high energy cutoff were found higher during the main dip phases. Dependence of several spectral parameters on additional column density and source flux in 1-10 keV range were investigated and are shown in Figures 8 & 9. The left panels showed the dependence of power-law photon index and blackbody temperature on additional column density where as the right panels showed the dependence of blackbody temperature and blackbody flux on source flux in 1-10 keV range. It was found that the blackbody temperature and flux showed positive correlation with the soft X-ray flux in 1-10 kev range. The value of power-law photon index was found to be high at low value of additional column density (N) and decreased with the increase in N.
| Parameter | 2013 October (Obs.1) | 2013 November (Obs.2) | ||||
|---|---|---|---|---|---|---|
| Model-1 | Model-2 | Model-3 | Model-1 | Model-2 | Model-3 | |
| NH1a | 0.500.02 | 0.500.02 | 0.520.02 | 0.480.02 | 0.500.02 | 0.530.02 |
| NH2b | 7.61.0 | 8.21.1 | 7.61.1 | 11.32.5 | 10.71.7 | 12.14.8 |
| Covering fraction | 0.440.06 | 0.450.06 | 0.430.06 | 0.350.06 | 0.350.06 | 0.270.07 |
| Photon Index () | 0.670.03 | 0.950.04 | 0.920.05 | 0.620.04 | 0.930.04 | 0.930.03 |
| Ecut (keV) | 10.20.3 | 5.40.4 | 20.20.9 | 10.60.4 | 5.90.3 | 21.60.7 |
| Efold (keV) | – | 21.00.7 | – | – | 21.60.7 | – |
| Blackbody temp. kT (keV) | 0.540.02 | 0.560.02 | 0.540.02 | 0.630.03 | 0.650.02 | 0.650.03 |
| Blackbody fluxc | 0.880.13 | 0.960.13 | 0.770.13 | 1.340.19 | 1.400.20 | 1.020.19 |
| Emission lines | ||||||
| Fe line energy (keV) | 6.420.03 | 6.420.03 | 6.420.03 | 6.450.02 | 6.450.02 | 6.450.02 |
| Width of Fe line (keV) | 0.01 | 0.01 | 0.01 | 0.01 | 0.01 | 0.01 |
| Eq. width of Fe line (eV) | 182 | 192 | 192 | 203 | 203 | 222 |
| Line energy (keV) | 6.660.05 | 6.660.05 | 6.660.05 | 6.710.04 | 6.710.04 | 6.710.02 |
| Line width (keV) | 0.01 | 0.01 | 0.01 | 0.01 | 0.01 | 0.01 |
| Equivalent width (eV) | 172 | 182 | 182 | 113 | 113 | 133 |
| Source flux | ||||||
| Fluxc (1-10 keV) | 2.60.2 | 2.70.2 | 2.60.2 | 4.30.4 | 4.30.4 | 4.10.4 |
| Fluxc (10-70 keV) | 5.40.5 | 5.30.4 | 5.30.3 | 6.60.6 | 6.50.5 | 6.50.4 |
| Fluxc (70-100 keV) | 0.210.03 | 0.270.02 | 0.270.02 | 0.380.03 | 0.380.03 | 0.380.02 |
| Reduced | 1.18 (942) | 1.25 (970) | 1.25 (971) | 1.08 (970) | 1.10 (942) | 1.13 (971) |


5 Discussion and Conclusions
5.1 Spin-period and magnetic field of the pulsar
KS 1947+300 was observed with Suzaku at two epochs during its 2013 X-ray outburst. Though the observations were only a month apart, estimated spin periods of the pulsar during both the observations were found to be different. The spin period during the second observation was smaller than the first observation, indicating the pulsar was spinning up during the X-ray outburst. While comparing the recent measurements of spin period of the pulsar with several observatories (as quoted in Table 1), it was found that the pulsar was continuously spinning up during whole of the 2013 X-ray outburst. During X-ray outbursts, spinning-up of the neutron star is expected due to transfer of angular momentum from accreting matter at the magnetic poles. Ghosh & Lamb (1979) formulated the dependence of spin-up rate of a pulsar on its luminosity as . In the present work, the pulsar spin period was found to 18.7878 s (Suzaku) at the peak of the outburst which decreased to 18.77088 s (NuSTAR observation) during the decay of the outburst (see Table 1). The observed spin-up of KS 1947+300 can be attributed to the change in angular momentum due to the torque exerted by accreting matter on the neutron star. A similar type of rapid spin-up was also observed during the declining phase of the 2001 outburst of the pulsar (Naik et al. 2006).
The pulsar was showing a spin-up trend during Suzaku and NuSTAR observations. The observed spin-up (angular frequency) rate () can be used to estimate the magnetic field of the pulsar by considering the quasi-spherical settling accretion theory (Shakura et al. 2012; Postnov et al. 2015). According to this theory,
| (1) |
where is spin-up rate which is estimated to be 1.2710-5[Hz d-1] (present case) and is the dimensionless parameter of the theory of setting accretion. The value of is independent of the system and is in the range of 4.6 to 10 (Shakura et al. 2012; Postnov et al. 2015). In the present case, was assumed to be 4.6. The dipole magnetic moment of the neutron star =/1030[G cm3] and related to the magnetic field (B) through the relation =BR3/2 (R is the neutron star radius, assumed to be 10 km). Stellar wind velocity v8=v/108[cm s-1] is considered to be 200 km s-1 for typical Be/X-ray binaries (Waters et al. 1988). The mass accretion rate =/1016[g s-1] for the luminosity of 1038 erg s-1 was estimated to be =100 during Suzaku observations. The orbital period Pb of KS 1947+300 is 40.42 d (Galloway et al. 2004). Using above parameters, the magnetic field of the pulsar was estimated to be 1.21012 G. The estimated value of magnetic field by using observed spin-up rate in KS 1947+300 was found to agree with that obtained from the detection of cyclotron absorption line at 12.2 keV.
5.2 Pulse profiles
In the present work, the pulse profile of KS 1947+300 was found to be simple at lower energies. As the energy increases, a dip like structure appears in the pulse profile and is detected up to 70 keV. The depth of the dip is found to increase with the energy and found maximum in 30-40 keV range. Such type of behavior is not generally seen in pulse profiles of other Be/X-ray binary pulsars. We tried to investigate the cause of the absorption dip in pulse profiles at hard X-rays (10 keV) through phase-resolved spectroscopy. A marginal enhancement in the additional column density at dip phase was detected. Such low value (201022cm-2) of additional column density, however, can not absorb the hard X-ray photons up to 70 keV. KS 1947+300 was also observed at different luminosity levels with several observatories such as BeppoSAX, RXTE, INTEGRAL and NuSTAR. The pulse profiles obtained from these observations were found to be similar to that obtained from Suzaku observations. The dip was only seen in hard X-rays (Galloway et al. 2004; Tsygankov et al. 2005; Naik et al. 2006; Fürst et al. 2014). Therefore, the presence of the dip in hard X-ray pulse profiles of KS 1947+300 is possibly intrinsic to the pulsar.
In general, the pulse profiles of the Be/X-ray binary pulsars are seen to be strongly energy and luminosity dependent. Single or multiple absorption dips, prominent at soft X-ray, are seen in the pulse profiles of these pulsars (Paul & Naik 2011 and references therein). With increase in energy, the depth of the dip decreases and becomes invisible at higher energies. It is widely believed that these dips in the pulse profile are due to obscuration/absorption of soft X-ray photons by matter present close to the neutron star. In some cases, single or multiple dips were observed at high energies e.g. up to 70 keV in pulse profiles of EXO 2030+275 (Naik et al. 2013; Naik et al. 2015). The presence of additional dense matter at dip phases was detected from phase-resolved spectroscopy and was interpreted as the cause of absorption dips in the pulse profiles of EXO 2030+375. In KS 1947+300 (present work), however, the origin of the dip in hard X-ray pulse profiles (up to 70 keV) is not due to the presence of additional matter at certain phase of the pulsar.
The pulse profile of the pulsars can be affected by the cyclotron resonance scattering and geometrical effects. These effects can play a vital role and shape anomaly or dip in the pulse profiles. In KS 1947+300, cyclotron absorption line was detected at 12.2 keV (Fürst et al. 2014). The beam function of an accreting pulsar can be affected by the presence of strong cyclotron resonance scattering which can produce a significant change in the pulse profile e.g. phase-shift (lag) (Schönherr et al. 2014). Similar effects were detected in Be/X-ray binary pulsars such as V 0332+53 (Tsygankov et al. 2006), 4U 0115+63 (Ferrigno et al. 2011) and GX 304-1 (Jaisawal et al. 2016). However, this is not the case in KS 1947+300 as the strength of the observed dip increased with energy and became prominent in the 30-40 keV energy range. Around this energy, however, the effects of cyclotron resonance scattering is not be as effective as compared to energies closer to 12 keV. In addition, any significant change in the pulse profiles (beam pattern) or phase-lags was not observed in the energy resolved pulse profiles (Fig. 2 & 3). Therefore, we expect that the cyclotron scattering is not causing the hard X-ray dip in the pulse profiles of KS 1947+300. Alternatively, the presence of single dip in hard X-ray profiles can suggest a way of direct viewing the accretion column along the magnetic axis of the pulsar. At such high luminosity (1038erg s-1) like the one of the Suzaku observations of KS 1947+300, a radiation pressure dominated shock is expected to form above the neutron surface which can absorb the photons up to higher energies. In this case, the position of the absorption dip should be at the peak of the pulse profiles. However, the asymmetric phase position of the dip with respect to main dip in pulse profiles (Fig. 2 & 3) discards the hypothesis of direct viewing of the pulsar along the magnetic axis. It is accepted that the pulse profile of X-ray pulsars depends on the geometry and viewing angle of the emission region or accretion column (Kraus et al. 1995; Caballero et al. 2011; Sasaki et al. 2012). We suggest that the dip in the hard X-ray pulse profiles of KS 1947+300 is due to these geometrical effects. The dip was absent in the soft X-ray pulse profiles. The presence of strong soft X-ray excess (which was found pulsating in phase with the neutron star) may cancel the effect of the absorption dip, producing single pulse profiles in soft X-ray bands.
5.3 Spectroscopy
In this paper, broad-band phase-averaged and phase-resolved spectra of KS 1947+300 are presented by using two Suzaku observations of the 2013 giant outburst. During both observations, the values of estimated galactic column density were comparable. However, the values of the additional column density were found to be significantly higher than the galactic value. The higher values of additional absorption column density indicates the presence of additional matter near the neutron star during the X-ray outburst. During both the observations, a soft X-ray excess was clearly detected and its temperature was found to be high at the peak of the outburst (second observation). Assuming the blackbody emitting region to be spherically symmetric, the radius of soft X-ray excess emitting region in KS 1947+300 is estimated to be 29–31 km. It implies that the soft X-ray excess emitting region is close to the neutron star surface. The pulsating nature of the soft X-ray excess in KS 1947+300 agrees with the above argument. Therefore, the accretion column and/or accretion streams are the most probable origin site of soft X-ray excess emission in KS 1947+300 (Naik & Paul 2002; Naik & Paul 2004; Hickox et al. 2004).
Apart from the detection of soft X-ray excess and presence of additional matter around the pulsar, change in power-law photon index and high energy cutoff with pulse phase was seen in KS 1947+300. Similar type of variation was also seen in other Be/X-ray binary pulsar such as EXO 2030+275 (Naik et al. 2013; Naik & Jaisawal 2015). Narrow iron Kα and He-like iron emission lines at 6.4 and 6.7 keV were detected during both the observations. During BeppoSAX observations of KS 1947+300 in 2001 outburst, an emission line at 6.7 keV was detected whereas iron Kα line was absent in the pulsar spectra (Naik et al. 2006). The 6.7 keV line was identified as the emission feature from helium like iron atoms. A cyclotron absorption feature at 12.2 keV was detected in KS 1947+300 from NuSTAR observations during 2013 outburst (Fürst et al. 2014). Detection of cyclotron line is an unique tool to direct estimate the magnetic field of the pulsar by using 12-B-12 rule or Ecyc=11.6B. Using the detected cyclotron absorption line at 12.2 keV, the strength of surface magnetic was estimated to be 1.1(1+z) G (Fürst et al. 2014). Though the pulsar was observed with NuSTAR at three epochs, the cyclotron line was detected only during the second observation and there was no signature of the presence of its harmonics in the pulsar spectrum. We also did not find harmonics of the 12.2 keV cyclotron line in pulsar spectra obtained from Suzaku observations. There are several pulsars where fundamental cyclotron line is seen in the broad-band spectra without the detection of its harmonics e.g. Cen X-3 (Suchy et al. 2008; Naik et al. 2011), Swift J1626.6-5156 (DeCesar et al. 2013), IGR J17544-2619 (Bhalerao et al. 2015). The 1-100 keV luminosity of the pulsar was estimated to be 9.81037 and 1.31038 ergs s-1 during first and second Suzaku observations, respectively. Critical luminosity was calculated to investigate the luminosity regime of the pulsar by assuming parameters of a canonical neutron star with cyclotron line energy at 12.2 keV in the relation of Becker et. al. (2012). This was estimated to be 1.61037 ergs s-1. It is clear that the pulsar was accreting in the super-Eddington regime (above the critical luminosity) during 2013 October (present work) and 2000 November (Naik et al. 2006) outbursts.
In summary, we reported on the timing and broad-band spectral properties of the pulsar KS 1947+300 by using Suzaku observations taken during the 2013 outburst. Soft X-ray pulse profiles were found to be smooth and single peaked. However, hard X-ray pulse profiles showed the presence of an absorption dip like feature. The 1-110 keV broad-band spectrum of the pulsar was described with a partially absorbed NPEX continuum model along with a blackbody component. Phase-resolved spectroscopy revealed marginal enhancement in the additional column density at dip phase which suggests that the dip is not because of the absorption of hard X-ray photons. Other mechanism such as geometrical effect can be the probable cause for the presence of dip in the hard X-ray pulse profiles of KS 1947+300. Detection of pulsation in the soft X-ray excess flux confirmed that the emitting region is close to the neutron star e.g. near the accretion column. The presence of soft X-ray excess may be the cause of the absence of the dip in soft X-ray profiles. We estimated the magnetic field of the pulsar by using the observed spin-up rate during Suzaku and NuSTAR observations. The value was found to be 1.21012 G and comparable to that obtained from the cyclotron line energy.
Acknowledgments
We sincerely thank the referee for his valuable comments and suggestions which improved the paper significantly. The research work at Physical Research Laboratory is funded by the Department of Space, Government of India. The authors would like to thank all the members of the Suzaku for their contributions in the instrument preparation, spacecraft operation, software development, and in-orbit instrumental calibration. This research has made use of data obtained through HEASARC Online Service, provided by the NASA/GSFC, in support of NASA High Energy Astrophysics Programs.
References
- [] Becker, P. A., Klochkov, D., Schönherr, G., Nishimura, O., Ferrigno, C. et al. 2012, A&A, 544, 123
- [] Bhalerao, V., et al. 2015, MNRAS, 447, 2274
- [] Borozdin, K., Gilfanov, M., Sunyaev, R., et al. 1990, SvAL, 16, 345
- [] Caballero, I., Kraus, U., Santangelo, A., Sasaki, M., Kretschmar, P., 2011, A&A, 526, 131C
- [] Caballero, I. & Wilms, J., 2012, MmSAI, 83, 230
- [] Chakrabarty, D., Koh, T., Bildsten, L., et al. 1995, ApJ, 446, 826
- [] DeCesar, M. E., Boyd, P. T., Pottschmidt, K., Wilms, J., Suchy, S., Miller, M. C., 2013, ApJ, 762, 61
- [] Ferrigno, C., Falanga, M., Bozzo, E., Becker, P. A., Klochkov, D., Santangelo, A. 2011, A&A, 532, A76
- [] Finger, M. H., Jenke, P. A. and Wilson-Hodge, C. A. 2015, Astron. Telegram, 7017, 1
- [] Fürst, F., et al. 2014, ApJ, 784, L40
- [] Galloway, D. K., Morgan, E. H., Levine A. M. 2004, ApJ, 613, 1164
- [] Ghosh, P., Lamb, F. K. 1979, ApJ, 234, 296
- [] Hickox, R. C., Narayan, R. & Kallman, T. R. 2004, ApJ, 614, 881
- [] James, M., Paul, B., Devasia, J., Indulekha, K. 2010, MNRAS, 407, 285
- [] Jaisawal, G. K., Naik, S. & Epili, P. 2016, MNRAS, (in press), arXiv:1601.02348
- [] Koyama, K. et al. 2007, PASJ, 59, 23
- [] Kraus, U., Nollert, H.-P., Ruder, H., Riffert, H. 1995, ApJ, 450, 763
- [] Levine, A., Corbet, R. 2000, IAU Circ. 7523
- [] Mitsuda, K. et al., 2007, PASJ, 59, 1
- [] Naik, S. & Paul, B. 2002, JApA, 23, 27
- [] Naik, S. & Paul, B. 2004, ApJ, 600, 351
- [] Naik, S., Callanan, P. J., Paul, B., Dotani, T. 2006, ApJ, 647, 1293
- [] Naik, S., Paul, B., Ali, Z. 2011, ApJ, 737, 79
- [] Naik, S., Maitra, C., Jaisawal, G. K., Paul, B. 2013, ApJ, 764, 158
- [] Naik, S. & Jaisawal, G. K. 2015, RAA, 15, 537
- [] Negueruela, I., Israel, G. L., Marco, A., Norton, A. J., & Speziali, R. 2003, A&A, 397, 739
- [] Nowak, M. A., Hanke, M., Trowbridge, S. N., et al. 2011, ApJ, 728, 13
- [] Okazaki, A. T. & Negueruela, I. 2001, A&A, 377, 161
- [] Paul, B. & Naik, S. 2011, Bull. Astron. Soc. India, 39, 429
- [] Postnov, K. A., Mironov, A. I., Lutovinov, A. A., Shakura, N. I., Kochetkova, A. Yu., Tsygankov, S. S. et al. 2015, MNRAS, 446, 1013
- [] Reig, P. 2011, Ap&SS, 332, 1
- [] Sasaki, M., Müller, D., Kraus, U., Ferrigno, C., Santangelo, A., 2012, A&A, 540A, 35S
- [] Schönherr, G., et al. 2014, A&A, 564, 8
- [] Serlemitsos, P. J., et al. 2007, PASJ, 59, S9
- [] Shakura, N., Postnov, K., Kochetkova, A., Hjalmarsdotter, L., MNRAS, 2012, 420, 216
- [] Skinner, G. K. 1989, IAU Circ. 4850
- [] Suchy, S., Pottschmidt, K., Wilms, J., Kreykenbohm, I., Schöherr, G. et al. 2008, ApJ, 675, 1487
- [] Swank, J. & Morgan, E. 2000, IAUC, 7531, 4
- [] Takahashi, T., et al., 2007, PASJ, 59, 35
- [] Tsygankov, S. S., Lutovinov, A. A. 2005, AstL, 31, 88
- [] Tsygankov, S. S., Lutovinov, A. A., Churazov, E. M. & Sunyaev, R. A. 2006, MNRAS, 371, 19
- [] Waters, L. B. F. M., van den Heuvel, E. P. J., Taylor, A. R., Habets, G. M. H. J., Persi, P. 1988, A&, 198, 200