Effects of electron temperature anisotropy on proton mirror instability evolution
Abstract
Proton mirror modes are large amplitude nonpropagating structures frequently observed in the magnetosheath. It has been suggested that electron temperature anisotropy can enhance the proton mirror instability growth rate while leaving the proton cyclotron instability largely unaffected, therefore causing the proton mirror instability to dominate the proton cyclotron instability in Earth’s magnetosheath. Here, we use particle-in-cell simulations to investigate the electron temperature anisotropy effects on proton mirror instability evolution. Contrary to the hypothesis, electron temperature anisotropy leads to excitement of the electron whistler instability. Our results show that the electron whistler instability grows much faster than the proton mirror instability and quickly consumes the electron free energy, so that there is no electron temperature anisotropy left to significantly impact the evolution of the proton mirror instability.
I Introduction
There is a region of the dayside magnetosheath which is characterized by temperature anisotropy , where and indicates the perpendicular and parallel temperatures relative to the background magnetic field , respectively. The temperature anisotropy is caused by plasma heating at the quasi-perpendicular bow shock and field-line draping close to the magnetopause as shown by Midgley and Davis midgleycalculation1963 and by Zwan and Wolf zwandepletion1976 . This temperature anisotropy leads to the generation of low frequency waves. For , where shows proton temperature, proton cyclotron waves kennellimit1966 and proton mirror waves chandrasekharthe1958 ; hasegawadrift1969 are generated, and for , where stands for electron temperature, electron whistler waves kennellimit1966 ; scharercyclotron1967 and electron mirror waves garylinear2006 can grow. The proton cyclotron instability is a resonant instability and it propagates parallel to the background magnetic field with frequencies less than the proton gyrofrequency () while the proton mirror instability has zero frequency () in the plasma frame and its wave vector is oblique to the background magnetic field. Here, denotes the proton gyrofrequency. The mirror instability creates magnetic depressions or magnetic mirrors in the plasma which can trap particles and in this way, particles exchange their kinetic energy to the wave and instability grows, as shown by Southwood and Kivelsonsouthwoodmirror1993 . Linear theory predicts that mirror modes are more likely to be dominant in high regions of the magnetosheath while proton cyclotron modes are dominant in the low plasma conditions, where is the ratio between parallel proton pressure to magnetic pressure.garythe1992
The electron whistler waves propagate parallel to the background magnetic field with frequencies larger than proton gyrofrequency and smaller than electron gyrofrequency (), where is the electron gyrofrequency. The electron mirror instability is similar to the proton mirror instability but its wavelength is of the order of electron inertial length (). All of these instabilities compete with each other to consume the available free energy of the system which is constrained in the temperature anisotropies. Proton cyclotron and proton mirror instabilities compete with each other for the available free energy in proton temperature anisotropy while electron whistler and electron mirror instabilities compete for consuming the electron temperature anisotropy. But there is also a competition between proton mirror instability and electron whistler instability to consume the available electron free energy which we are interested to study in this paper.
There are frequent observations of proton mirror mode structures in the Earth’s magnetosheath.kaufmannlarge1970 ; tsurutanilion1982 Proton mirror modes have also been observed in the solar wind winterhalterulysses1994 , at cometsrussellmirror1987 , in the magnetosheaths of other planets like Jupiter and Saturn erdos1996 ; cattaneoevolution1998 , and in the heliosheath.burlagatrains2006 Proton mirror modes have been observed in regions with low proton plasma beta , although the linear dispersion theory predicts that proton cyclotron mode should be the dominant mode in these regions. Price et al. pricenumerical1986 showed that the presence of heavy ions tends to suppress the proton cyclotron instability while the growth rate of the proton mirror instability is not significantly affected. This can be one possible mechanism for proton mirror modes to dominate proton cyclotron instability.garythe1992 ; garyion1993
Shoji et al. shojimirror2009 performed two and three dimensional hybrid simulations to study the competition between these two modes. They suggested that in three dimensional simulations, proton mirror modes consume most of the free energy of the system and it stops the growth of the proton cyclotron waves. Porazik and Johnson poraziklinear2013 used the gyrokinetic theory to derive the linear dispersion relation for the proton mirror instability and provided a coherent view of different kinetic approaches that is used to obtain the dispersion relation.
The purpose of this work is to study the effects of electron temperature anisotropy on the evolution of proton mirror instability. Linear dispersion theory shows that the electron temperature anisotropy enhances the proton mirror instability growth rate but it doesn’t affect the proton cyclotron instability growth rate significantly.garythe1992 Since we need to consider electron dynamics, we use particle in cell simulations to include kinetic effects of both protons and electrons. Electrons get anisotropically heated in the shock layer similar to protons burgess2012 . Some previous studies have assumed electrons to be isotropic, since they performed hybrid simulations which treats electrons as a fluid shojimirror2009 ; hellingermagnetosheath2005 . However, Tsurutani et al. tsurutanilion1982 have shown that the electron temperature anisotropy is generally larger than in Earth’s magnetosheath.
Masood et al. masoodobservations2008 analyzed Cluster data in Earth’s magnetosheath and found that electrons exhibit significant temperature anisotropy in the deep magnetosheath due to magnetic field line draping while being isotropic downstream of the quasi-perpendicular bow shock. Remya et al. remyaion2013 used linear theory to study the role of electron temperature anisotropy on the proton cyclotron and proton mirror instabilities and they conclude that an inclusion of anisotropic electrons with reduces the proton cyclotron growth rate substantially and increases the proton mirror instability growth rate. But we need to mention that they are ignoring the electron whistler instability presence.
In section 2, we solve the linear dispersion relation to find the growth rates of the instabilities for given plasma parameters. In section 3, we benchmark our kinetic code with linear dispersion theory for both proton temperature anisotropy and electron temperature anisotropy instabilities. In section 4, we present simulation results for different proton to electron mass ratios and how electron anisotropy affects the growth of the proton mirror instability. In section 5, we discuss the conclusions.
II Linear Analysis
We solved the linear dispersion relation for a homogeneous, collisionless plasma with bi-Maxwellian distributions to measure the growth rates of the temperature anisotropy instabilities for typical magnetosheath plasma parameters. We consider two species: protons and electrons. We assume charge neutrality and zero relative drift between the electrons and protons.stix1962 Solutions of the linear dispersion equation are typically expressed in terms of dimensionless variables. It is natural to use electron inertial length and electron gyrofrequency as normalizing factors for electrons and proton inertial length and proton gyrofrequency for normalizing proton related instabilities.
In Earth’s magnetosheath, the distributions become anisotropic because of heating of the particles across the quasi-perpendicular bow shock and field line draping. The time scale of the heating through the shock is about one proton gyroperiod. This time scale is very fast and does not allow the proton instabilities to grow in the shock layer. Therefore a considerable amount of proton temperature anisotropy is left downstream of the quasi-perpendicular shock in the magnetosheath. For electrons, on the other hand, one proton gyroperiod equals 1836 electron gyroperiods. Thus, electron instabilities have sufficient time to grow and isotropize the electron distributions. Therefore, we consider high proton temperature anisotropies and lower electron temperature anisotropies to resemble the magnetosheath plasma conditions downstream of the quasi-perpendicular shock.burgess2012
II.1 Competition between electron whistler and electron mirror instability
Figure 1 shows the instability thresholds for electron whistler and electron mirror instabilities. We keep and . The instability thresholds () are measured using linear dispersion theory. refers to maximum growth rate. Comparing the electron whistler and electron mirror instability growth rates in Figure 1, we clearly see that the electron whistler instability has a lower instability threshold than the electron mirror instability and it may therefore suppress the electron mirror mode. Observations show that electrons follow the marginal stability path of the electron whistler instability in Earth’s magnetosheath which indicates that electron whistler instability is the dominant instability.garyelectron2005

II.2 Competition between proton cyclotron and proton mirror instability
In the case of the proton temperature anisotropy instabilities, the proton cyclotron instability has larger growth rate compared to the proton mirror instability for low proton plasma beta and it should be the dominant instability in the magnetosheath as shown in Figure 2. In Figure 2, we keep electrons isotropic and measure the proton cyclotron and mirror instability thresholds () using linear dispersion theory. It is clear that the proton cyclotron instability has larger growth rate compared to mirror instability for low and high . But observations show that in regions where we expect the dominance of the proton cyclotron instability, mirror instability has grown and it is the dominant mode. So the question is what helps the proton mirror instability to grow faster than the proton cyclotron instability in low regions?
One possibility is the effects of electron temperature anisotropy on the proton mirror instability growth rate. Figure 3 shows that by increasing the electron temperature anisotropy, mirror instability growth rate increases while leaving the proton cyclotron instability only slightly affected. The reason is that proton cyclotron instability is a resonant instability and electrons do not resonate with the proton cyclotron mode, but they can get trapped in the magnetic bottles of the mirror instability and exchange energy with the wave.
In order to study the nonlinear effects of the electron dynamics on the evolution of the proton mirror instability, we use particle in cell simulations.


III Verification of PSC by comparison to linear dispersion theory
PSC is a state of the art electromagnetic particle-in-cell simulations code described by Germascheski et al.germaschewski2013 In this section, we compare the PSC results with linear dispersion theory. In order to show that PSC can capture temperature anisotropy instabilities correctly, we measured the growth rate of the instabilities from simulation in the linear regime for selected plasma parameters and compare with linear theory predictions. We start with bi-Maxwellian protons and Maxwellian electrons. We choose , , . We perform two-dimensional simulations with where and are the length of the simulation box in and directions, is the proton plasma frequency and is the proton inertial length. The number of grid points is . Periodic boundary conditions are used in both dimensions. A constant background magnetic field is assumed in the direction.
With anisotropic protons , proton cyclotron and proton mirror instabilities will grow. From linear theory, we expect the maximum growth rate of the proton cyclotron instability to be at and while the proton mirror instability maximum growth rate is with at as shown in Figure 4. is the angle between the wave number vector and . Figure 5 shows the temperature anisotropy evolution of both protons and electrons. Electrons remain isotropic. As proton cyclotron and proton mirror instabilities start growing, the proton temperature anisotropy decreases. The linear regime of the proton temperature anisotropy instabilities extends through about in this case. Figures 6 and 7 compare the measured maximum growth rate of proton cyclotron and proton mirror instabilities from simulation with linear dispersion theory predictions. The simulation results are in good agreement with linear theory.


We perform a similar benchmarking simulation for electron whistler and electron mirror instabilities to show that we are resolving the electron physics in our simulations. Here, we choose , , , and otherwise the same parameters as in the previous case. Now, with anisotropic electrons , electron whistler and electron mirror instability grow. Figure 8 shows the growth rate of electron whistler and electron mirror instabilities as a function of wave number . For the given plasma parameters, linear dispersion theory predicts that the maximum growth rate of the electron whistler instability is at and while electron mirror instability has a maximum growth rate of at and . Figure 9 shows the temperature anisotropy evolution. The proton distribution stays in equilibrium and isotropic. The electron temperature anisotropy instabilities consume the electron free energy and isotropize the electrons. The linear regime of the electron whistler instability lasts to about , while the linear regime of electron mirror instability would extend to since electron mirror instability maximum growth rate is about times smaller than the electron whistler instability maximum growth rate. Figures 10 and 11 show the comparisons of the measured growth rates from simulation with linear dispersion theory predictions. We see that the results are in a good agreement with the predictions.


IV Simulation Results
We again use PSC to obtain the results of this section, simulating the full nonlinear evolution of the concurrent temperature anisotropy instabilities. First, we start with bi-Maxwellian distributions for both protons and electrons. We choose parameters that are characteristic of the magnetosheath. In particular, the plasma parameters are , , and . In the magnetosheath, electrons are about times colder than protons. We choose electron temperature to be times colder because of the limitations of PIC simulations. We need to resolve the electron Debye length and colder electrons means smaller electron Debye length which needs finer grid resolutions. We perform two-dimensional particle-in-cell simulations. A constant background magnetic field is assumed in the direction where is the proton Alfvén speed and is speed of light. In the magnetosheath, is about , which would lead to unnecessarily small time steps in PIC simulations. We artificially lower the speed of light in our simulations, to make the simulations computationally less expensive. At the same time, we made sure to still keep small enough to avoid introducing significant relativistic effects. The number of grid points are . Periodic boundaries are used in each dimension. The number of particles used is on average particles/cell. The size of the grid cells is taken to be .
For these parameters, linear theory predicts, the maximum growth rate of proton cyclotron instability to be at , while the proton mirror instability maximum growth rate is with at . The electron whistler instability maximum growth rate is with .
Since there is an electron temperature anisotropy (), the electron whistler instability grows and rapidly isotropizes the electron distribution. Also, the proton cyclotron and the proton mirror instability grow due to the presence of the proton temperature anisotropy ().
We choose different mass ratios and examine the electron temperature anisotropy evolution compared to the proton temperature anisotropy changes. Figure 12 shows the dependence of electron temperature anisotropy evolution as a function of proton to electron mass ratio () in PIC simulations. We only show the linear regime of the proton instabilities which lasts to about in this case, because we want to see how much electron temperature anisotropy is left when the proton instabilities start to grow nonlinearly. Figure 13 shows the proton temperature anisotropy as a function of time for different . Since we are keeping constant in all simulations, we expect the same linear regime for proton temperature anisotropy instabilities. Figure 12 shows that as we increase the mass ratio, the linear regime of the electron whistler instability becomes shorter since we are making the electrons faster and closer to reality. For , at the end of proton instabilities linear regime, when proton instabilities start growing nonlinearly, there is no electron temperature anisotropy left for proton mirror instability to take advantage of. So electron anisotropy cannot help the proton mirror mode to dominate over the proton cyclotron instability, unless there is a mechanism that constantly drives the electron temperature anisotropy in the magnetosheath. The adiabatic expansion close to the magnetopause, in the plasma depletion layer, could be a continuous driver of the temperature anisotropies. While the electron distribution isotropizes more slowly at compared to larger mass ratios, it still leads to essentially isotropic distributions at the end of proton instabilities linear regime.


In order to examine the effects of electron temperature anisotropy on the proton mirror instability in more detail, we perform two simulations with similar parameters and different electron temperature anisotropies. In one simulation we keep electrons isotropic and in another one, we start with . The simulation parameters are , , , and . We use to keep the computational cost manageable. While we have shown that by the end of the proton linear phase, the electrons have essentially isotropized both at this as well as at the real mass ratio, the artificially lowered mass ratio exaggerated the effects of the electron anisotropy. This is actually helpful as it allows us to more clearly identify the impact on the proton instabilities.
Figure 14 shows the components of the magnetic field at different timesteps from the simulation with anisotropic electrons (). We can see that at early timesteps, electron whistler waves gets excited and are propagating along the background magnetic field. As time goes on, the electron whistler instability saturates and both the proton cyclotron and the proton mirror instability start growing. It is clear that proton cyclotron waves are propagating along the background magnetic field while proton mirror waves are present in the direction oblique to the background magnetic field.
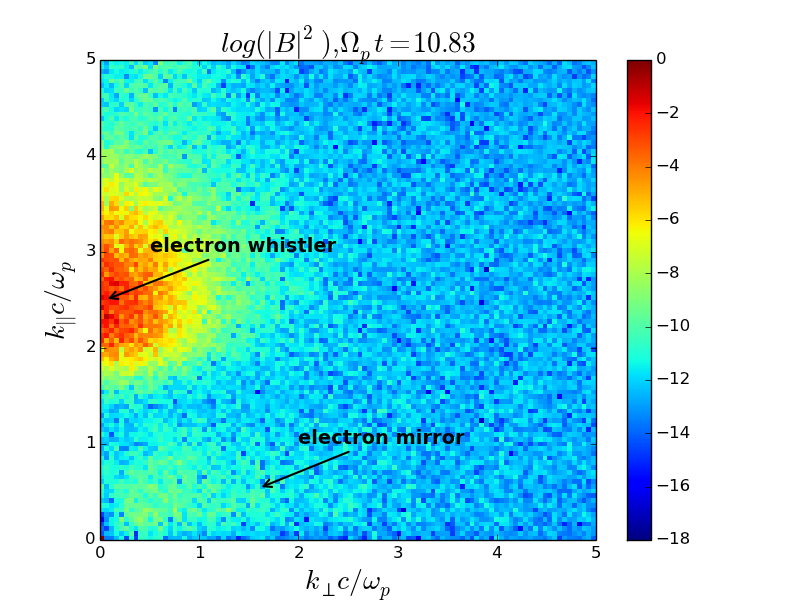
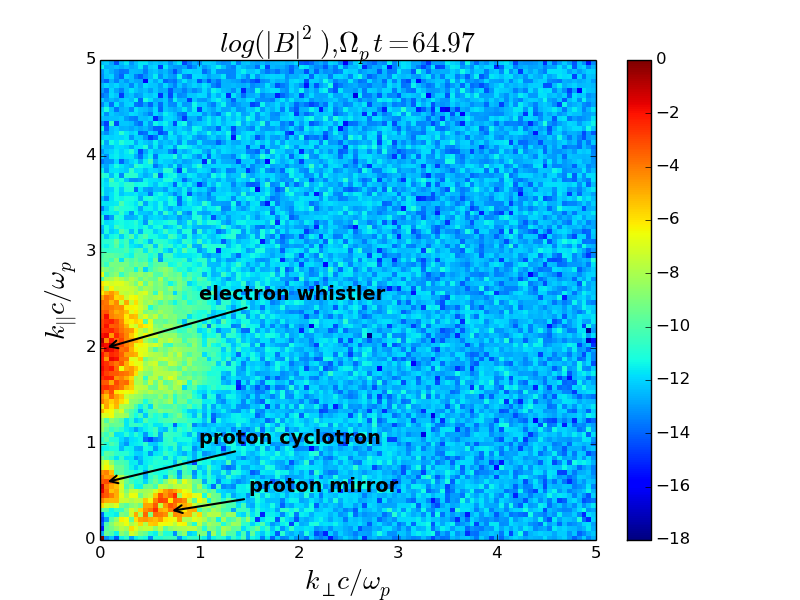
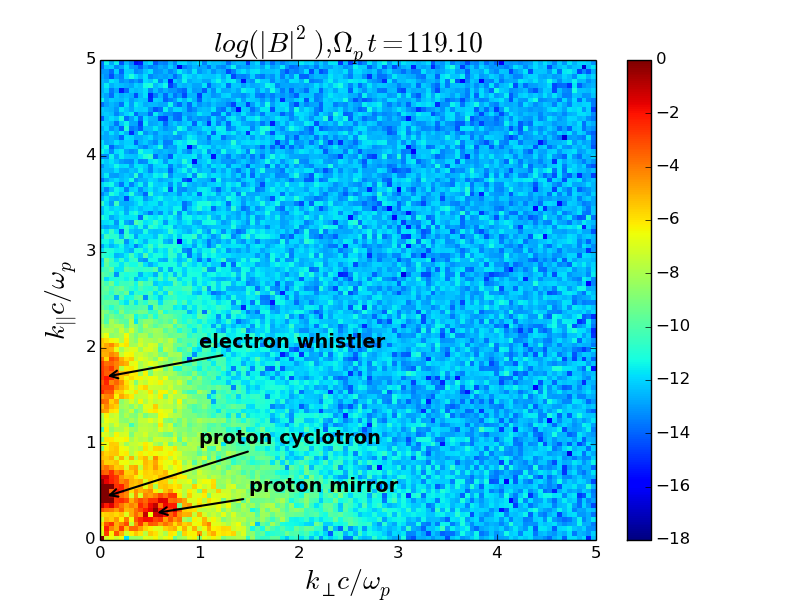
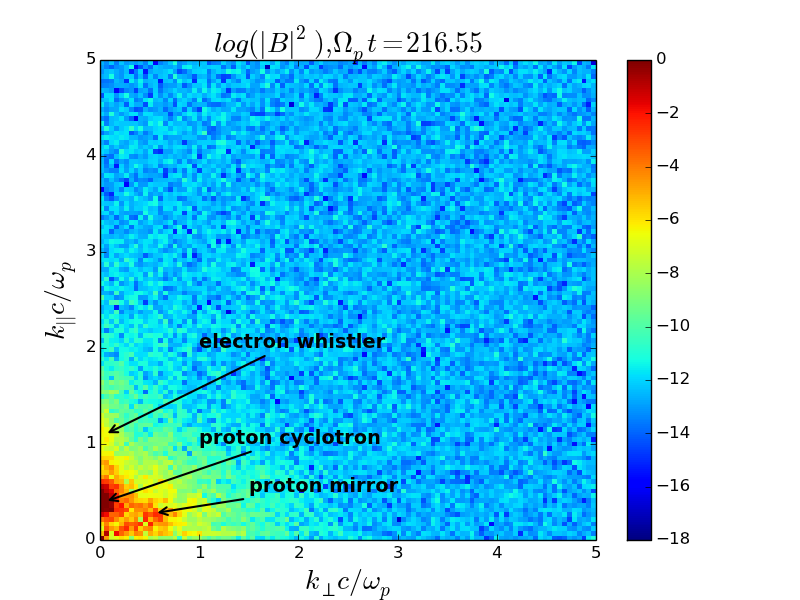
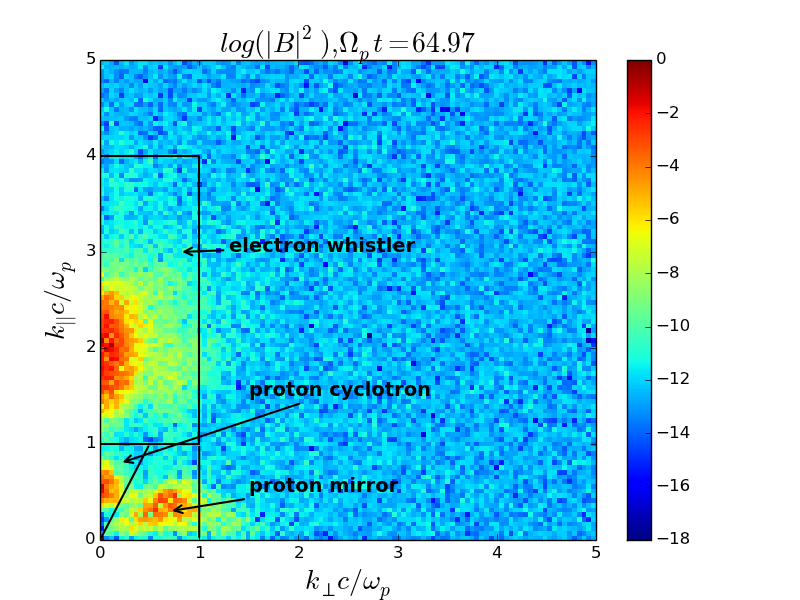
Figure 15 shows the spectrum of the total magnetic field in wavenumber space at different times. Each instability has been marked in the spectrum in the Figure 15. The electron mirror instability is about times weaker than the electron whistler instability. At early times, the electron whistler instability is the dominant mode. At later times, the proton cyclotron and the proton mirror instability start growing while the electron whistler instability is still present.


We make cuts in the along direction at and in the along direction at from Figure 14. The and cuts are shown in Figure 16. These cuts resemble the satellite crossings at the locations where these instabilities would typically be present. In Figure 16, we see the electron scale wavelengths that are electron whistler waves and later, proton scale wavelength structures grow which are a combination of proton cyclotron and proton mirror mode waves. In the cuts in Figure 16, the proton scale structures are proton mirror waves since proton cyclotron waves cannot have perturbations in the direction of the background magnetic field.
In Figure 17, the evolution of proton and electron temperature anisotropy is shown. The proton instabilities start growing nonlinearly around . At this time, the electron temperature anisotropy is still . For plasma parameters at this timestep, the proton mirror instability is stronger than the proton cyclotron instability. The proton cyclotron maximum growth rate is at while proton mirror instability maximum growth rate is with at . Then, in the nonlinear regime, both instabilities are present as shown in Figure 15.

Figure 19 shows the time evolution of the magnetic energy density of proton cyclotron, proton mirror mode and electron whistler waves. We measure the magnetic energy density of each wave by filtering the wave spectra for each mode. The wave spectra shows three ranges for wave number vector space as seen in Figure 18. We define the proton cyclotron instability range to be and proton mirror instability range is for . For electron whistler instability, we choose but the wave number range is and . We find a significant difference between the saturation levels of the proton cyclotron and the proton mirror instabilities between isotropic and anisotropic electron cases. In the isotropic case, shown in Figure 19 with dashed lines, the magnetic energy density of the proton cyclotron instability is much larger than that of the proton mirror instability. With isotropic electrons, the proton cyclotron instability maximum growth rate is about 3 times stronger than the proton mirror instability, and we expect proton cyclotron instability to consume most of the available free energy. In the anisotropic electrons case, the proton mirror instability maximum growth rate is larger than that of the proton cyclotron instability, but we see that the magnetic energy density of the proton cyclotron instability is still more than that of the proton mirror instability. Also, the proton mirror instability gains more magnetic energy density compared to the isotropic electron case, which shows that the electron anisotropy affects the proton mirror instability evolution. At late times, when electrons become isotropic, the instabilities in both simulations saturate at roughly the same magnetic energy density levels. Also, we see that the proton cyclotron instability starts growing at a slightly different time when an electron temperature anisotropy is present, since the presence of an electron temperature anisotropy decreases the proton cyclotron instability growth rate. The proton mirror instability starts growing earlier in the anisotropic electron case, because the electron anisotropy enhances the proton mirror instability growth rate.

V Summary and Conclusion
In this work, we have investigated the effects of electron temperature anisotropy on the proton mirror instability evolution. Linear theory predicts that presence of an electron temperature anisotropy can enhance the proton mirror instability growth rate, and if it is large enough, it can make the proton mirror instability stronger than the proton cyclotron instability. We showed that anisotropic electrons, however, primarily drive the electron whistler instability. We performed two-dimensional PIC simulations with different electron to proton mass ratios. We studied how varying the mass ratio affects the electron whistler instability evolution and how it impacts the proton cyclotron and proton mirror instability growth rates. We find that the electron whistler instability consumes the electron free energy before the proton mirror instability grows into the nonlinear regime, because it grows much faster than the proton temperature anisotropy instabilities. Therefore, all the electron free energy is gone quickly and has little impact on the much slower proton mirror instability that has barely started growing by that time. Our results show that temperature anisotropy instabilities are sensitive to the chosen mass ratio in PIC simulations, since an artificial mass ratio can affect the growth and dynamics of the instabilities.
If there is a mechanism in the magnetosheath that keeps , it can enhance the proton mirror instability growth rate. For example, the adiabatic expansion in the plasma depletion layer close to the magnetopause makes . We will investigate this scenario further in future work.
Acknowledgements.
This work was supported by National Science Foundation grant AGS-1056898 and Department of Energy grant DESC0006670. Computations were performed using the following resources: Trillian, a Cray XE6m-200 supercomputer at UNH supported by the NSF MRI program under grant PHY-1229408; XSEDE resources under contract No. TG-MCA98N022.References
- (1) J. E. Midgley and L. Davis, “Calculation by a moment technique of the perturbation of the geomagnetic field by the solar wind,” J. Geophys. Res., vol. 68, no. 18, pp. 5111–5123, 1963.
- (2) B. J. Zwan and R. A. Wolf, “Depletion of solar wind plasma near a planetary boundary,” J. Geophys. Res., vol. 81, 1976.
- (3) C. F. Kennel and H. E. Petschek, “Limit on stably trapped particle fluxes,” J. Geophys. Res., vol. 71, 1966.
- (4) S. Chandrasekhar and A. N. Kaufman, “The stability of the pinch,” Proc. R. Soc. Lond. Ser. A, vol. 245, 1958.
- (5) A. Hasegawa, “Drift mirror instability in the magnetosphere,” Physics of Fluids, vol. 12, no. 12, p. 2642, 1969.
- (6) J. E. Scharer and A. W. Trivelpiece, “Cyclotron wave instabilities in a plasma,” Physics of Fluids, vol. 10, 1967.
- (7) S. P. Gary and H. Karimabadi, “Linear theory of electron temperature anisotropy instabilities: Whistler, mirror, and weibel,” J. Geophys. Res., vol. 111, no. A11, 2006.
- (8) D. J. Southwood and M. G. Kivelson, “Mirror instability: 1. physical mechanism of linear instability,” J. Geophys. Res., vol. 98, pp. 9181–9187, 1993.
- (9) S. P. Gary, “The mirror and ion cyclotron anisotropy instabilities,” J. Geophys. Res., vol. 97, pp. 8519–8529, 1992.
- (10) R. L. Kaufmann, J. T. Horng, and A. Wolfe, “Large‐amplitude hydromagnetic waves in the inner magnetosheath,” J. Geophys. Res., vol. 75, pp. 4666,4676, 1970.
- (11) B. T. Tsurutani, E. J. Smith, and R. R. Anderson, “Lion roars and nonoscillatory drift mirror waves in the magnetosheath,” J. Geophys. Res., vol. 87, pp. 6060,6072, 1982.
- (12) D. Winterhalter, M. Neugebauer, B. E. Goldstein, E. J. Smith, S. J. Bame, and A. Balogh, “Ulysses field and plasma observations of magnetic holes in the solar wind and their relation to mirror‐mode structures,” J. Geophys. Res., vol. 99, no. A12, pp. 23371–23381, 1994.
- (13) C. T. Russell and W. Riedler, “Mirror instability in the magnetosphere of comet halley,” Geophysical Research Letters, vol. 14, pp. 644–647, 1987.
- (14) G. Erdos and A. Balogh, “Statistical properties of mirror mode structures observed by ulysses in the magnetosheath of jupiter,” J. Geophys. Res., vol. 101, pp. 1–12, 1996.
- (15) M. B. Cattaneo, C. Basile, and G. Moreno, “Evolution of mirror structures in the magnetosheath of saturn from the bow shock to the magnetopause,” J. Geophys. Res., vol. 103, pp. 11961–11972, 1998.
- (16) L. F. Burlaga, N. F. Ness, and M. H. Acũna, “Trains of magnetic holes and magnetic humps in the heliosheath,” Geophysical Research Letters, vol. 33, 2006.
- (17) C. P. Price, D. W. Swift, and L. C. Lee, “Numerical simulation of nonoscillatory mirror waves at the earth’s magnetosheath,” J. Geophys. Res., vol. 91, 1986.
- (18) S. P. Gary, S. A. Fuselier, and B. J. Anderson, “Ion anisotropy instabilities in the magnetosheath,” J. Geophys. Res., vol. 98, no. A2, pp. 1481–1488, 1993.
- (19) M. Shoji, Y. Omura, and B. T. Tsurutani, “Mirror instability and l‐mode electromagnetic ion cyclotron instability: Competition in the earth’s magnetosheath,” J. Geophys. Res., vol. 114, 2009.
- (20) P. Porazik and J. R. Johnson, “Linear dispersion relation for the mirror instability in context of the gyrokinetic theory,” Physics of Plasmas, vol. 20, 2013.
- (21) D. Burgess, E. Mobius, and M. Scholer, “Ion acceleration at the earth’s bow shock,” Space Science Review, vol. 173, pp. 5–47, 2012.
- (22) P. Hellinger and P. M. Trávníček, “Magnetosheath compression: Role of characteristic compression time, alpha particle abundance, and alpha/proton relative velocity,” J. Geophys. Res., vol. 110, 2005.
- (23) W. Masood and S. J. Schwartz, “Observations of the development of electron temperature anisotropies in earth’s magnetosheath,” J. Geophys. Res., vol. 113, 2008.
- (24) B. Remya, R. V. Reddy, B. T. Tsurutani, G. Lakhina, and E. Echer, “Ion temperature anisotropy instabilities in planetary magnetosheaths,” J. Geophys. Res., vol. 118, no. 2, pp. 785–793, 2013.
- (25) T. H. Stix, The theory of plasma waves. McGraw-Hill, 1962.
- (26) S. P. Gary, B. Lavraud, M. F. Thomsen, B. Lefebvre, and S. J. Schwartz, “Electron anisotropy constraint in the magnetosheath: Cluster observations,” Geophysical Research Letters, vol. 32, no. 13, 2005.
- (27) K. Germaschewski, W. Fox, N. Ahmadi, and L. Wang, “The plasma simulation code: A modern particle-in-cell code with load-balancing and GPU support,” arXiv:1310.7866, 2013.