Raman phonon spectrum of the Dzyaloshinskii-Moriya helimagnet Ba2CuGe2O7
Abstract
The Raman spectrum of Ba2CuGe2O7, a tetragonal insulator which develops Dzyaloshinsky-Moriya helical magnetism below = 3.2 K, has been detected at temperatures varying from 300 to 80 K in a single crystal, with the radiation polarized either in the plane or along the axis of its tetragonal cell. 29 phonon lines out of the 35 allowed by the Raman selection rules for the present geometry were observed, and their vibrational frequencies were found in overall good agreement with those provided by shell-model calculations. Together with the previous report on the infrared-active phonons [A. Nucara et al., Phys. Rev. B 90, 014304 (2014)] the present study provides an exhaustive description, both experimental and theoretical, of the lattice dynamics in Ba2CuGe2O7.
pacs:
78.30.-j, 78.30.Hv, 63.20.-eI Introduction
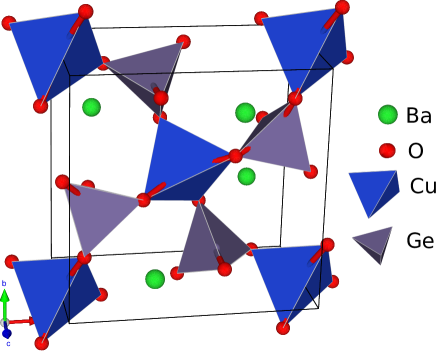
Ba2CuGe2O7 (BCGO) is an insulating oxide that has been recently the object of several studies after the discovery that it develops helical magnetism at liquid helium temperatures Zheludev1 ; Zheludev2 ; Chovan via the Dzyaloshinsky-Moriya (DM) mechanism D ; M . This behavior is unique even in the Ba2XGe2O7 family, as the members with =Mn or Co are magnetoelectric antiferromagnets (AF) at low temperatures. Below = 3.2 K, BCGO displays a quasi-AF cycloidal, incommensurate magnetism and, despite the absence of a center of inversion symmetry in the crystal structure, it does not display spontaneous ferroelectricity Zheludev03 . Nevertheless, BCGO is usually considered a multiferroic material because it develops macroscopic electric polarization in an external magnetic field Murakawa09 . Figure 1 shows Zheludev2 its non-centrosymmetric tetragonal unit cell (space group Tovar98 P4̄21m), which corresponds to two formula units. The lattice parameters are = 0.8466 nm and = 0.5445 nm at room temperature. The layers made of corner-sharing GeO4 and CuO4 tetrahedra are separated by Ba2+ planes. A square lattice of Cu2+ ions thus results, where below the Cu spins interact with each other through the DM mechanism producing the helical magnetic structure. The infrared (IR) spectra did not reveal any structural transition between 7 and 300 K. It was detected instead a strong enhancement of the infrared intensity at low temperature, which suggests a redistribution of the electron charge in the unit cell with a possible increase of the dielectric constant Nucara14 . It is worth noting that strong effects on the infrared phonon lines were observed at low-temperature on the (under)doped Cu-O planes of high- superconductors Calvani95 . Therein, similarly to the present case, the charges move in a two-dimensional, strongly polar environment.
This work is aimed at completing the description of the lattice dynamics in BCGO by presenting its Raman phonon spectrum, as it comes out both from experimental observations and from shell-model calculations.
II Experiment and results
Single crystals of Ba2CuGe2O7 were grown and characterized as described in Ref. Fittipaldi, . The surface exposed to the radiation was or , as the and axes are degenerate. In the following, we shall conventionally assume that it was .The Raman spectra were measured with a Horiba LabRAM HR Evolution micro-spectrometer in backscattering geometry. Samples were excited by the 632.8 nm radiation of a He-Ne laser with 30 mW output power, linearly polarized. Polarization rotators, properly located along the internal optical path, allowed us to align the electric field of the incident beam either along the crystalline axis or along . A small admixture of such polarizations could not be eliminated due to the finite numerical aperture of the microscope. We did not place an analyzer on the path of the back-scattered radiation as the grating itself, once tested on the 520 cm-1 phonon of a Si crystal, showed a filtering efficiency of about 80 in the direction orthogonal to the grooves. Elastically scattered light was removed by a state-of-the-art optical filtering device based on three BragGrate notch filters Glebov . Raman spectra in the 10-1000 cm-1 range were thus collected by a Peltier-cooled Charge-Coupled Device (CCD) detector with a spectral resolution better than 1 cm-1, thanks to a 1800 grooves/mm grating with 800 mm focal length. Measurements were performed with a long working distance 20x objective (numerical aperture NA=0.35). The sample was mounted on the cold finger of a liquid nitrogen-cooled horizontal cryostat by Oxford Instruments and the measurements were carried out in the 80-300 K temperature range. The system was thermoregulated by platinum thermometers, of which one was located very close to the sample. We thus obtained thermal stability within 2 K during data collection at each working temperature.
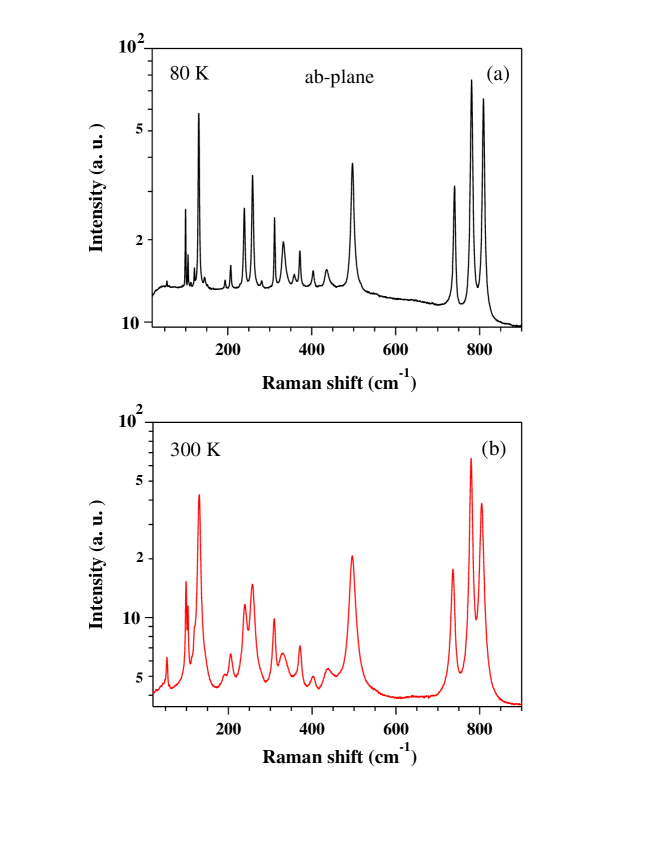
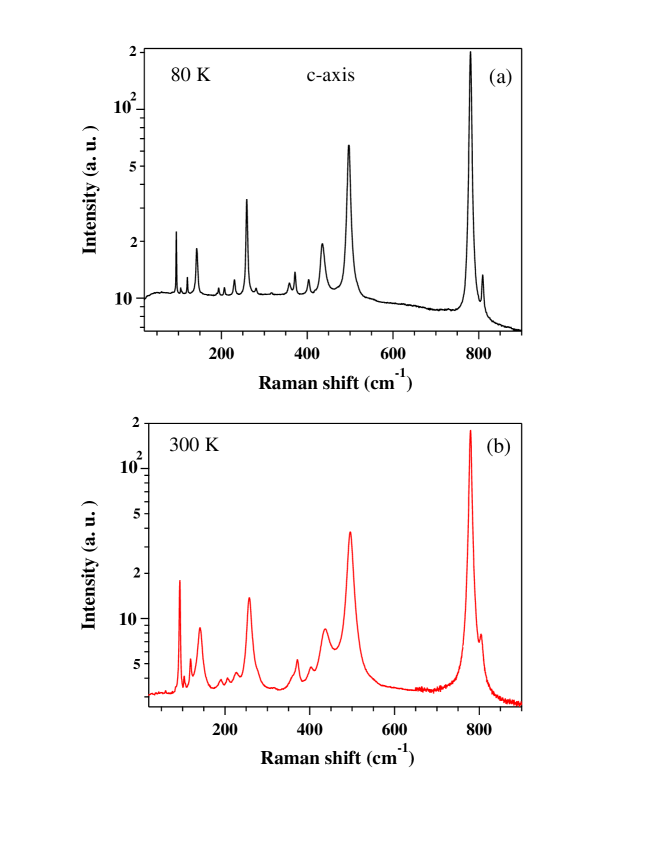
The results of Raman scattering in Ba2CuGe2O7 are shown in Fig. 2 for the radiation polarized along the axis and in Fig. 3 for the electric field along the axis. For sake of clarity, only spectra taken at 80 K and 300 K are reported, as no major effects were found to affect the phonon lines at intermediate temperatures. In order to assign the observed spectral features we start from the factor-group analysis, which predicts for the P4̄21m unit cell of Ba2CuGe2O7 the vibrational representation
| (1) |
where the modes are doubly degenerate. After excluding the acoustic phonons (one and one ) and the 6 silent modes, one is left with 45 optical phonons which, due to the lack of inversion symmetry, are in principle all Raman-active: the 18 and 10 vibrations of the plane, the 7 and 10 modes of the axis. However, as the wavevector of the incoming radiation is aligned along the crystalline axis , the selection rules for P4̄21m exclude the Raman lines of symmetry both with along and Bilbao . The phonons are also infrared active (as the ones) and most of them were reported in Ref. Nucara14, . In Fig. 2 we detect, at 80 K, 24 lines with along (two of which are extracted from a couple of asymmetric lines by fitting to data a sum of Lorentzians) while 17 lines are observed with along the axis in Fig. 3. Among the latter ones, however, only five are not replicas of those of the plane. Indeed, in the present geometry the modes are allowed in both polarizations. Moreover, as the Raman microscope has a rather large numerical aperture, has a small component along the crystal axis, which can partially mix the -plane modes with those of the axis. Nevertheless, one expects that the modes of the plane are either absent, or much weaker, when is along . The former case is that of modes 2 and 37 , the latter one of lines 4 and 42, as one can see by comparing with each other Figs. 2 and 3 where the intensities are on the same (arbitrary) scale. One thus obtains a first check of the assignment that is proposed in Table I. Given the high spectral resolution used in both experiments, the missing modes (three , one , and two ) are probably too weak to be observed.
After combining the 29 Raman lines observed here with the previous infrared observations, we could measure - and compare with the theoretical calculations - the frequencies and widths of 40 modes out of the 45 optical phonons predicted for Ba2CuGe2O7. Concerning the evolution of the spectra with temperature, both Figures show at low the usual narrowing of the lines but no meaningful increase in their intensity. This is at variance with the infrared absorption bands of BCGO, some of which become substantially stronger Nucara14 for indicating a charge redistribution inside the BCGO cell. Such a different behavior can be understood by considering that the matrix element of the infrared transition, unlike the Raman one, is driven directly by the dipole Hamiltonian associated with the lattice vibration.
| Phonon () | Symmetry | [80 K] | [300 K] | [80 K] | |||||
|---|---|---|---|---|---|---|---|---|---|
| 1 | 31 | ||||||||
| 2 | 59 | 55 | 53 | 7 | 0.01 | ||||
| 3 | 75 | 99 | 99 | 1.5 | 0.02 | 84 | 2 | 0.13 | |
| 4 | 108 | 105 | 104 | 1.5 | 0.01 | 103 | 2 | 0.04 | |
| 5 | 114 | 95 | 93 | 1,5 | 0.02 | ||||
| 6 | 121 | 112 | 112 | 1.5 | 0.01 | ||||
| 7 | 123 | 121 | 118 | 1,5 | 0.01 | ||||
| 8 | 129 | 131 | 130 | 2.5 | 0.12 | ||||
| 9 | 137 | 109 | 7 | 0.08 | |||||
| 10 | 142 | 145 | 4 | 0.01 | 152 | 7.5 | 0.07 | ||
| 11 | 149 | 143 | 141 | 4 | 0.04 | ||||
| 12 | 157 | 130 | 5 | 0.03 | |||||
| 13 | 168 | ||||||||
| 14 | 179 | 193 | 191 | 2 | 0.01 | 187 | 4 | 0.14 | |
| 15 | 198 | 147 | 3 | 0.57 | |||||
| 16 | 208 | 207 | 205 | 2.5 | 0.01 | ||||
| 17 | 224 | 217 | 4 | 0.12 | |||||
| 18 | 238 | 239 | 239 | 3.5 | 0.05 | ||||
| 19 | 258 | 259 | 257 | 3.5 | 0.09 | 257 | 21 | 0.15 | |
| 20 | 261 | 281 | 3 | 0.01 | 274 | 6 | 0.19 | ||
| 21 | 265 | 230 | 225 | 3 | 0.01 | ||||
| 22 | 267 | 278 | 4 | 0.01 | |||||
| 23 | 318 | 321 | 10 | 0.01 | |||||
| 24 | 319 | 311 | 309 | 2 | 0.03 | 310 | 11 | 0.42 | |
| 25 | 334 | 333 | 331 | 9 | 0.06 | 315 | 4 | 0.52 | |
| 26 | 339 | 359 | 7.5 | 0.01 | |||||
| 27 | 373 | 372 | 370 | 4 | 0.01 | ||||
| 28 | 374 | 372 | 370 | 4 | 0.02 | 367 | 8 | 0.12 | |
| 29 | 408 | 403 | 402 | 7 | 0.02 | ||||
| 30 | 412 | 390 | 15 | 0.27 |
| 31 | 443 | 436 | 437 | 10 | 0.03 | ||||
| 32 | 477 | 456 | 455 | 14 | 0.01 | ||||
| 33 | 488 | 448 | 11 | 0.17 | |||||
| 34 | 489 | 497 | 495 | 7 | 0.21 | ||||
| 35 | 517 | 515 | 517 | 14 | 0.01 | ||||
| 36 | 559 | 488 | 9 | 0.35 | |||||
| 37 | 766 | 740 | 736 | 4.5 | 0.10 | 710 | 7 | 1.00 | |
| 38 | 773 | 780 | 780 | 3.5 | 1.00 | ||||
| 39 | 776 | 781 | 779 | 4.5 | 0.34 | 714 | 10 | 0.30 | |
| 40 | 781 | 775 | 7 | 0.82 | |||||
| 41 | 782 | ||||||||
| 42 | 786 | 809 | 804 | 4.5 | 0.28 | 772 | 8 | 0.02 | |
| 43 | 794 | 791 | 17 | 0.40 | |||||
| 44 | 797 | ||||||||
| 45 | 836 | 844 | 7 | 0.10 |
The phonon frequencies , widths , and relative intensities of the Raman lines, as extracted from the spectra of Figs. 2 and 3 through Lorentzian fits that are not shown in the Figures as they practically coincide with the data, are listed in Table I. Each value is proportional to the area of the -th Lorentzian, normalized to that of the strongest Raman line. In the same Table are listed, for comparison, the corresponding infrared data at 7 K, where available (with the normalized to that of the strongest IR line), and the theoretical frequencies obtained by the Shell Model (SM). The latter calculations, which were described in detail in Ref. Nucara14, , are suitable to determine the lattice dynamics in compounds, like the oxides, where the effects of the anion polarizability cannot be neglected.koval92 ; lasave09 . They utilized the lattice constants and the atomic positions reported in Ref. Tovar98, . The calculated frequencies of the silent modes, not reported in the Table, are 48, 125, 203, 341, 416, and 817 cm-1. As one can see in Table I, the agreement between the theoretical calculations and the observed Raman frequencies is very good, with discrepancies which are only seldom larger than 10 %. In order to evaluate the agreement with the infrared observations for the and modes, one should consider that in the back-scattering configuration the Raman modes are longitudinal, while those observed in the infrared experiment are transverse. Moreover, the uncertainty on the infrared frequencies may be larger than for the Raman ones when several lines are close to each other. Indeed, in this case, the Kramers-Kronig procedure becomes less effective in separating the real and imaginary part of the dielectric function, which are mixed with each other in the reflectivity spectra.
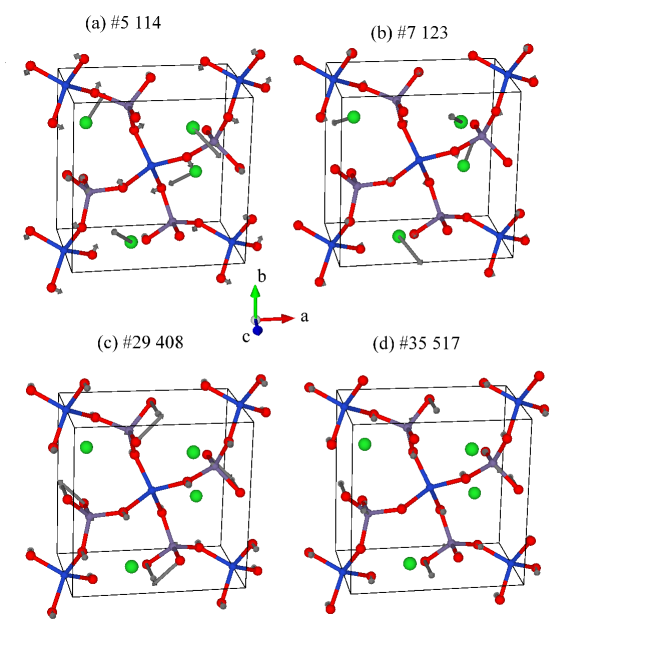
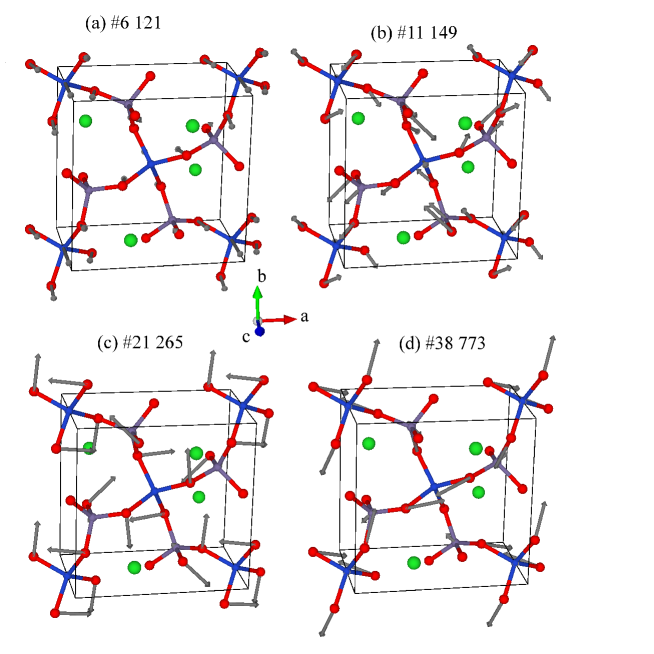
Concerning the Raman intensities, it is worth noting that some of the strongest Raman modes are also intense IR modes, being the structure highly non-centrosymmetric. Moreover, most of those lines are found at the vibrational frequencies expected for the CuO or the GeO bonds (around or above 500 cm-1): see, e-.g., mode 38 in Table I and Fig. 5-d. Indeed, the cross-section for inelastic light scattering with creation of a phonon is proportional to the Raman tensor, which is given by Cardona
| (2) |
Therein, is the dielectric tensor, parametrizes the phonon displacement, and the derivative should be evaluated at the energy of the incoming laser ( = 1.96 eV). This should to be not too far from the charge-transfer (CT) band of the ligand O with the Cu ions (which in cuprates spans from 1.5 to 2.5 eV Basov ), and with the Ge ions. Even if were not resonant with the CT transitions but just close to them, the CT process would dominate the Raman matrix elements, as both the real and the imaginary part of the dielectric function do contribute. Thus we expect strong Raman lines for the phonons which modulate the CuO or the GeO bonds, as shown in Figs. 2 and 3, or inTable I.
The atomic displacements corresponding to the most representative and modes are shown in Figs. 4 and 5, respectively. They are labeled by their number in Table I and by the theoretical frequency in cm-1. Those corresponding to all the and infrared-active phonons were already reported in Ref. Nucara14, . As already noticed for the latter ones, in several vibrations the CuO tetrahedra and the GeO tetrahedra have a similar pattern, due to the similarity of the Ge and the Cu mass. This casual effect makes the tetrahedral ”molecules” to vibrate at similar frequencies and to mix appreciably their modes in the crystal.
III Conclusion
In conclusion, we have presented here the Raman spectrum of Ba2CuGe2O7, an oxide which has recently attracted a wide interest for the helical magnetism it displays at low temperature and for its peculiar multiferroic properties. We have observed here 29 Raman lines which, once combined with our previous infrared observations, provide the frequencies, widths, and relative intensities at different temperature, of 40 phonon modes out of the 45 predicted by group theory for this crystal. These results, together with the shell-model calculations here extended to the Raman and silent vibrations, provide an exhaustive description of the lattice dynamics in Ba2CuGe2O7. We hope that it may help to better understand this oxide, which in addition to its intriguing magnetic properties displays interesting charge-lattice effects at low temperature in the infrared spectra.
Acknowledgements.
This experiment has been supported by the Università di Roma La Sapienza through the Progetti di Università 2013 and 2014. SK acknowledges support from the Consejo Nacional de Investigaciones Científicas y Técnicas de la República Argentina.References
- (1) A. Zheludev, G. Shirane, Y. Sasago, N. Kiode, and K. Uchinokura Phys. Rev. B 54, 15163 (1996);
- (2) A. Zheludev, S. Maslov, G. Shirane, Y. Sasago, N. Kiode, and K. Uchinokura Phys. Rev. B 57, 2968 (1998); A. Zheludev, S. Maslov, G. Shirane, I. Tsukada, T. Masuda, K. Uchinokura, I. Zaliznyak, R. Erwin, and L. P. Regnault, Phys. Rev. B 59, 11432 (1999).
- (3) J. Chovan, M. Marder, and N. Papanicolaou, Phys. Rev. B 88, 064421 (2013).
- (4) I. E. Dzyaloshinskii, J. Phys. Chem. Solids 4, 241(1958).
- (5) T. Moriya, Phys. Rev. 120, 91 (1960).
- (6) A. Zheludev, T. Sato, T. Masuda, K. Uchinokura, G. Shirane, and B. Roessli, Phys. Rev. B 68, 024428 (2003).
- (7) H. Murakawa, Y. Onose, and Y. Tokura, Phys. Rev. Lett. 103, 147201 (2009).
- (8) M. Tovar, R.E. Dinnebier, W. Eysel, Mater. Sci. Forum 278-281, 750 (1998).
- (9) K. Momma and F. Izumi, J. Appl. Crystallogr. 44, 1272-1276 (2011).
- (10) A. Nucara, W. S. Mohamed, L. Baldassarre, S. Koval, J. Lorenzana, R. Fittipaldi, G. Balakrishnan, A. Vecchione, and P. Calvani, Phys. Rev. B 90, 014304 (2014).
- (11) P. Calvani, M. Capizzi, S. Lupi, and G. Balestrino, EPL 31, 473 (1995).
- (12) R. Fittipaldi, L. Rocco, M. Ciomaga Hatnean, V. Granata, M.R. Lees, G. Balakrishnan, and A. Vecchione, J. Cryst. Growth 404, 223 (2014).
- (13) A. L. Glebov, O. Mokhun, A. Rapaport, S. Vergnole, V. Smirnov, L. B. Glebov, Proc. SPIE 8428, Micro-Optics 2012, 84280C, doi:10.1117/12.923575.
- (14) Bilbao Crystallographic Server, http://cryst.ehu.es/rep/sam.html; E. Kroumova, M. I. Aroyo, J. M. Perez-Mato, A. Kirov, C. Capillas, S. Ivantchev, and H. Wondratschek, Phase Transitions 76, 155 (2003).
- (15) S. Koval, R. Migoni and H. Bonadeo, J. Phys.: Condens. Matter 4, 4759 (1992).
- (16) J. Lasave, J. Kohanoff, R.L. Migoni, and S. Koval, Physica B 404, 2736 (2009).
- (17) M. Cardona and G. Güntherodt, eds., Light Scattering in Solids II, Topics in Applied Physics, 50 Springer Verlag, 1982.
- (18) D. N. Basov and T. Timusk, Rev. Mod. Phys. 77, 721 (2005).