Spin wave excitations in the tetragonal double perovskite Sr2CuWO6
Abstract
Sr2CuWO6 is a double perovskite proposed to be at the border between two and three dimensional magnetism, with a square lattice of Cu2+ ions. We have used inelastic neutron scattering to investigate the spin wave excitations of the system, to find out how they evolve as a function of temperature, as well as to obtain information about the magnetic exchange interactions. We observed well defined dispersive spin wave modes at K, which partially survive above the magnetic ordering temperature, K. Linear spin wave theory is used to determine the exchange interactions revealing them to be highly two-dimensional in nature. Density functional theory calculations are presented supporting this experimental finding, which is in contrast to a previous ab-initio study of the magnetic interactions. Our analysis confirms that not the nearest neighbour, but the next nearest neighbour interactions in the tetragonal plane are the strongest. Low incident energy measurements reveal the opening of a meV gap below , which suggests the presence of a very weak single ion anisotropy term in the form of an easy axis along .
pacs:
78.70.Nx, 75.30.Ds, 75.50.EeI INTRODUCTION
Low dimensional magnetism is currently of great interest to condensed matter physics, partly due to the link to the two dimensional antiferromagnetic parent phases of the high- superconductorsDai (2015); Keimer et al. (2015). In those compounds it is considered that the square lattice of Cu2+ ions is responsible for their magnetic and superconducting behaviour. They possess strong in-plane nearest neighbour (NN) superexchange ( meV) and weaker next nearest (NNN) exchange ( meV)Hayden et al. (1991); Coldea et al. (2001); Headings et al. (2010). Similar copper square lattice compounds with weaker interactions are of interest as a point of comparison for the fundamental understanding of the magnetism of square lattices of Cu2+ ions.
The -site ordered double perovskite oxides Sr2CuO6, where is a diamagnetic hexavalent ion such as Mo, Te or W, are examples of such materialsVasala and Karppinen (2015). Although they are structurally three dimensional, many display low dimensional properties. The planes have a square centred array of Cu2+, with the half-filled Cu orbitals ordered into the planes by the Jahn-Teller distortion, creating magnetic interactions between the neighbouring Cu ions within the planes. As the , and orbitals are all filled, the magnetic interactions along the axis are expected to be weak, resulting in the magnetic interactions being quasi two-dimensionalVasala et al. (2012). Compared to the interactions in the cuprates, in the double perovskites the magnetic ions are separated by an array of diamagnetic O--O ions, making them an order of magnitude weaker, and therefore it is possible to study the low temperature low dimensional magnetic properties.
Sr2CuWO6 shows a broad maximum in the magnetic susceptibility at K, behaviour characteristic of two-dimensional Quantum Square Lattice Heisenberg Antiferromagnets (QSLHAF), with no clear indication of a transition to a long-range-ordered magnetic stateVasala et al. (2014a). There is a kink in the second derivative at K, but the data are inconclusive of any transition. Instead the transition to a long-ranged ordered state was confirmed definitively via SR, with the observation of a spontaneous oscillation below K, and only a slowly decaying component above, with no sign of quasistatic short-range orderVasala et al. (2014a). Regrettably there was insufficient data for the temperature dependence of the local magnetic field to determine unambiguously whether the ordering is or lower dimensional.
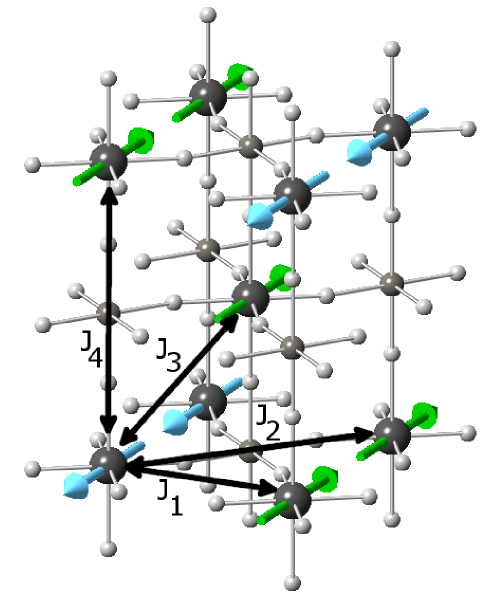
High flux neutron powder diffraction data have revealed that the Cu2+ ions display antiferromagnetic Type-II ordering with magnetic moments aligned along the -axisVasala et al. (2014b), see Figure 1. The moment is smaller than might be expected for Cu2+ ions (), possibly due to a degree of frustration or being on the borderline between quasi-low dimensional and three dimensional magnetism. It may also be the signature of quantum zero-point fluctuations, which can reduce the moment in QSLHAF systemsReger and Young (1988).
Electronic structure calculations, using a Coulomb value determined in relation to oxygen -edge X-ray absorption spectroscopy measurements, gave the exchange constants: , , and meV, resulting in a reasonable agreement with the measured Curie-Weiss temperature ( K, K)Vasala et al. (2014a). These values are consistent with the observed Type II antiferromagnetic structureVasala et al. (2014b), but the interplanar coupling indicates significantly stronger three dimensional magnetism than might have been expected from the electronic structure and based on the form of the magnetic susceptibility. To investigate this apparent discrepancy we have performed inelastic neutron scattering (INS) measurements and a comprehensive Density Functional Theory (DFT) study to re-examine the exchange constants in Sr2CuWO6.
In this paper we present our inelastic neutron scattering measurements performed on Sr2CuWO6. The INS results are analysed and compared with linear spin wave theory simulations based on the original DFT estimatesVasala et al. (2014a) for the exchange interactions. This demonstrates a significant disagreement with the earlier DFT calculations. We have reassessed the DFT calculations and present revised results, which support the conclusions drawn from our INS data indicating a strong two dimensional character, and revealing the significance of the straight Cu-O-W-O-Cu linkers.
II EXPERIMENTAL DETAILS
A g powder sample of Sr2CuWO6was synthesized by solid-state reaction of a stoichiometric mixture of SrCO3, CuO and WO3 powders, according to the method detailed in Ref. Vasala et al., 2014a. The phase purity and quality of the sample were verified using x-ray diffraction (X’Pert Pro MPD, Cu radiation). Rietveld refinement using the FULLPROF programRodriguez-Carvajal (1993) confirmed that the sample is single phase with the structure and lattice parameters Å and Å as reported earlierVasala et al. (2014a).
Neutron inelastic scattering measurements were performed on the MERLIN time-of-flight direct geometry spectrometerBewley et al. (2009) at the ISIS facility of the Rutherford Appleton Laboratory. The sample was contained in an aluminium foil packet in the form of an annulus of diameter mm and height mm and sealed in a thin aluminium can containing helium exchange gas. The sample can was cooled by a closed-cycle refrigerator. The straight Gd slit package was used in the Fermi chopper, which was phased to allow the recording of spectra with incident energies of either and meV (at a rotation speed of Hz), or and meV (at a rotations speed of Hz) simultaneously via the rep-rate multiplication methodRussina and Mezei (2009, 2010); Nakamura et al. (2009). The data were collected at a series of temperatures between and K for h each. The data were reduced using the MantidPlot software packageArnold et al. (2014). The raw data were corrected for detector efficiency and time independent background following standard proceduresWindsor (1981). Vanadium spectra were recordednot with the same incident energies to determine the energy resolution and to convert the intensities into units of cross section, mb.sr-1.meV-1.f.u.-1, where f.u. stands for the formula unit of Sr2CuWO6. Additional measurements with meV at a chopper frequency of Hz were performed on the same sample on the LET time-of-flight direct geometry spectrometerBewley et al. (2011) also using the rep-rate multiplication method.
III COMPUTATIONAL DETAILS
The exchange constants can be obtained using DFT by calculating the energy differences between multiple collinear spin states and projecting those onto the following Hamiltonian:
| (1) |
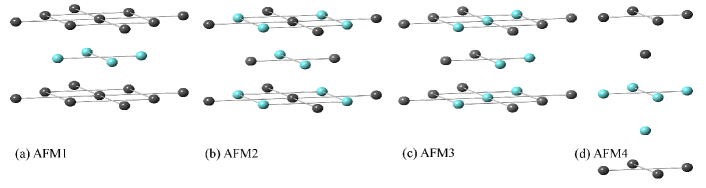
This is known as the mapping method.Koo and Whangbo (2008a, b) One ferromagnetic and four antiferromagnetic collinear spin states are sufficient in Sr2CuWO6, see ref.Vasala et al., 2014a for more details. These configurations are presented in Figure 2 and consist of (AFM1-3) or (AFM4) supercells. The exchange constants can be solved from the following equations:
| (2) |
| (3) |
| (4) |
| (5) |
Total energies of the spin configurations were determined by means of density functional theory calculations using the full-potential linearised augmented plane-wave plus local orbitals (FP-LAPW+lo) ELK codeELK . The calculations were performed using the experimental crystal structure of Sr2CuWO6 determined by neutron diffractionVasala et al. (2014a). The generalised gradient approximation (GGA) exchange and correlation functionals by Perdew, Burke and Ernzerhof were usedPerdew et al. (1996). A point mesh of either or was used depending on the supercell. The plane-wave cutoff was set at a.u.-1, where is the radius of the smallest muffin-tin (oxygen, a.u.).
Sr2CuWO6 is a strongly correlated material, and thus electron correlation effects are central for modelling the electronic structure. The correlation effects of localised Cu2+ electrons were included within the semi-empirical DFT+ framework with Hubbard and Stoner as parametersAnisimov et al. (1991). DFT+ methods such as GGA+ require the use of a double counting correction, since Coulomb and intra-atomic exchange interactions are also included in the GGA functionals. We have used both Around Mean Field (AMF)Czyżyk and Sawatzky (1994) and Fully Localised Limit (FLL)Liechtenstein et al. (1995) double counting corrections in this work. Exchange constants calculated by DFT are known to be sensitive to the on-site Coulomb term and the double counting correction usedLebernegg et al. (2014). For this reason, we have calculated the exchange constants using a range of values typical for Cu with two different double counting corrections. With the FLL correction a Hubbard of eV has been widely used for Cu in oxides,Anisimov et al. (1991); Liechtenstein et al. (1995); Lebernegg et al. (2014); Chou et al. (2016) whereas a slightly lower of eV is typical when using the AMF correctionCzyżyk and Sawatzky (1994); Lebernegg et al. (2014). The intra-atomic exchange parameter was chosen to be eV, which is a common value in transition metal oxidesAnisimov et al. (1991).
In order to evaluate the overall strength of the exchange interactions with different Hubbard values, we have calculated the Weiss temperature using the mean field approximation:
| (6) |
where is the Boltzmann constant and is the number of sites connected by exchange interaction .
IV Experimental Results
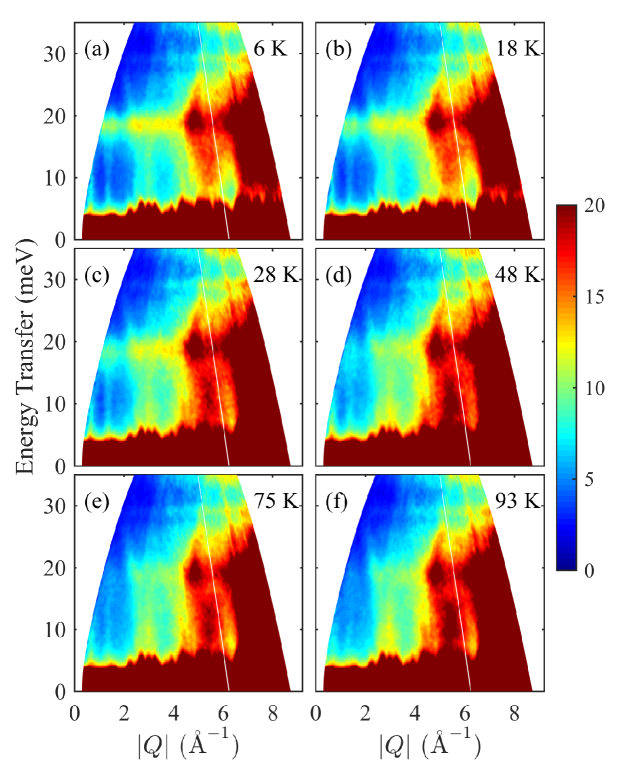
For temperatures below , additional peaks are observed at the elastic line at Å and Å, corresponding to the ( ) and ( ) magnetic Bragg peaks, confirming the previous assignment of Type II antiferromagnetic ordering described by a [ ] magnetic ordering wavevectorVasala et al. (2014b). The colour-coded inelastic neutron scattering intensity maps of Sr2CuWO6 measured on MERLIN at various temperatures between and K are shown in Figure 3(a-f). At low temperatures, for momentum transfer Å-1, a strong flat scattering band can be observed at meV (Fig. 3). In addition steep spin waves are seen apparently emanating from the elastic line. Based on the measurements performed with an incident energy of meV on MERLIN, these excitations would appear to be gapless to within the resolution of the instrument (FWHM meV). At larger values the excitations are dominated by phonons.
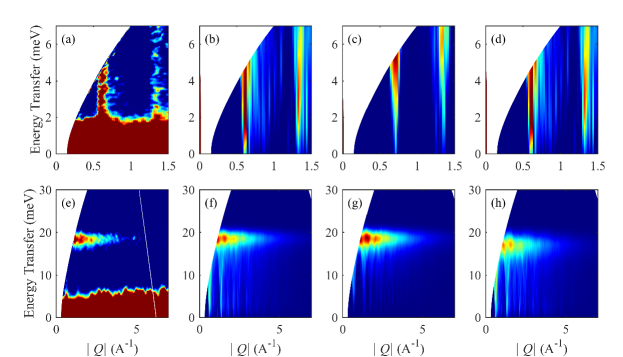
Looking at the temperature evolution, the flat band at meV appears to be more strongly effected by increasing temperature, disappearing between K and K, while evidence of the spin waves persists up to at least K, i.e. well above K, which indicates the presence of two dimensional interactions. These features are both absent at K, above the broad maximum seen in the magnetic susceptibility at KVasala et al. (2014a). The assignment of the higher features as phonons is further confirmed by their increasing intensity with increasing temperature. By considering the Bose factor, and using the K data we can subtract the phonons from the low temperature data to give the purely magnetic signalCarlo et al. (2011), as shown in Fig. 4(a) and (e).
In order to model the observed magnetic spectrum, we have calculated the spin wave dispersions, the spin-spin correlation function and the neutron scattering cross section using the SpinW programToth and Lake (2015). Since tungsten is hexavalent in Sr2CuWO6, it is diamagnetic, and therefore only interactions between the Cu2+ ions need to be considered. We have constructed the magnetic Hamiltonian in Eq. (1) with four different exchange couplings for the nearest and next nearest neighbour interactions in plane, and interplanar along the c-axis, as shown in Fig. 1. As we could not confirm the existence of a small spin gap to within the instrumental resolution of MERLIN, we initially neglect a single ion anisotropy term, which would generally open such a gap. For the spin wave calculation we started from the original DFT-calculated values of the exchange parameters given in Section I. Further the instrument resolution was estimated from vanadium runs and this was included in the simulation.
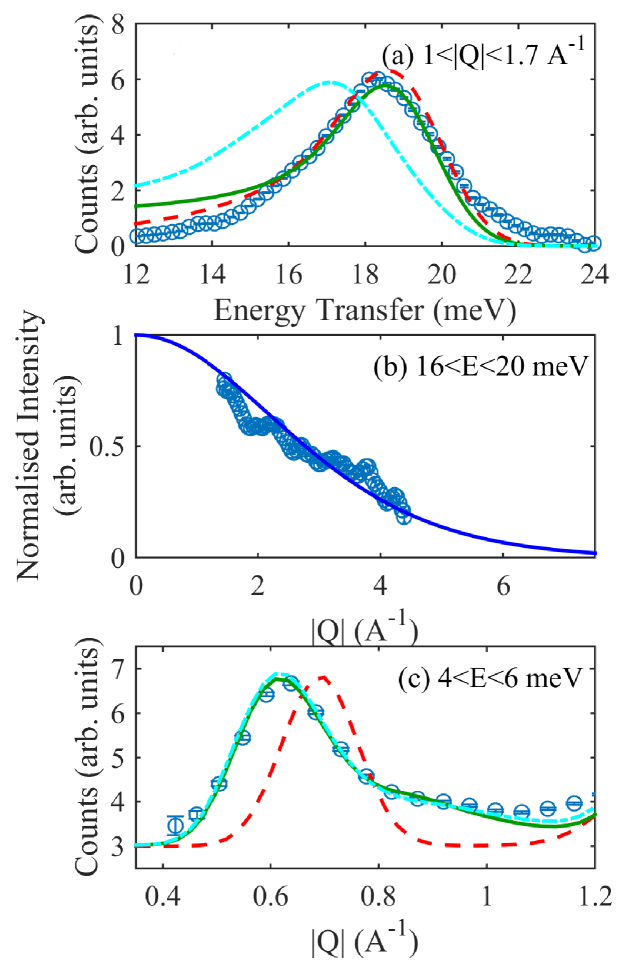
Comparing the simulation for the original DFT-determined exchange parametersVasala et al. (2014a) (Figs. 4(c) & (g)) with the measured spin wave dispersion (Figs. 4(a) & (e)) we see that the simulation accurately reproduces the band maximum at meV, with steep spin waves emerging from the elastic line. However, closer inspection of the data reveals that the spin waves do not actually emerge from the magnetic Bragg peaks. Instead the centre of the lower excitation is at Å-1, lying between Å-1, corresponding to the forbidden position, and Å-1, corresponding to the allowed position. In order to better reproduce the data, we have found a new set of exchange parameters: meV, meV, meV and meV, which are noticeably more two dimensional than those obtained originally using DFTVasala et al. (2014a), see the simulation panels Fig. 4(b) and (f). The difference in the two simulations can be seen more strikingly in Figure 5. While both manage to reproduce the band maximum at meV (Fig. 5(a)), which is shown to follow the magnetic form factor for Cu2+ in Fig. 5(b); the cut through the excitations integrated for meV (Fig. 5(c)), shows how the original DFT-determined exchange parameters simulation inaccurately estimates the position of the first excitation as emerging from the ( ) magnetic Bragg peak, while the simulation for the new exchange parameters reproduces the data well. When the simulation for the new experimental exchange parameters is performed to obtain the single crystal dispersion, it becomes clear that the excitations are emerging from both the and positions, and it is the powder averaging that gives rise to the observed Å-1 position. In order to understand the appearance of the softening at the forbidden position, it is necessary to look at the value of . If were ferromagnetic, then Type I antiferromagnetic order would be stabilised. Our value for of only eV puts Sr2CuWO6 close to the border between Type I and Type II ordering, such that softening is observed at both positions, but the negative sign results in Type II order.
In optimising our exchange parameters to fit the data, it is made clear that the value of is central to the position of the band maximum. Simulations for the spin wave dispersion indicate that the value of modulates the spin wave maxima over different positions in the Brillouin Zone, that on powder averaging leads to a broadening of the meV band maximum. We have estimated based on the width of the peak in Fig. 5(a), taking the instrumental resolution at an energy transfer of meV into account.
| AMF | FLL | INS | ||||||
|---|---|---|---|---|---|---|---|---|
| (eV) | 5 | 6 | 7 | 8 | 7 | 8 | 9 | - |
| (meV) | -3.70 | -3.18 | -2.70 | -2.56 | -3.29 | -2.45 | -2.58 | -1.2 |
| (meV) | -13.83 | -10.87 | -7.96 | -6.23 | -10.42 | -8.83 | -6.75 | -9.5 |
| (meV) | 0.01 | 0.06 | -0.06 | -0.04 | -0.02 | 0.03 | -0.04 | 0 |
| (meV) | 0.12 | 0.03 | 0.19 | 0.07 | 0.09 | 0.04 | -0.12 | -0.01 |
| 3.73 | 3.42 | 2.95 | 3.61 | 3.16 | 3.61 | 2.61 | 7.92 | |
| (K) | -202.5 | -161.4 | -102.4 | -102.4 | -159.1 | -129.9 | -110.0 | -124.1 |
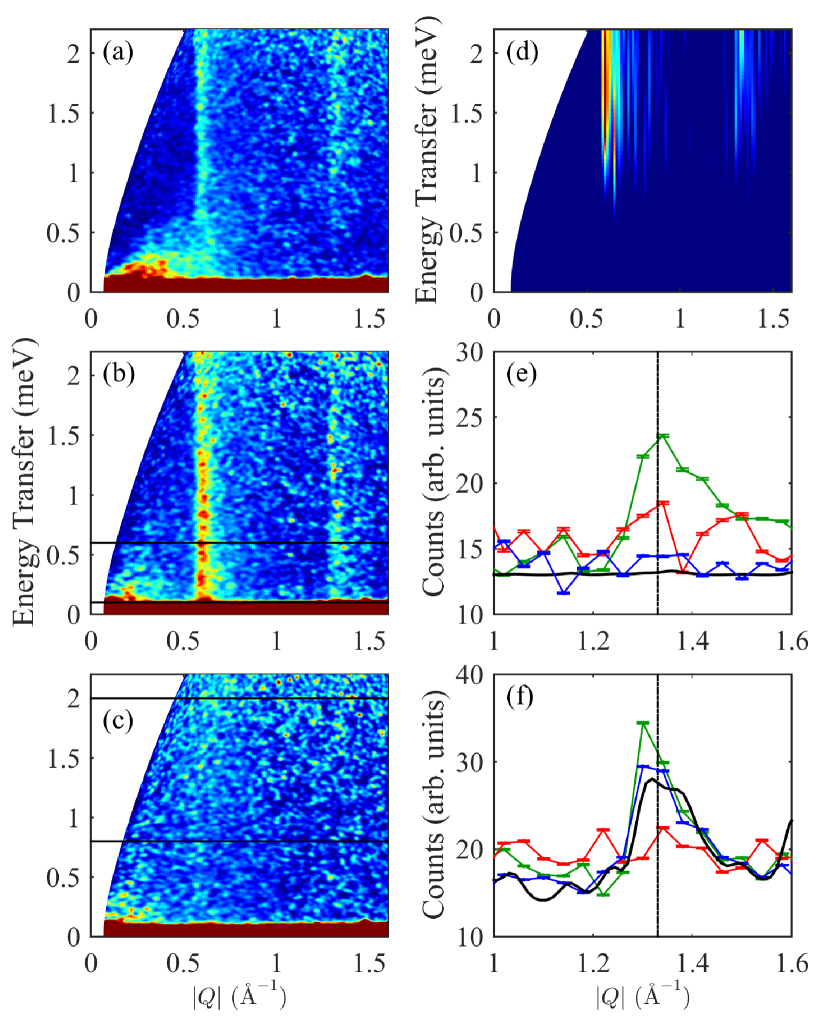
While the energy resolution on MERLIN did not allow us to observe a spin gap, by using the cold chopper spectrometer LET we are able to distinguish the presence of a small gap of order meV below . Figure 6 shows the temperature evolution of this gap. Below (Fig. 6(a)) the gap is present, although somewhat obscured for the lower excitation by the presence of a spurious signal close to the beam stop. When the temperature is raised above the gap closes, with strong spectral weight shifted down to the elastic line (Fig. 6(b)). Finally, above , the excitations are entirely absent. We have been able to reproduce the presence of the gap in the ordered structure in our SpinW simulations (Fig. 6(d)) by modifying Eq. (1) to include single ion anisotropy in the form of an easy axis along of magnitude meV. Although it is commonly believed that magnetic systems of spin- transition-metal ions have no magnetic anisotropy arising from spin-orbit couplingMoriya and Yosida (1953), this is only the case for ions in a perfect octahedral crystal field ( ground state). Any distortion which splits the triply degenerate ground state and mixes the orbital d-states can, via the spin-orbit coupling, give non-zero single ion anisotropyLiu et al. (2014). In Fig. 6(e) a cut along integrating between and meV shows how peaks are only observed in the data for , while in Fig. 6(f) a cut integrating energies between and meV shows peaks for both and , where the lowest temperature data is well matched by the simulation.
V Computational Results
The exchange constants calculated by DFT are presented in Table 1. In all cases the main interactions are the in-plane and interactions, which are antiferromagnetic. These results show that the next-nearest neighbor interaction in Sr2CuWO6 is stronger than the nearest neighbor interaction, which is consistent with the experimental Type II magnetic structureVasala et al. (2014b). The strength of the exchange interactions decreases with increasing Hubbard , which is clearly seen from the change in Weiss temperatures. This decrease is typical when the mapping method is used with DFT+Koo and Whangbo (2008a, b).
The exchange constants obtained by AMF and FLL double counting corrections are similar, with FLL producing stronger interactions for the same Hubbard . The computational results are in fairly good, but not perfect, agreement with the experimental INS results. The DFT calculations presented here consistently over-estimate the nearest-neighbour interaction, which results in a rather lower ratio () than experimentally observed (). , in contrast, is in good agreement with the experimental results. The inter-planar interactions and are very weak compared to and in all solutions, which is consistent with the experimental exchange constants obtained by INS. This shows that the magnetic interactions in Sr2CuWO6 are highly two-dimensional. However, the correct negative sign (i.e. antiferromagnetic interaction) for is only obtained with FLL correction and eV. This solution also results in a Weiss temperature of K, which is the closest to the experimental value of KVasala et al. (2014a), but the low value of leads to a sizeable underestimate of the band maximum. If and are constrained to be small and negative, then the best match to the experimental data is obtained for the FLL double counting correction with eV, see Fig. 4(d) and (h), although they do not exactly reproduce the inelastic neutron scattering data, underestimating the band maximum position and overestimating the width (Fig. 5(a)).
The previous DFT study of Sr2CuWO6Vasala et al. (2014a) found a far stronger interaction of meV, indicating significantly more three-dimensional magnetism than reported here. The difference between the results presented in Table 1 and those published previouslyVasala et al. (2014a) is perhaps due to the new calculations being performed over a range of values with a more accurate crystal structure, higher plane-wave cut-off and a newer branch of the ELK code, although the exact origin of this discrepancy is not known.
VI Discussion
Now we compare the exchange parameters estimated for Sr2CuWO6 with those of Sr2CuTeO6Koga et al. (2014); Babkevich et al. . Based on magnetic susceptibility measurements, it is estimated that in isostructural Sr2CuTeO6 the ratio Koga et al. (2014), compared to in Sr2CuWO6 from the INS results, while recent inelastic neutron scattering measurements have reduced the Sr2CuTeO6 value even further to Babkevich et al. . Koga et al. propose that this reversal in relative strengths of nearest and next nearest neighbour interactions is due to the outermost filled orbital in Te6+ being , such that the two hole spins must be antiparallel, giving antiferromagnetic exchange and ; whereas in W6+ the and orbitals are orthogonal so that the two hole spins are parallel, which would give a ferromagnetic exchange for and an antiferromagnetic exchange for . However, our DFT calculations and spin wave analysis indicates a weak but antiferromagnetic in Sr2CuWO6, which might be due to the presence of frustration. Babkevich et al. have combined their INS measurements on Sr2CuTeO6 with ab-initio calculations, which have revealed that, in fact, the dominant exchange path is via Cu-O-O-Cu, and not via the Te orbitals.
It is interesting to also compare the inelastic neutron scattering results from double perovskite Sr2CuWO6 with those reported for and double perovskites with monoclinic, tetragonal or cubic crystal structures. It is to be noted that in the cubic (or less distorted monoclinic) structure of double perovskites with a single magnetic ion, the magnetic lattice is face centred cubic, which is a geometrically frustrated lattice and provides a unique opportunity to investigate frustrated magnetism. The inelastic neutron scattering study of face centred cubic Ba2YMoO6 (Mo5+ ) demonstrates the existence and temperature dependence of a gapped magnetic excitation at meV, with a bandwidth of meVCarlo et al. (2011). The observed dispersive triplet excitations come from a singlet ground state formed from orthogonal dimers on the Mo5+ tetrahedra. On the other hand, an inelastic neutron scattering study on monoclinic La2NaRuO6 also reveals a spin gap of meV. As the magnetic anisotropy is expected to be small for octahedrally-coordinated Ru5+ systems, the large gap observed for La2NaRuO6 may originate from the significantly enhanced value of the spin-orbit coupling in this materialAczel et al. (2014). FCC Ba2YRuO6 also displays a meV spin gap, with a zone boundary energy of meV, at the magnetic ordering wavevector below KCarlo et al. (2013). INS has also revealed well defined dispersive spin wave excitations in a polycrystalline sample of monoclinic Sr2YRuO6, with a zone boundary energy of meV at K and a gap of meV below K, but gapless above, despite being well below K Adroja et al. . The presence of strong diffusive scattering between and K is indicative of strong magnetic frustration between Ru-Ru atoms. The estimated exchange interactions give a ratio between nearest and next nearest neighbours , revealing much stronger nearest neighbour interactions in contrast to Sr2CuWO6().
Further instructive comparison might be made with other Cu2+ quantum square lattice Heisenberg antiferromagnets (QSLHAF), which have been of considerable interest both theoretically and experimentally ever since the realisation that the parent compounds of the cuprate superconductors could be described using the same model. The low energy dynamics of QSLHAF are well described using linear spin wave theory with quantum corrections. However, inelastic neutron scattering measurements on a range of Cu2+ QSLHAF have revealed a glaring anomaly at high energy in the vicinity of , where the intensity of the otherwise sharp excitations is completely wiped outPlumb et al. (2014); Headings et al. (2010); Tsyrulin et al. (2010); Christensen et al. (2007); Piazza et al. (2015). Identifying the origin of this effect is complicated by the presence of additional exchange terms such as electronic ring exchangePlumb et al. (2014); Headings et al. (2010) and further neighbour exchangeTsyrulin et al. (2010), as is also present in Sr2CuWO6. Due to similarities in the measured anomaly with predictions for fermionic Resonating Valence Bond excitationsHo et al. (2001), it has been speculated that the anomaly may be related to fractionalised spin excitationsHeadings et al. (2010); Christensen et al. (2007). By analogy with 1-D systems, these are referred to as spinons. In 1-D spinons have been identified in a number of materials, but observing 2-D analogues has proved more challenging until recentlyPiazza et al. (2015). It would therefore clearly be very interesting to measure the excitations in single crystal Sr2CuWO6.
VII CONCLUSIONS
We have performed inelastic neutron scattering measurements on double perovskite Sr2CuWO6, which reveal clear evidence of spin wave excitations at low temperatures. The magnetic excitations partially survive at temperatures above K for long range 3D order, indicating a 2D component to the nature of the magnetic interaction. Our spin wave analysis using linear spin wave theory indicates that the NNN interaction in the plane is a factor of approximately eight times stronger compared to the NN interaction in the plane. While a previous DFT study gave a ratio of for the strong interactions in plane () and interplane (), our inelastic neutron scattering results indicate that is significantly stronger than , which is consistent with the expected two dimensional behaviour given the Jahn-Teller distortion. The more comprehensive DFT study presented here has obtained results supporting this two dimensional nature and the dominance of the NNN interaction. The strongest interaction in the plane is most probably arising due to superexchange between the Cu2+ orbitals via the Oxygen orbitals along straight linkers. Furthermore, the observation of a very small spin gap in Sr2CuWO6 is in line with a general explanation, which attributes the opening of increasingly large spin gaps in and systems as being due to the stronger spin orbit coupling compared to that in systems.
Upon submission we were made aware of another paper reporting inelastic neutron scattering measurements on Sr2CuWO6Burrows et al. .
Acknowledgements.
The authors acknowledge CSC-IT Centre for Science, Finland, for providing computational resources. DTA would like to thank JSPS for funding his visit to Hiroshima University.References
- Dai (2015) P. Dai, Rev Mod Phys 87, 855 (2015).
- Keimer et al. (2015) B. Keimer, S. A. Kivelson, M. R. Norman, S. Uchida, and J. Zaanen, Nature 518, 179 (2015).
- Hayden et al. (1991) S. M. Hayden, G. Aeppli, R. Osborn, A. D. Taylor, T. G. Perring, S.-W. Cheong, and Z. Fisk, Phys. Rev. Lett. 67, 3622 (1991).
- Coldea et al. (2001) R. Coldea, S. M. Hayden, G. Aeppli, T. G. Perring, C. D. Frost, T. E. Mason, S.-W. Cheong, and Z. Fisk, Phys. Rev. Lett. 86, 5377 (2001).
- Headings et al. (2010) N. S. Headings, S. M. Hayden, R. Coldea, and T. G. Perring, Phys. Rev. Lett. 105, 247001 (2010).
- Vasala and Karppinen (2015) S. Vasala and M. Karppinen, Progress in Solid State Chemistry 43, 1 (2015).
- Vasala et al. (2012) S. Vasala, J.-G. Cheng, H. Yamauchi, J. B. Goodenough, and M. Karppinen, Chemistry of Materials 24, 2764 (2012).
- Vasala et al. (2014a) S. Vasala, H. Saadaoui, E. Morenzoni, O. Chmaissem, T.-S. Chan, J.-M. Chen, Y.-Y. Hsu, H. Yamauchi, and M. Karppinen, Phys. Rev. B 89, 134419 (2014a).
- Vasala et al. (2014b) S. Vasala, M. Avdeev, S. Danilkin, O. Chmaissem, and M. Karppinen, J. Phys.: Condens. Matter 26, 496001 (2014b).
- Reger and Young (1988) J. D. Reger and A. P. Young, Phys. Rev. B 37, 5978 (1988).
- Rodriguez-Carvajal (1993) J. Rodriguez-Carvajal, Physica B 192, 55 (1993).
- Bewley et al. (2009) R. I. Bewley, T. Guidi, and S. Bennington, Notiziario Neutroni e Luce di Sincrotrone 14, 22 (2009).
- Russina and Mezei (2009) M. Russina and F. Mezei, Nucl. Instrum. Methods in Phys. Rese. Sect. A 604, 624 (2009).
- Russina and Mezei (2010) M. Russina and F. Mezei, Journal of Physics: Conference Series 251, 012079 (2010).
- Nakamura et al. (2009) M. Nakamura, R. Kajimoto, Y. Inamura, F. Mizuno, M. Fujita, T. Yokoo, and M. Arai, J. Phys. Soc. Japan 78, 093002 (2009).
- Arnold et al. (2014) O. Arnold et al., Nucl. Instrum. Methods Phys. Res. Sect. A 764, 156 (2014).
- Windsor (1981) C. G. Windsor, Pulsed Neutron Scattering (Taylor & Francis Ltd, London, 1981) The time independent background was subtracted using MantidPlot, using data between s and s on MERLIN and s and s on LET.
- (18) These were performed on a g cylindrical vanadium ( % purity) reference sample.
- Bewley et al. (2011) R. I. Bewley, J. W. Taylor, and S. M. Bennington, Nucl. Instrum. Methods Phys. Res. Sect. A 637, 128 (2011).
- Koo and Whangbo (2008a) H.-J. Koo and M.-H. Whangbo, Inorganic Chemistry 47, 128 (2008a).
- Koo and Whangbo (2008b) H.-J. Koo and M.-H. Whangbo, Inorganic Chemistry 47, 4779 (2008b).
- (22) Http://elk.sourceforge.net.
- Perdew et al. (1996) J. P. Perdew, K. Burke, and M. Ernzerhof, Phys. Rev. Lett. 77, 3865 (1996).
- Anisimov et al. (1991) V. I. Anisimov, J. Zaanen, and O. K. Andersen, Phys. Rev. B 44, 943 (1991).
- Czyżyk and Sawatzky (1994) M. T. Czyżyk and G. A. Sawatzky, Phys. Rev. B 49, 14211 (1994).
- Liechtenstein et al. (1995) A. I. Liechtenstein, V. I. Anisimov, and J. Zaanen, Phys. Rev. B 52, R5467 (1995).
- Lebernegg et al. (2014) S. Lebernegg, A. A. Tsirlin, O. Janson, and H. Rosner, Phys. Rev. B 89, 165127 (2014).
- Chou et al. (2016) T. L. Chou, O. Mustonen, T. S. Tripathi, and M. Karppinen, J. Phys.: Condens. Matter 28, 035802 (2016).
- Carlo et al. (2011) J. P. Carlo, J. P. Clancy, T. Aharen, Z. Yamani, J. P. C. Ruff, J. J. Wagman, G. J. Van Gastel, H. M. L. Noad, G. E. Granroth, J. E. Greedan, H. A. Dabkowska, and B. D. Gaulin, Phys. Rev. B 84, 100404(R) (2011).
- Toth and Lake (2015) S. Toth and B. Lake, J. Phys.: Condens. Matter 27, 166002 (2015).
- Moriya and Yosida (1953) T. Moriya and K. Yosida, Prog. Theor. Phys. 9, 663 (1953).
- Liu et al. (2014) J. Liu, H.-J. Koo, H. Xiang, R. K. Kremer, and M.-H. Whangbo, J. Chem. Phys. 141, 124113 (2014).
- Koga et al. (2014) T. Koga, N. Kurita, and H. Tanaka, J. Phys. Soc. Jpn 83, 115001 (2014).
- (34) P. Babkevich, V. M. Katukuri, B. Fåk, S. Rols, T. Fennell, D. Pajić, H. Tanaka, T. Pardini, R. R. P. Singh, A. Mitrushchenkov, O. V. Yazyev, and H. M. Rønnow, arXiv:1605.09714 .
- Aczel et al. (2014) A. A. Aczel, P. J. Baker, D. E. Bugaris, J. Yeon, H.-C. zur Loye, T. Guidi, and D. T. Adroja, Phys. Rev. Lett. 112, 117603 (2014).
- Carlo et al. (2013) J. P. Carlo, J. P. Clancy, K. Fritsch, C. A. Marjerrison, G. E. Granroth, J. E. Greedan, H. A. Dabkowska, and B. D. Gaulin, Phys. Rev. B 88, 024418 (2013).
- (37) D. T. Adroja et al., Unpublished.
- Plumb et al. (2014) K. W. Plumb, A. T. Savici, G. E. Granroth, F. C. Chou, and Y.-J. Kim, Phys. Rev. B 89, 180410 (2014).
- Tsyrulin et al. (2010) N. Tsyrulin, F. Xiao, A. Schneidewind, P. Link, H. M. Rønnow, J. Gavilano, C. P. Landee, M. M. Turnbull, and M. Kenzelmann, Phys. Rev. B 81, 134409 (2010).
- Christensen et al. (2007) N. B. Christensen, H. M. Rønnow, D. F. McMorrow, A. Harrison, T. G. Perring, M. Enderle, R. Coldea, L. P. Regnault, and G. Aeppli, Proc. Natl Acad. Sci. 104, 15264 (2007).
- Piazza et al. (2015) B. D. Piazza, M. Mourigal, N. B. Christensen, G. J. Nilsen, P. Tregenna-Piggott, T. G. Perring, M. Enderle, D. F. McMorrow, D. A. Ivanov, and H. M. Rønnow, Nature Phys. 11, 62 (2015).
- Ho et al. (2001) C.-M. Ho, V. N. Muthukumar, M. Ogata, and P. W. Anderson, Phys. Rev. Lett. 86, 1626 (2001).
- (43) O. J. Burrows, G. J. Nilsen, E. Suard, M. Telling, and M. A. de Vries, arXiv:1602.04075 .