Discovery of ultra-steep spectrum giant radio galaxy with recurrent radio jet activity in Abell 449
Abstract
We report a discovery of a 1.3 Mpc diffuse radio source with extremely steep spectrum fading radio structures in the vicinity of the Abell 449 cluster of galaxies. Its extended diffuse lobes are bright only at low radio frequencies and their synchrotron age is about 160 Myr. The parent galaxy of the extended relic structure, which is the dominant galaxy within the cluster, is starting a new jet activity. There are three weak X-rays sources in the vicinity of the cluster as found in the ROSAT survey, however it is not known if they are connected with this cluster of galaxies. Just a few radio galaxy relics are currently known in the literature, as finding them requires sensitive and high angular resolution low-frequency radio observations. Objects of this kind, which also are starting a new jet activity, are important for understanding the life cycle and evolution of active galactic nuclei. A new 613 MHz map as well as the archival radio data pertaining to this object are presented and analyzed.
Subject headings:
galaxies: active — galaxies: jets — galaxies: clusters: individual (Abell 449) — galaxies: clusters: intracluster medium — radio continuum: galaxies — X-rays: galaxies: clusters1. Introduction
Clusters of galaxies are ideal laboratories to probe the evolution and formation of cosmic structures. Apart from luminous matter, they consist of intracluster medium (ICM), which can be studied through X-ray astronomy (e.g., Sarazin 1986). The ICM is mixed with non-thermal components, like relativistic particles or large-scale magnetic fields, which emit synchrotron radiation detected at radio wavelengths. These sources are typically grouped into three kinds of objects: halos, mini-halos, relics (Ferrari et al. 2008; Venturi 2011; Feretti et al. 2012, and references therein). The halos usually extend to over 1 Mpc, have a regular morphology, low surface brightness and are unpolarized. They always show a steep spectrum, i.e. their spectral index (). The mini-halos are structures extending to about 500 kpc, also with a steep spectrum and low surface brightness. The relics are similar to halos in their surface brightness, large size, and spectral index, but they are located in clusters’ peripheral regions and strongly polarized. Most of them are elongated, but roundish relics can also be observed.
In the ICM, there are also jets and lobes of radio galaxies. During their active stage, the powerful extragalactic radio sources are supplied with energy from the active galactic nucleus (AGN) in the form of jets or plasma beams. The structure and spectral index distribution of the lobes of extended radio emission contain important information on the history of the source. For young sources, the radio spectra are usually well approximated as a power law with a spectral index about 0.5. When the jet activity ceases, energy is no longer delivered, and the structures gradually fade away due to adiabatic and radiative losses of relativistic electrons, before completely disappearing. Such relic radio galaxies are essential for understanding the radio source evolution, in particular, the late phase of exhaustion of the central energy source, AGN. Dying diffuse sources, arising from the AGNs after stopping the nuclear activity are sometimes referred as relics or AGN relics, even though they have not originated from the ICM. The spectrum of the aged sources can be described by a power law with a high-energy cut-off. In effect, it becomes steep with an inflection at a break frequency. The break frequency is associated with the synchrotron age of charged particles. The first example of a dying radio source was B2 092430 (Cordey 1987; Jamrozy et al. 2004). Nine dying sources, including three with recurrent activity, were discovered using the Westerbork Northern Sky Survey (WENSS; 326 MHz; Rengelink et al. 1997) and the NRAO VLA Sky Survey (NVSS; Condon et al. 1998) by Parma et al. (2007). Murgia et al. (2011) described other five sources of this class. The radio structures within those objects vary in size from about 7 to 135 kpc, while recently, Brienza et al. (2016) described a new remnant radio galaxy, with a physical extent of 700 kpc.
In this paper, we present new observations carried out with the Giant Metrewave Radio Telescope (GMRT) at 613 MHz as well as archival data on the ultra-steep spectrum giant radio galaxy J03497511 with hints of recurrent jet activity. In the next section, we briefly describe the radio source and its environment. The third section presents the GMRT observations as well as available archival data from other radio sky surveys. The archival infrared and X-ray data are described in the fourth section, while in the fifth section we review and discuss the results. The conclusions are given at the end of the paper. Throughout the letter, a flat vacuum-dominated universe with m=0.27, Λ=0.73 and 0=71 km s-1 Mpc-1 is assumed.
2. Abell 449 and J03497511
The radio source J03497511 (central position R.A.: decl.: , J2000.0) is located in the cluster of galaxies Abell 449 (central position R.A.: decl.: , J2000.0). The cluster’s redshift (determined as an average from four galaxies, but without specifying their identification) is (Postman et al. 1985), which yields a distance of about 360 Mpc. The angular size of Abell 449 is about (Struble & Rood 1982), which corresponds to Mpc. According to Flin & Krywult (2006), the cluster has an unimodal structure with a central dominant region. Its richness and distance classes in the Abell Catalog are 1 and 4, respectively (Postman et al. 1992). The cluster was classified together with Abell 527 as one supercluster. The redshift of the parent galaxy of J03497511 is not known. However, as it is located near the center of Abell 449 and its optical magnitude (R 14.3 mag; taken from the USNO-B catalog, Monet et al. 2003) is only slightly higher than three other neighboring galaxies, we presume that the galaxy actually belongs to the cluster. The angular size of J03497511, as measured along both diffuse lobes, is about , which corresponds to the linear size of 1.3 Mpc. This size, much larger than that of radio galaxies mentioned in the introduction, makes it a quite unusual case among dying radio galaxies found to date.
3. Radio Data
In order to perform a radio analysis of J03497511, we used data from 38 MHz to 5 GHz. Most of the maps and measurements are taken from archives but the crucial 613 MHz images come from dedicated observations with the GMRT. The common flux density scale of our measurements is that of Baars et al. (1977).
3.1. GMRT Observations
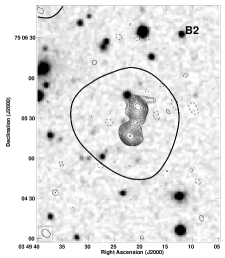
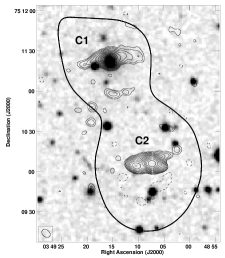
The observations of the source at 613 MHz were made with GMRT in the standard manner in 2014 November. At the beginning, the primary calibrator, 3C48, was observed. Then each observation of the target-source was alternated with observations of the phase calibrator, 3C468.1 or 3C147. The collected data were automatically flagged with the use of the FLAGCAL software pipeline (Prasad & Chengalur 2012; Chengalur 2013) and then reduced and calibrated using the NRAO Astronomical Image Processing System (AIPS) software package111http://www.aips.nrao.edu. Self-calibration was performed several times to improve the quality of the images. The resolution and the rms noise of the map are and 0.03 mJy beam-1, respectively. Subsequently, the original (u, v) data set was tapered at 15 kilo-lambda to make the diffuse structure more visible. The resulting resolution map is presented in Figure 1. Its rms is 0.05 mJy beam-1. In addition, to imagine well the compact structures, not contaminated by extended emission, we obtained a third map which excluded data below 3 kilo-lambda. Three images of compact radio emission sources are shown in Figure 2 (bottom panel). In order to compare the radio emission at 613 MHz with the low-resolution () WENSS map, we tapered the original (u, v) data set again, but in this case at 2.9 kilo-lambda, obtaining a map with rms noise of 0.19 mJy beam-1 and angular resolution of about . The contour of this low-resolution map is shown with a thick line in Figure 1.
3.2. Archival Observations
Radio data pertaining to J03497511 are available in the modern radio sky surveys, e.g., the Very Large Array (VLA) Low-frequency Sky Survey redux (VLSSr; 74 MHz; Lane et al. 2014), the WENSS (326 MHz) and the NVSS (1400 MHz). The two separated objects of this source are available in the Eight Cambridge Survey (8C; 38 MHz; Hales et al. 1995). We have also taken the VLA archival data at 1477 MHz from minute snapshot observations performed in May 1988 (project ID AO 0082), when the antennas were in DnC configuration and reduced them in a standard way using the AIPS package. J03497511 is not detected in the Green Bank 4.85 GHz sky survey (Condon et al. 1989).
4. Infrared and X-ray data
The archival Wide-field Infrared Survey Explorer satellite (WISE; Wright et al. 2010) observations at 3.4 m (W1), 4.6 m (W2), 12 m (W3), 22 m (W4) in the vicinity of the cluster are available. The data related to the dominant galaxy, J034915.47751121.9, found in the WISE catalog, give the following magnitudes: W1=, W2=, W3= and W4=. Using the and colors, it is possible to assess both the galaxy’s and AGN’s type (e.g., Gürkan et. al 2014; Wright et al. 2010). The values calculated for J03497511 indicate that the parent galaxy is of elliptical type and the central source is a low-excitation radio galaxy.
In the X-ray images showing the vicinity of the Abell 449 cluster of galaxies in the Roentgen Satellite (ROSAT) catalog of faint sources (Voges et al. 2000) there appear three structures visible in the energy range 0.5-2.0 keV, 1RXS J034915.2750647, 1RXS J034948.7751027, 1RXS J034953.7751634, which have a count rate of , and cts s-1, respectively. The central positions of these sources in respect to the radio structures are marked with white crosses in Figure 1. Future X-ray observations, however, should clarify if any of these objects are located within the cluster. Anyway, the absence of strong X-ray emission would suggest that Abell 449 is rather a low-mass system. Although cluster radio halos and relics usually reside within X-ray luminous massive galaxy aggregates (e.g., Giovannini et al. 2009), there are some exceptions to the rule (see e.g., Giovannini et al. 2011).
5. Results
5.1. Source Morphology and Spectral Index
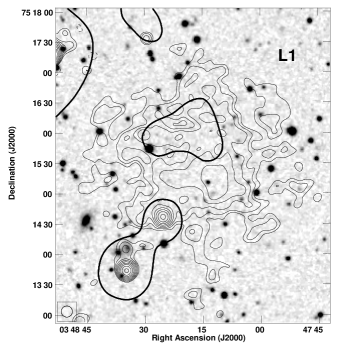
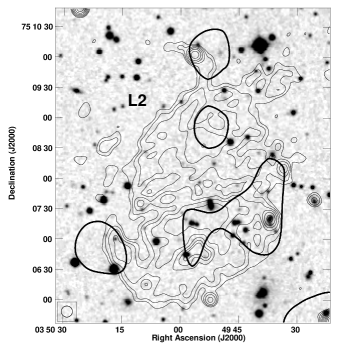
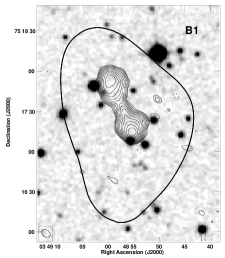
Figures 1– 3 show the vicinity of J03497511 at different radio frequencies. The distinct radio sources within this cluster have been labelled: L1 and L2 mark the north-western and the south-eastern lobe, respectively; B1 and B2 mark the extended background sources; C1 is the radio core of J03497511 and C2 is probably a background source with no optical counterpart. The flux-densities for different regions along with their spectral indices are presented in Table 1.
The radio images show a double-lobed radio source that is axially symmetric. It resembles the giant radio galaxy J02004049 with possible relic lobes described by Godambe et al. (2009). The two roundish diffuse lobes (L1 and L2) with no distinct hotspots do not seem to be connected with any prominent background/foreground galaxy. The L2 lobe is a brighter one and the flux-density ratio of the lobes at 613 MHz is 1.3. The extended sources B1 and B2 are probably background FRII-type (Fanaroff & Riley 1974) radio galaxies. There is a north-south extended central structure between the two lobes, which in the high-resolution images shows two resolved components C1 and C2. The northern component, where the dominant galaxy of this cluster is situated, has an optical counterpart. There are some hints that this component is radio-variable at 1400 MHz (see Table 1). Therefore, C1 seems to be the radio core of J03497511. Most of the flux density of the lobes (L1 and L2) is emitted at low frequencies, while their flux at high frequencies (e.g., NVSS) is faint, if detectable at all (see Figure 2). Accordingly, these structures are apparently aged with spectral index between 74 and 326 MHz. The spectra of the central sources (C1 and C2) and the objects B1, B2 are flatter than those of the lobes.
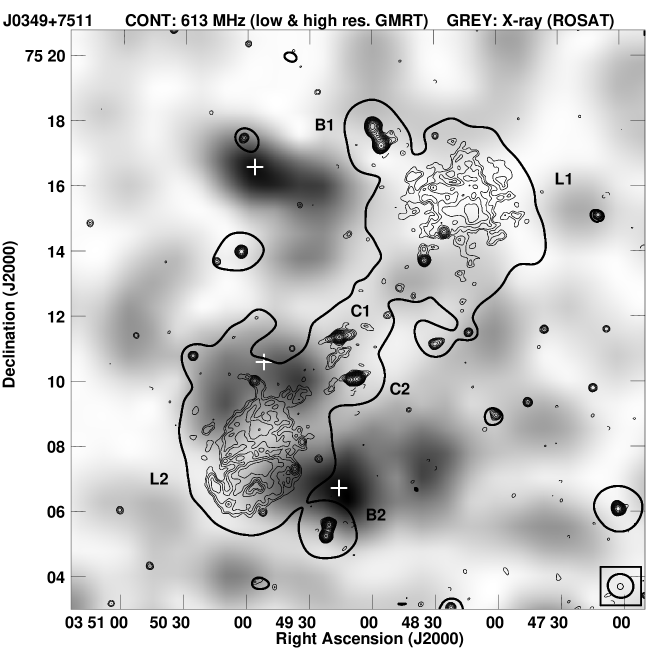
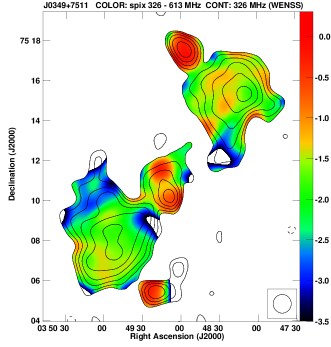
Figure 3 presents the spectral index map across J03497511 and the close objects between 326 MHz and 613 MHz. The map was created from the GMRT and WENSS images with AIPS task COMB. The GMRT map had been earlier (u, v)-tapered at 2.9 kilo-lambda, resized, and convolved with tasks HGEOM and CONVL, so that its geometry and resolution were similar to the WENSS image. There is no evident asymmetry of the spectrum of the lobes, which is steep with a mean value of and for the L1 and L2 lobe, respectively. The apparent steepening can be seen toward the northern edge of the eastern lobe. We note that the very steep radio spectra seen at some points at the outskirts of the structure () may be due to some missing flux in the 613 MHz interferometric map. The central part of the source has a much flatter spectrum than the lobes. The C2 component has a spectral index of , while the mean spectral index of the presumable source core (C1) is . There are regions on both sides of the core, possibly remains of some backflow, which have a much steeper spectrum of about and on the western and eastern side, respectively. The radio core reveal probably a recent jet activity cycle. After the jet activity in a fading radio source stops, it can appear again. In this case, the emission breaks out once more and the spectrum of the new central structure becomes much flatter than those of the diffuse regions. However, the spectrum of a core of a young radio source can be steep () at high frequencies ( GHz). Such sources are called compact steep-spectrum or gigahertz peaked-spectrum radio galaxies. Indeed, a small fraction of radio galaxies with relics/dying lobes feature active radio cores. Those objects are called recurrent activity radio galaxies (for details, see Saikia & Jamrozy 2009). In the case of J03497511, we are dealing just with such a source.
5.2. Source energetics
J03497511 is a low-luminosity radio source with the 613 MHz power of W Hz-1. The source volume has been calculated assuming a spherical shape for the radio lobes, and a rough estimation gives cm3. For deriving the synchrotron age of the particles within the relic lobes, the strength of the magnetic field is required. In estimating it, we rely on the equipartition arguments, and in our calculations we followed the formalism of Beck & Krause (2005). With the help of the Beck & Krause (2005) package named BFIELD, assuming the ratio of energy between protons and electrons to be unity and the spectral index , we obtained the magnetic field strength of the lobes as 0.1130.015 nT, comparable to the value obtained for the remnant radio galaxy J182820484914428 (Brienza et al. 2016). The absence of any apparent jets and hotspots suggests that particle acceleration within the lobes no longer takes place. In order to estimate the total synchrotron age of a relic radio galaxy, one can follow the model (usually labelled as KGJP; Komissarov & Gubanov 1994), assuming two phases of its life, i.e. a period of continuous particle injection, followed by ageing. This method was used by e.g., Murgia et al. (2011), Shulevski et al. (2015), Brienza et al. (2016) who estimated ages of relic radio galaxies. After their birth, radio galaxies are supposed to be fuelled at a constant rate (continuous injection (CI) phase, Kardashev 1962) for a duration of . In this phase, the source’s radio spectrum changes at a break frequency . At the time , the power supply from the nucleus is switched off and the relic phase of duration begins. A new break at higher frequency then appears. This second break is related to the first one by . The KGJP model is described by four parameters. Unfortunately, having flux density measurements at four frequencies only (and one upper limit from the NVSS), the model fitting would be affected by significant errors. Therefore, we decided to fit the spectrum of J03497511 assuming only one phase of its life, with the model of Jaffe & Perola (1973). Using the SYNAGE package (Murgia 1996), we performed a fit to the lobes’ spectrum and computed the break frequency 0.450.12 GHz, above which the radio spectrum steepens from the injected power-law slope. The is related to the spectral age through
| (1) |
where nT is the magnetic field strength equivalent to the cosmic microwave background radiation at the redshift of the source. The obtained value is 3 times larger than the source’s minimum energy magnetic field. Therefore, the energy losses in this relic radio galaxy are probably dominated by the inverse Compton scattering. The estimated mean synchrotron age of the lobes’ particles is about Myr. The estimated age, however, is rather just a lower limit of the total source age, and for a more accurate estimation it is necessary to have flux-density measurements at additional frequencies. According to Beck & Krause (2005), the estimated energy density within the lobes is J cm-3. The energy density value is about two times lower than those obtained for J182820484914428 (Brienza et al. 2016). is directly related to the lobe pressure, , were is the ratio of specific heats. In the case of ultra-relativistic gas, , and hence the pressure (estimated by assuming energy equipartition and pressure balance conditions) is dyn cm-2. The corresponding particle density of the ICM can be estimated as . Here is the Boltzmann constant and is the temperature of the ICM (in K). For temperatures of K, it gives cm-3.
| Survey/Telescope | Spectr. | ||||||
| Region | 8C | VLSSr | WENSS | GMRT | NVSS | VLA | index |
| 38 (MHz) | 74 (MHz) | 326 (MHz) | 613 (MHz) | 1400 (MHz) | 1477 (MHz) | error | |
| Flux density error (mJy) | |||||||
| L1 | 13500 | 2270390 | 330.0 | 67.3 | … | … | 1.860.17 |
| L2 | 18300 | 4270510 | 463.0 | 87.5 | … | … | 1.880.17 |
| B1 | … | … | 55.8 | 41.4 | 23.9 | 19.9 | 0.70 |
| B2 | … | … | 38.5 | 22.2 | 8.3 | 5.4 | 1.29 |
| C1 | … | … | … | 8.8 | 4.4 | 2.7 | 0.99 |
| C2 | … | … | … | 21.4 | 12.0 | 11.4 | 0.71 |
| C1+C2 | … | … | 72.2 | 30.2 | 16.4 | 14.1 | 0.95 |
6. Conclusion
We identified a new ultra-steep 1.3 Mpc giant radio galaxy in Abell 449. The source J03497511 is well visible at low radio frequencies, while hardly detectable above 1.4 GHz. Therefore, J03497511 is an excellent target for further study with the new radio telescopes operating in the meter wavelengths, i.e. the Low Frequency Array and the Long Wavelength Array. The estimated mean synchrotron age of the extended diffuse relic lobes is about 160 Myr. The parent galaxy located symmetrically between the lobes seems to be starting a new jet activity cycle.
7. Acknowledgments
We thank the anonymous Referee, whose comments and suggestions allowed us to significantly improve this article. We thank Prof. Jayaram Chengalur for providing us with the FLAGCAL software and Dr. Matteo Murgia for access to the SYNAGE software. We thank the staff of GMRT, who made these observations possible. GMRT is run by the National Centre for Radio Astrophysics of the Tata Institute of Fundamental Research. M.J. and D.H. acknowledge support by the Polish National Science Centre grant No. 2013/09/B/ST9/00599 and a scholarship of Marian Smoluchowski Research Consortium Matter Energy Future from KNOW funding, respectively.
References
- Baars et al. (1977) Baars, J. W. M., Genzel, R., Pauliny-Toth, I. I. K., Witzel, A., 1977, A&A, 61, 99
- Beck & Krause (2005) Beck, R., Krause, M., 2005, AN, 326, 414
- Brienza et al. (2016) Brienza, M., Godfrey, L., Morganti, R., et. al., 2016, A&A, 585, 29
- Chengalur (2013) Chengalur, J., 2013, NCRA-TIFR Technical Report, NCRA/COM/001
- Condon et al. (1989) Condon, J. J., Broderick, J. J., Seielstad, G. A., 1989, AJ, 97, 1064
- Condon et al. (1998) Condon, J. J., Cotton, W. D., Greisen, E. W., et al., 1998, AJ, 115, 1693
- Cordey (1987) Cordey, R. A., 1987, MNRAS, 227, 695
- Fanaroff & Riley (1974) Fanaroff, B. L., Riley, J. M., 1974, MNRAS, 167, 31
- Feretti et al. (2012) Feretti, L., Giovannini, G., Govoni, F., & Murgia, M., 2012, A&ARv, 20, 54
- Ferrari et al. (2008) Ferrari, C., Govoni, F., Schindler, S., Bykov, A. M., & Rephaeli, Y. 2008, Space Sci. Rev., 134, 93
- Flin & Krywult (2006) Flin, P., & Krywult, J., 2006, A&A, 450, 9
- Giovannini et al. (2009) Giovannini, G., Bonafede, A., Feretti, L., et al. 2009, A&A, 507, 1257
- Giovannini et al. (2011) Giovannini, G., Feretti, L., Girardi, M., et al. 2011, A&A, 530L, 5
- Godambe et al. (2009) Godambe, S., Konar, C., Saikia, D. J., Wiita, P. J., 2009, MNRAS, 396, 860
- Gürkan et. al (2014) Gürkan, G., Hardcastle, M. J., Jarvis, M. J., 2014, MNRAS, 438, 1149
- Hales et al. (1995) Hales, S. E. G., Waldram, E. M., Rees, N., & Warner, P. J., 1995, MNRAS, 274, 447
- Jaffe & Perola (1973) Jaffe, W. J., Perola, G. C., 1973, A&A, 26, 423
- Jamrozy et al. (2004) Jamrozy, M., Klein. U., Mack, K.-H., Gregorini, L., Parma, P., 2004, A&A, 427, 79
- Kardashev (1962) Kardashev, N. S.1962, AZh, 39, 393
- Komissarov & Gubanov (1994) Komissarov, S. S., & Gubanov, A. G., 1994, A&A, 285, 27
- Lane et al. (2014) Lane, W. M., Cotton, W. D., Helmboldt, J. F., et al., 2014, MNRAS, 440, 327
- Monet et al. (2003) Monet, D. G., Levine, S. E., Canzian, B., et al., 2003, AJ, 125, 984
- Murgia (1996) Murgia, M., 1996, Laurea Thesis, Univ. of Bologna
- Murgia et al. (2011) Murgia, M., Parma, P., Mack, K.-H., et al., 2011, A&A, 526, 148
- Parma et al. (2007) Parma, P., Murgia, M., De Ruiter, H. R., et al., 2007, A&A, 470, 875
- Postman et al. (1985) Postman, M., Huchra, J. P., Geller, M. J., 1985, AJ, 90, 1400
- Postman et al. (1992) Postman, M., Huchra, J. P., Geller, M. J., Henry, J. P., 1992, ApJ, 384, 404
- Prasad & Chengalur (2012) Prasad, J., & Chengalur, J., 2012, ExA, 33, 157
- Rengelink et al. (1997) Rengelink, R. B., Tang, Y., de Bruyn, A. G., et al., 1997, A&AS, 124, 259
- Roger et al. (1973) Roger, R. S., Bridle, A. H. & Costain, C. H., 1973, AJ, 78, 1030
- Saikia & Jamrozy (2009) Saikia, D. J., Jamrozy, M., 2009, BASI, 37, 63
- Sarazin (1986) Sarazin, C. L., 1986, \rmp, 58, 1
- Shulevski et al. (2015) Shulevski, A., Morganti, R., Barthel, P. D., et al., 2015, A&A, 583, 89
- Struble & Rood (1982) Struble, M. F., & Rood, H. J., 1982, AJ, 87, 7
- Venturi (2011) Venturi, T., 2011, MmSAI, 82, 499
- Voges et al. (2000) Voges, W., Aschenbach, B., Boller, T., et al., 2000, IAUC, 7432, 3
- Wright et al. (2010) Wright, E. L., Eisenhardt, P. R. M. Mainzer, A. K., et al., 2010, AJ, 140, 1868