What powers the starburst activity of NGC 1068?
Star-driven gravitational instabilities caught in the act
Abstract
We explore the role that gravitational instability plays in NGC 1068, a nearby Seyfert galaxy that exhibits unusually vigorous starburst activity. For this purpose, we use the Romeo-Falstad disc instability diagnostics and data from BIMA SONG, SDSS and SAURON. Our analysis illustrates that NGC 1068 is a gravitationally unstable ‘monster’. Its starburst disc is subject to unusually powerful instabilities. Several processes, including AGN/stellar feedback, try to quench such instabilities from inside out by depressing the surface density of molecular gas across the central kpc, but they do not succeed. Gravitational instability ‘wins’ because it is driven by the stars via their much higher surface density. In this process, stars and molecular gas are strongly coupled, and it is such a coupling that ultimately triggers local gravitational collapse/fragmentation in the molecular gas.
keywords:
instabilities – ISM: kinematics and dynamics – galaxies: individual: NGC 1068 – galaxies: ISM – galaxies: kinematics and dynamics – galaxies: structure.1 INTRODUCTION
NGC 1068 is one of the closest and most famous Seyfert 2 galaxies (Khachikian & Weedman 1974). Since the discovery of its Seyfert 1 nucleus in linearly polarized light (Antonucci & Miller 1985), it presents the strongest case for a unified model of active galactic nuclei (AGNs).
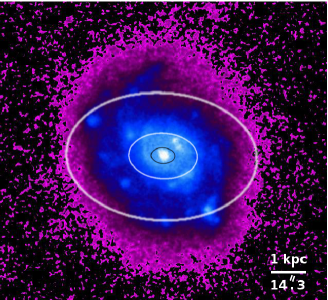
NGC 1068 is also a powerful starburst galaxy. As highlighted by Begelman (1997), vigorous star formation is observed ‘out in the open’ on kiloparsec scales (e.g., Lester et al. 1987; Telesco & Decher 1988; Bruhweiler et al. 1991; Hutchings et al. 1991; Neff et al. 1994). This is beautifully illustrated in Fig. 1, a false-colour UV image of NGC 1068 observed by the UIT team (Neff et al. 1994; Fanelli et al. 1997; Marcum et al. 2001). In this figure, and in the rest of the paper, we adhere to the ‘Ringberg standards’ (Bland-Hawthorn et al. 1997) and adopt a distance of 14.4 Mpc, so that 1″corresponds to 69.8 pc. Fig. 1 shows that, in addition to the AGN, there is a population of luminous starburst knots spread over a bright disc of size , which is surrounded by a fainter halo. The disc emits four times more UV flux than the AGN (Fanelli et al. 1997), and the starburst knots are among the brightest star formation regions known, perhaps the most luminous within a distance of 30 Mpc (Neff et al. 1994).
NGC 1068 displays the classic ‘bar within bar’ morphology, with a starburst pseudo-ring of radius located at the end of the secondary bar (see Bland-Hawthorn et al. 1997 and references therein). Schinnerer et al. (2000) analysed the structures and rotation curve traced by the molecular gas, and estimated that the starburst pseudo-ring (appearing as tightly wound spiral arms in CO) is close both to the inner Lindblad resonance of the primary bar and to the corotation resonance of the secondary bar. Emsellem et al. (2006) analysed the gas and stellar dynamics of NGC 1068 in detail, using a variety of data as well as numerical simulations, and found that there is no clear mode coupling (resonance overlap) between the two bars. In particular, the corotation resonance of the secondary bar lies at , i.e. well beyond the end of the bar (). They also showed that the secondary bar produces clear signatures in the stellar kinematics, and that this structure could drive a significant amount of gas down to the central 300 pc (see Emsellem et al. 2006 for more details).
Gravitational instability is expected to play a significant role in this scenario because of its link with star formation (e.g., Elmegreen 2012; Mac Low 2013), the growth of bars within bars and associated structures (e.g., Shlosman et al. 1989). Brinks et al. (1997) and Gallimore et al. (1999) estimated the value of Toomre’s (1964) stability parameter in the starburst disc of NGC 1068, considering both atomic and molecular gas, but they found no clear evidence of gravitational instability. This result is not discouraging. Disc instabilities are difficult to detect without more powerful diagnostics (Romeo & Fathi 2015).
Here we explore this important aspect of the problem using the disc instability diagnostics developed by Romeo & Wiegert (2011) and Romeo & Falstad (2013), which have been used in a variety of contexts (e.g., Hunter et al. 2013; Meurer et al. 2013; Zheng et al. 2013; Forbes et al. 2014; Genzel et al. 2014; Grebović 2014; Romeo & Agertz 2014; Westfall et al. 2014; Yim et al. 2014; Agertz et al. 2015; Fathi et al. 2015; Goldbaum et al. 2015; Romeo & Fathi 2015; Inoue et al. 2016; Khoperskov et al. 2016; Williamson et al. 2016). To detect gravitational instabilities across the starburst disc of NGC 1068, we consider not only molecular gas but also a component that is still often disregarded when analysing the stability of spiral galaxies: the stars! We do not consider atomic gas because, in the starburst disc of NGC 1068, it has much lower surface density and higher velocity dispersion than molecular gas (Brinks et al. 1997; Gallimore et al. 1999), hence it contributes much less to disc instability (Romeo & Falstad 2013). For a similar reason, we do not consider ionized gas. The data and method are described in Sect. 2, the results are presented in Sect. 3 and discussed in Sect. 4, and the conclusions are drawn in Sect. 5.
2 DATA AND METHOD
As motivated in Sect. 1, we consider molecular hydrogen gas, as traced by CO emission, and stars. A proper two-component stability analysis requires radial profiles of five basic quantities: the epicyclic frequency, , the surface densities of molecular gas and stars, and , the molecular 1D (line-of-sight) velocity dispersion, , and the stellar radial velocity dispersion, . Although for simplicity we use similar notations, the last two quantities reflect an important dynamical difference between molecular gas and stars. To first approximation, molecular gas is collisional so its velocity dispersion is isotropic, while the stellar component is collisionless and has an anisotropic velocity dispersion. We derive , and in Sect. 2.1, and and in Sect. 2.2. Finally, we present the disc instability diagnostics and compute their radial profiles in Sect. 2.3.
2.1 Molecular gas
We use CO data from the BIMA Survey of Nearby Galaxies (BIMA SONG; Helfer et al. 2003), which have a spatial resolution of , sampled at 1″per pixel, and a velocity resolution of 10 km s-1. To derive , and in NGC 1068, we use the same methodology as for NGC 6946 (Romeo & Fathi 2015) and NGC 7469 (Fathi et al. 2015), which we re-describe below. Each part of the following procedure was thoroughly tested by Romeo & Fathi (2015).
We derive spatial maps of and by applying Gaussian fits to the individual spectra. We find that our amplitude map matches the zeroth-moment map presented by the BIMA SONG team. The agreement is within 20%, except where the CO flux approaches the detection limit of the BIMA SONG survey (). One advantage of applying Gaussian fits is that we can get better covering maps if we use a Hanning smoothing algorithm in the spectral direction before fitting the individual Gaussian profiles (e.g., Hernandez et al. 2005; Daigle et al. 2006). This procedure does not affect the line amplitude or shift. However, it artificially broadens the individual spectra by , which we then subtract quadratically from the derived velocity dispersion map. Finally, we apply a cleaning procedure by removing all the spectra for which the emission line amplitude is smaller than twice the rms noise (21% of the spectra), or is smaller than half the velocity channel (3% of the spectra), or the formal error in the derived is greater than 10 km s-1 (5% of the spectra), where the percentage specified in each case is computed inside a box of 6 kpc (). In total, 24% of the spectra are removed. These are pixels where the CO flux approaches the detection limit of the BIMA SONG survey (). Therefore our cleaning procedure does not introduce any significant physical bias in the analysis of molecular gas. A careful inspection of the individual spectra reveals the presence of multiple components at different locations, mostly in the central few 100 pc. In view of the good agreement between our amplitude map and the zeroth-moment map presented by the BIMA SONG team, and in view of the complications involved in multiple-profile fitting schemes (Blasco-Herrera et al. 2010), we do not use profile decomposition methods. All subsequent analysis is therefore based on single-Gaussian profile fitting.
We derive and using robust statistics, which are especially useful when the data are few or contain a significant fraction of outliers, or even when the data deviate significantly from a normal distribution (e.g., Rousseeuw 1991; Müller 2000; Romeo et al. 2004; Huber & Ronchetti 2009; Feigelson & Babu 2012). To derive the radial profiles of and , we divide their maps into tilted rings, which are circular in the plane of the galaxy, and compute the median values of and in each ring. We then estimate the uncertainty in these median values via the median absolute deviation (MAD):
| (1) |
| (2) |
where are the individual measurements of or , is their median value, and is the number of resolution elements in each ring (i.e. the number of pixels in the ring divided by the number of pixels per resolution element). Eqs (1) and (2) are the robust counterparts of the formula traditionally used for estimating the uncertainty in the mean: , where SD denotes the standard deviation (see again Müller 2000).111In Eq. (1), the numerical constant is the product of two factors: . The factor converts the median absolute deviation into a robust estimate of standard deviation: [see eq. (6) and following unnumbered equation of Müller 2000]. The factor converts uncertainty in the mean into uncertainty in the median: [see eq. (8) of Müller 2000]. Indeed, the median and the median absolute deviation provide robust statistical estimates of the ‘central value’ and the ‘width’ of a data set, respectively, even when almost 50% of the data are outliers! Our numerous tests with varying ring widths and radii confirm that the high quality of the BIMA SONG data allows a derivation of and in rings narrower than the synthesized beam size of the interferometric observations. This is mainly thanks to the good sampling of the resolution element. The smallest reliable step is found to be 200 pc. This is the step size adopted throughout our analysis. A step size of 300 pc does not change the derived values of and significantly, but makes their profiles sparsely sampled. As motivated in Sect. 1, the and profiles presented here are derived up to , but we exclude the central because such a region is highly disturbed by a massive AGN-driven outflow (García-Burillo et al. 2014). The surface density of molecular gas is converted to physical units by adopting the standard CO-to- conversion factor, (Bolatto et al. 2013), consistent with Helfer et al. (2003). We also correct for the contribution of helium multiplying by a factor of 1.36.
We derive from the observed rotation curve. To calculate the rotation curve, we assume that circular rotation is the dominant kinematic feature, and that our measurements refer to positions on a single inclined disc. We then use the tilted ring method combined with the harmonic decomposition formalism (e.g., Schoenmakers et al. 1997; Wong et al. 2004; Fathi et al. 2005). This procedure does not correct for beam smearing (e.g., Schinnerer et al. 2000; Teuben 2002; Caldú-Primo et al. 2013). However, it corrects for and automatically models departures from circular motion, which are significant in NGC 1068 (Fathi 2004; Emsellem et al. 2006). Given that this procedure involves fitting several parameters at each radius of the observed velocity field, contrary to simply finding the median values of and , we cannot use the same initial step size. Hence we apply a larger radial step, and interpolate linearly to obtain the rotation curve at all radii where we have calculated the robust and values. Once the rotation curve is calculated at each radius , we derive the angular frequency and the epicyclic frequency .
2.2 Stars
We adopt the high-quality derived by Bakos & Trujillo (2012) from Stripe 82 of the Sloan Digital Sky Survey (SDSS; Abazajian et al. 2009). We also adopt the high-quality spatial map of stellar line-of-sight velocity dispersion () derived by Fathi (2004) and Emsellem et al. (2006) from observations with the Spectrographic Areal Unit for Research on Optical Nebulae (SAURON; Bacon et al. 2001).
To derive from the SAURON map, we use the following method. We start from a general formula that expresses the line-of-sight velocity dispersion () in terms of the radial (), tangential () and vertical () components:
| (3) |
where is the inclination angle of the galaxy, and is the position angle with respect to the major axis in the plane of the disc (see, e.g., Binney & Merrifield 1998). We introduce the two parameters and , and rewrite Eq. (3) as
| (4) |
While (see Sect. 2), both and are significantly different from unity. In fact, from the epicyclic approximation it follows that (see, e.g., Binney & Tremaine 2008). And, for an Sb galaxy like NGC 1068, (Shapiro et al. 2003; Gerssen & Shapiro Griffin 2012). We estimate and as above, and compute the spatial map of from the SAURON map via Eq. (4). Finally, we derive using the same method as for , but only up to . Our numerous tests with varying ring radii and widths show that this is the outer limit for extracting reliable stellar velocity dispersions from the SAURON data.
2.3 Disc instability diagnostics
We use two disc instability diagnostics derived by Romeo & Falstad (2013):
-
1.
a simple and accurate approximation for the stability parameter in multi-component and realistically thick discs;
-
2.
a corresponding approximation for the characteristic instability wavelength, i.e. the scale at which the disc becomes locally unstable as drops below unity.
In our case (molecular gas plus stars) the stability parameter, , and the characteristic instability wavelength, , are given by
| (5) |
| (6) |
where is the Toomre parameter of component , denotes the radial velocity dispersion, and and are given by
| (7) |
| (8) |
This set of equations tells us that the values of and are controlled by the component with smaller . This is the component that drives disc instabilities if . The contribution of the other component is weakened by the factor. For example, if disc instabilities are driven by molecular gas and , then (to leading order) and . Vice versa, in the case of star-driven instabilities, and . The radial profiles of and can easily be computed from the radial profiles derived in Sects 2.1 and 2.2, and from the values of and . If molecular gas is collisional, as is generally assumed, then and . In contrast, the velocity dispersion anisotropy of stars in NGC 1068 is (Shapiro et al. 2003), hence .
To illustrate the predictive power of a proper two-component stability analysis, we will also consider molecular gas alone. In this simple case, the stability parameter and the characteristic instability wavelength are and .
3 RESULTS
3.1 Molecular gas
Let us first consider molecular gas, i.e. the component that is generally regarded as the main driver of disc instabilities in the inner regions of spiral galaxies (e.g., Kennicutt 1989; Martin & Kennicutt 2001; Romeo & Falstad 2013).
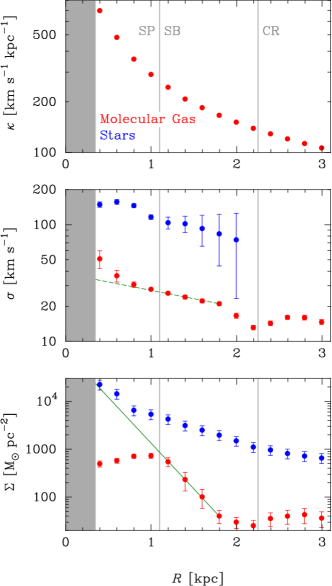
Fig. 2 shows that is depressed at small radii relative to an exponential radial distribution, as was also pointed out by Regan et al. (2001) and Helfer et al. (2003). Exponential distributions are traditionally used for fitting the radial profiles of CO surface brightness observed in nearby galaxies, and thus for inferring important physical parameters such as the scale length of the molecular disc and, when relevant, its central surface density (e.g., Young & Scoville 1982; Young et al. 1995; Sakamoto et al. 1999; Regan et al. 2001; Helfer et al. 2003; Leroy et al. 2008, 2009). Fig. 2 shows that is well fitted by an exponential distribution only within a narrow radial range, , i.e. approximately between the starburst pseudo-ring () and the corotation resonance of the secondary bar (). This makes sense because the central kpc is disturbed not only by a massive AGN-driven outflow (García-Burillo et al. 2014) but also by strong inward streaming motions driven by the starburst pseudo-ring (Emsellem et al. 2006), while radii are disturbed by a change in flow across the corotation resonance of the secondary bar. This is particularly well illustrated by the presence of a cusp in the radial profile of . In addition, for the CO flux approaches the detection limit of the BIMA SONG survey (Regan et al. 2001; Helfer et al. 2003).
A robust, median-based, exponential fit to for yields a scale length of about 230 pc and an extrapolated value of at of about , comparable to the stellar value. Given the small number of data points in this radial range, and given their non-negligible error bars, it might be that even a robust fit is significantly biased. However, the resulting scale length makes sense because it is similar to the scale length that characterizes the nuclear molecular disc of another bar-within-bar galaxy: NGC 6946 (Romeo & Fathi 2015). The central depression has instead no match in NGC 6946. For a galaxy with a massive AGN-driven outflow and intense starburst activity such as NGC 1068, it seems natural to associate the central depression with AGN/stellar feedback (e.g., Karouzos et al. 2014; Storchi-Bergmann 2014; Agertz & Kravtsov 2015; Melioli & de Gouveia Dal Pino 2015; García-Burillo 2016; Hopkins et al. 2016). However, as pointed out by the referee, other processes can contribute to the central depression, e.g. the consumption of molecular gas by star formation and the transport of molecular gas inwards by the action of the bar(s).
As can be seen in Fig. 2, also shows an exponential fall-off for , so we have also robustly fitted in this radial range and extrapolated the fit back into the central kpc. The resulting scale length is about 3 kpc and the extrapolated value of at is about 35 km s-1. Note, however, that the rise of towards the centre can be caused by other factors than the processes mentioned above, e.g. disc heating (Kormendy & Kennicutt 2004; Romeo & Fathi 2015) and beam smearing (Schinnerer et al. 2000; Teuben 2002; Caldú-Primo et al. 2013).
3.2 Is the starburst disc gravitationally unstable?
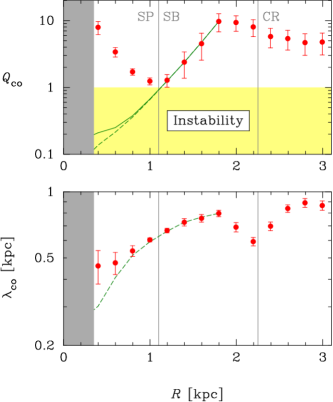
Fig. 3 shows that has a deep minimum at , where its value gets close to unity, while the radial profile of extrapolated using (solid line) is well below unity for . Therefore the effect of the central depression is to raise the stability parameter beyond its critical value (compare the data points with the solid line). This quenches molecular-gas instabilities from inside out, leaving the molecular disc marginally unstable only within an extremely narrow radial range: the starburst pseudo-ring. Fig. 3 also shows that the radial profile of extrapolated using both and (dashed line) is lower than the one extrapolated using only (solid line) for . So the rise of towards the centre strengthens the stabilizing effect of the central depression. And it does so by diluting molecular-gas instabilities over larger scales (see now the bottom panel of Fig. 3, and compare the data points with the dashed line). Last but not least, note that has a clear drop at . This result confirms that the radial profile of the characteristic instability wavelength is a powerful diagnostic for predicting the corotation resonances of bars within bars (Romeo & Fathi 2015).
3.3 Don’t forget the stars!
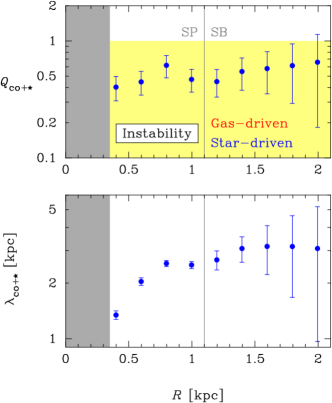
Are gravitational instabilities really so marginally important in the starburst disc of NGC 1068? And does the central depression really have such a strong impact on them? To answer these questions, we must consider a component that is still often disregarded when analysing the stability of spiral galaxies: the stars. and are shown in Fig. 2, while the resulting and are shown in Fig. 4. This figure illustrates two important results:
-
1.
the starburst disc of NGC 1068 is subject to violent and large-scale gravitational instabilities;
-
2.
in the current evolutionary phase of NGC 1068, the central depression does not have a strong impact on disc instabilities because these are entirely driven by the stars.
At , the outer radius imposed by the SAURON data, there is still no sign of transition to local stability or to a gas-driven regime. This is unusual for a nearby star-forming galaxy, as we will discuss in Sect. 4 together with other aspects of the problem.
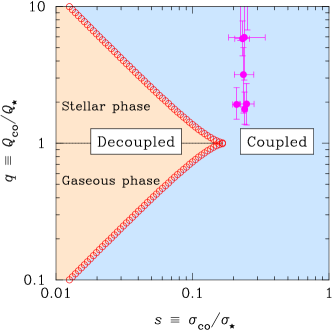
Can star-driven instabilities lead to local gravitational collapse/fragmentation in the molecular gas? To answer this question, we should understand in more detail how molecular gas and stars contribute to disc instabilities. This is shown in Fig. 5. Inside the ‘two-phase region’, the contributions of molecular gas and stars to the gravitational instability of the disc peak at two different wavelengths (Bertin & Romeo 1988; Romeo & Wiegert 2011). In the ‘gaseous phase’, the short-wavelength peak is higher than the other one and molecular gas will dominate the onset of gravitational instability. Vice versa, in the ‘stellar phase’, the long-wavelength peak is higher and stars will dominate. The shape and size of this region are only moderately affected by disc thickness (Romeo & Wiegert 2011), gas turbulence (Hoffmann & Romeo 2012) or the fact that the stellar component is collisionless (Romeo & Falstad 2013). In the rest of the parameter plane, the dynamical responses of the two components are strongly coupled and peak at a single wavelength. This means that any instability driven by one of the components will also perturb and destabilize the other. In particular, star-driven instabilities will lead to local gravitational collapse/fragmentation in the molecular gas. This is clearly the case for NGC 1068, as all of the data fall outside the two-phase region.
4 DISCUSSION
4.1 How unusual is NGC 1068?
To estimate how unusual NGC 1068 is, consider the nearby star-forming galaxies that have been analysed using the Romeo-Falstad disc instability diagnostics (see references in Sect. 1). These are more than 50 galaxies selected from BIMA SONG, DiskMass, HERACLES, SINGS, THINGS and other surveys. Among these galaxies, NGC 1068 is the only one in which is well below unity across such a wide radial range (see Fig. 4). NGC 1068 is also the only galaxy in which disc instabilities are entirely driven by the stars. Most of the other galaxies are instead in stable () star-driven regimes characterized by a strong star-gas coupling. For THINGS spirals, this is illustrated in figs 3–5 of Romeo & Falstad (2013). In view of these facts, it seems natural to associate the unusually violent and large-scale gravitational instabilities detected in NGC 1068 with the unusually intense and widespread starbursts observed in this galaxy (see references in Sect. 1). However, this link is most likely indirect and mediated by several processes (e.g., Elmegreen 2012; Mac Low 2013; Forbes et al. 2014; Goldbaum et al. 2015), which all together lead to a roughly constant depletion time in the molecular gas (see chaps 9 and 10 of Krumholz 2015).
If we consider the high-redshift star-forming galaxies analysed by Genzel et al. (2014), then NGC 1068 seems less unusual, at least from a qualitative point of view. In fact, SINS/zC-SINF galaxies at display rings and central depressions in the inferred gas surface density, powerful AGN-driven nuclear outflows (Förster Schreiber et al. 2014), intense and widespread bursts of star formation, as well as violent and large-scale gravitational instabilities (see fig. 24 of Genzel et al. 2014). In spite of such similarities, there is an important qualitative difference: in these galaxies, disc instabilities are driven by molecular gas and the young generation of stars (Romeo & Agertz 2014), rather than by the older stellar populations. This adds to the well-known quantitative differences that exist between high-redshift galaxies and even their most extreme nearby analogues (e.g., Elmegreen et al. 2013; Glazebrook 2013; Garland et al. 2015).
A fairer comparison would be between NGC 1068 and other nearby Seyfert+starburst galaxies. Unfortunately, to the best of our knowledge, NGC 1068 is the only galaxy of this type that has been analysed using two-component disc instability diagnostics, i.e. considering not only molecular gas but also stars. In view of the interesting and unexpected results found in this paper, it would be of great importance to extend our analysis to other nearby Seyfert+starburst galaxies, and to explore the link between gravitational instability and star formation in such galaxies.
4.2 Highly non-trivial aspects of the problem
Like the original Toomre parameter, measures the stability of the disc against local, axisymmetric, linear perturbations. Relaxing any one of these three basic assumptions discloses a highly non-trivial aspect of the problem (see, e.g., Binney & Tremaine 2008; Bertin 2014). Since we have already discussed this issue in previous papers, here we only summarize the main points.
-
1.
The assumption of local perturbations corresponds to the condition , i.e. , where and denote the radial wavenumber and the radial wavelength, respectively. It is easy to check that NGC 1068 satisfies this short-wavelength approximation (see the bottom panels of Figs 3 and 4), and so do most spiral galaxies (see fig. 6 and sect. 3 of Romeo & Falstad 2013).
-
2.
The assumption of axisymmetric, or tightly wound, perturbations is not so general (see sect. 5.2 of Romeo & Fathi 2015). Non-axisymmetric perturbations have a destabilizing effect, i.e. a disc with is still locally unstable against such perturbations. Unfortunately, there is still no general consensus about the value of . For example, Griv & Gedalin (2012) found that the classical estimate is an absolute upper limit on the critical stability level. Elmegreen (2011) showed that gas dissipation has a similar destabilizing effect, and estimated that . If one assumes this local stability threshold, then the nearby star-forming galaxies considered in Sect. 4.1 are close to marginal instability or unstable, while NGC 1068 is still unusually unstable.
-
3.
The less restrictive assumption of local non-axisymmetric perturbations is also quite controversial (see sect. 3 of Romeo & Falstad 2013). While there is a general consensus that locally stable discs can be globally unstable as regards spiral structure formation, the dynamics and evolution of spiral structure depend critically on the radial profile of (see, e.g., Bertin & Lin 1996). Our results about in NGC 1068 have no direct implications for that problem because they concern the inner , not the whole disc of NGC 1068.
-
4.
The assumption of linear perturbations is questionable for media with large-amplitude fluctuations such as the interstellar gas, where non-linear phenomena like turbulence and shocks are ubiquitous (see, e.g., Shu 1992). Non-linear effects are also important for the dynamics of bars (see, e.g., Athanassoula 2013; Sellwood 2014) and for the evolution of spiral structure in galaxies (see, e.g., Bertin & Lin 1996; Zhang 2012). In other words, this is the most complex aspect of the problem, and is still mostly unsolved! Inoue et al. (2016) investigated the onset and evolution of violent disc instabilities in high-redshift star-forming galaxies, using state-of-the-art simulations and diagnostics, and discussed the importance of non-linear effects in this process. They showed that violent disc instabilities can occur even when is well above unity, and that non-linear effects play an important role in the formation of gas clumps. Romeo et al. (2010) and Romeo & Agertz (2014) showed that gas turbulence can excite three main instability regimes in high-redshift star-forming galaxies, and that two of such regimes have no classical counterpart: violent disc instabilities can occur at scales comparable to the size of gas clumps () even when the inferred value of is arbitrarily large! In nearby star-forming galaxies, the onset of disc instabilities is instead controlled by the value of at scales larger than (Hoffmann & Romeo 2012; Agertz et al. 2015). This is clearly the case for NGC 1068, as the BIMA SONG data have a spatial resolution of (see Sect. 2.1).
5 CONCLUSIONS
In this paper, we have explored the role that gravitational instability plays in NGC 1068, using robust statistics as well as reliable and predictive diagnostics. Our major conclusions are pointed out below.
-
•
The starburst disc of NGC 1068 hosts unusually violent and large-scale gravitational instabilities, which are entirely driven by the self-gravity of the stars. In the instability process, stars and molecular gas are strongly coupled, and such a coupling leads to local gravitational collapse/fragmentation in the molecular gas. A comparison with other nearby star-forming galaxies suggests that there is a link between such instabilities and the unusually intense and widespread bursts of star formation observed in NGC 1068, although this link is most likely indirect and mediated by several processes.
-
•
Several processes, including feedback from the AGN and starburst activity, tend to quench disc instabilities from inside out by flattening down the surface density of molecular gas across the central kpc. In the current evolutionary phase of NGC 1068, this is nevertheless a second-order effect since disc instabilities are driven by the much higher stellar surface density, as pointed out above.
-
•
Our results illustrate that even localized structures such as the starburst pseudo-ring and the secondary bar of NGC 1068 produce clear signatures in the radial profiles of the Romeo-Falstad stability parameter, , and characteristic instability wavelength, . Since similar signatures have been detected in NGC 6946 (Romeo & Fathi 2015) and NGC 7469 (Fathi et al. 2015), and are promising diagnostics for probing the link between gravitational instabilities, starbursts and inner structures in galaxy discs, a topic that we will address further in future work.
ACKNOWLEDGEMENTS
This work made use of data from: BIMA SONG, ‘The BIMA Survey of Nearby Galaxies’ (Helfer et al. 2003); SAURON, ‘The Spectrographic Areal Unit for Research on Optical Nebulae’ (Bacon et al. 2001; Emsellem et al. 2006); and SDSS, ‘The Sloan Digital Sky Survey’ (Abazajian et al. 2009; Bakos & Trujillo 2012). We are very grateful to Oscar Agertz, Guillaume Drouart, Suzy Jones and Lukas Lindroos for useful discussions. We are also grateful to an anonymous referee for constructive comments and suggestions, and for encouraging future work on the topic. KF acknowledges the hospitality of the ESO Garching, where parts of this work were carried out.
References
- [1] Abazajian K. N. et al., 2009, ApJS, 182, 543
- [2] Agertz O., Kravtsov A. V., 2015, preprint (arXiv:1509.00853)
- [3] Agertz O., Romeo A. B., Grisdale K., 2015, MNRAS, 449, 2156
- [4] Antonucci R. R. J., Miller J. S., 1985, ApJ, 297, 621
- [5] Athanassoula E., 2013, in Falcón-Barroso J., Knapen J. H., eds, Secular Evolution of Galaxies. Cambridge University Press, Cambridge, p. 305
- [6] Bacon R. et al., 2001, MNRAS, 326, 23
- [7] Bakos J., Trujillo I., 2012, preprint (arXiv:1204.3082)
- [8] Begelman M. C., 1997, Ap&SS, 248, 1
- [9] Bertin G., 2014, Dynamics of Galaxies. Cambridge University Press, Cambridge
- [10] Bertin G., Lin C. C., 1996, Spiral Structure in Galaxies: A Density Wave Theory. The MIT Press, Cambridge
- [11] Bertin G., Romeo A. B., 1988, A&A, 195, 105
- [12] Binney J., Merrifield M., 1998, Galactic Astronomy. Princeton University Press, Princeton
- [13] Binney J., Tremaine S., 2008, Galactic Dynamics. Princeton University Press, Princeton
- [14] Bland-Hawthorn J., Gallimore J. F., Tacconi L. J., Brinks E., Baum S. A., Antonucci R. R. J., Cecil G. N., 1997, Ap&SS, 248, 9
- [15] Blasco-Herrera J. et al., 2010, MNRAS, 407, 2519
- [16] Bolatto A. D., Wolfire M., Leroy A. K., 2013, ARA&A, 51, 207
- [17] Brinks E., Skillman E. D., Terlevich R. J., Terlevich E., 1997, Ap&SS, 248, 23
- [18] Bruhweiler F. C., Truong K. Q., Altner B., 1991, ApJ, 379, 596
- [19] Caldú-Primo A., Schruba A., Walter F., Leroy A., Sandstrom K., de Blok W. J. G., Ianjamasimanana R., Mogotsi K. M., 2013, AJ, 146, 150
- [20] Daigle O., Carignan C., Amram P., Hernandez O., Chemin L., Balkowski C., Kennicutt R., 2006, MNRAS, 367, 469
- [21] Elmegreen B. G., 2011, ApJ, 737, 10
- [22] Elmegreen B. G., 2012, in Tuffs R. J., Popescu C. C., eds, Proc. IAU Symp. 284, The Spectral Energy Distribution of Galaxies. Cambridge Univ. Press, Cambridge, p. 317
- [23] Elmegreen B. G., Elmegreen D. M., Sánchez Almeida J., Muñoz-Tuñón C., Dewberry J., Putko J., Teich Y., Popinchalk M., 2013, ApJ, 774, 86
- [24] Emsellem E., Fathi K., Wozniak H., Ferruit P., Mundell C. G., Schinnerer E., 2006, MNRAS, 365, 367
- [25] Fanelli M. N., Collins N., Bohlin R. C., Neff S. G., O’Connell R. W., Roberts M. S., Smith A. M., Stecher T. P., 1997, AJ, 114, 575
- [26] Fathi K., 2004, PhD thesis, University of Groningen
- [27] Fathi K., van de Ven G., Peletier R. F., Emsellem E., Falcón-Barroso J., Cappellari M., de Zeeuw T., 2005, MNRAS, 364, 773
- [28] Fathi K. et al., 2015, ApJ, 806, L34
- [29] Feigelson E. D., Babu G. J., 2012, Modern Statistical Methods for Astronomy with R Applications. Cambridge University Press, Cambridge
- [30] Forbes J. C., Krumholz M. R., Burkert A., Dekel A., 2014, MNRAS, 438, 1552
- [31] Förster Schreiber N. M. et al., 2014, ApJ, 787, 38
- [32] Gallimore J. F., Baum S. A., O’Dea C. P., Pedlar A., Brinks E., 1999, ApJ, 524, 684
- [33] García-Burillo S., 2016, preprint (arXiv:1601.04349)
- [34] García-Burillo S. et al., 2014, A&A, 567, A125
- [35] Garland C. A., Pisano D. J., Mac Low M.-M., Kreckel K., Rabidoux K., Guzmán R., 2015, ApJ, 807, 134
- [36] Genzel R. et al., 2014, ApJ, 785, 75
- [37] Gerssen J., Shapiro Griffin K., 2012, MNRAS, 423, 2726
- [38] Glazebrook K., 2013, PASA, 30, 56
- [39] Goldbaum N. J., Krumholz M. R., Forbes J. C., 2015, ApJ, 814, 131
- [40] Grebović S., 2014, Gravitational Instability of Nearby Galaxies: Dwarfs vs. Spirals. M Sc thesis, Chalmers University of Technology, Gothenburg, Sweden
- [41] Griv E., Gedalin M., 2012, MNRAS, 422, 600
- [42] Helfer T. T., Thornley M. D., Regan M. W., Wong T., Sheth K., Vogel S. N., Blitz L., Bock D. C.-J., 2003, ApJS, 145, 259
- [43] Hernandez O., Wozniak H., Carignan C., Amram P., Chemin L., Daigle O., 2005, ApJ, 632, 253
- [44] Hoffmann V., Romeo A. B., 2012, MNRAS, 425, 1511
- [45] Hopkins P. F., Torrey P., Faucher-Giguère C.-A., Quataert E., Murray N., 2016, MNRAS, 458, 816
- [46] Huber P. J., Ronchetti E. M., 2009, Robust Statistics. Wiley, Hoboken
- [47] Hunter D. A., Elmegreen B. G., Rubin V. C., Ashburn A., Wright T., Józsa G. I. G., Struve C., 2013, AJ, 146, 92
- [48] Hutchings J. B. et al., 1991, ApJ, 377, L25
- [49] Inoue S., Dekel A., Mandelker N., Ceverino D., Bournaud F., Primack J., 2016, MNRAS, 456, 2052
- [50] Karouzos M. et al., 2014, ApJ, 784, 137
- [51] Kennicutt R. C. Jr., 1989, ApJ, 344, 685
- [52] Khachikian E. Y., Weedman D. W., 1974, ApJ, 192, 581
- [53] Khoperskov S. A., Vasiliev E. O., Ladeyschikov D. A., Sobolev A. M., Khoperskov A. V., 2016, MNRAS, 455, 1782
- [54] Kormendy J., Kennicutt R. C. Jr., 2004, ARA&A, 42, 603
- [55] Krumholz M. R., 2015, Notes on Star Formation. The Open Astrophysics Bookshelf (arXiv:1511.03457)
- [56] Leroy A. K., Walter F., Brinks E., Bigiel F., de Blok W. J. G., Madore B., Thornley M. D., 2008, AJ, 136, 2782
- [57] Leroy A. K. et al., 2009, AJ, 137, 4670
- [58] Lester D. F., Joy M., Harvey P. M., Ellis H. B. Jr., Parmar P. S., 1987, ApJ, 321, 755
- [59] Mac Low M.-M., 2013, in Wong T., Ott J., eds, Proc. IAU Symp. 292, Molecular Gas, Dust, and Star Formation in Galaxies. Cambridge Univ. Press, Cambridge, p. 3
- [60] Marcum P. M. et al., 2001, ApJS, 132, 129
- [61] Martin C. L., Kennicutt R. C. Jr., 2001, ApJ, 555, 301
- [62] Melioli C., de Gouveia Dal Pino E. M., 2015, ApJ, 812, 90
- [63] Meurer G. R., Zheng Z., de Blok W. J. G., 2013, MNRAS, 429, 2537
- [64] Müller J. W., 2000, J. Res. Natl. Inst. Stand. Technol., 105, 551
- [65] Neff S. G., Fanelli M. N., Roberts L. J., O’Connell R. W., Bohlin R., Roberts M. S., Smith A. M., Stecher T. P., 1994, ApJ, 430, 545
- [66] Regan M. W., Thornley M. D., Helfer T. T., Sheth K., Wong T., Vogel S. N., Blitz L., Bock D. C.-J., 2001, ApJ, 561, 218
- [67] Romeo A. B., Agertz O., 2014, MNRAS, 442, 1230
- [68] Romeo A. B., Falstad N., 2013, MNRAS, 433, 1389
- [69] Romeo A. B., Fathi K., 2015, MNRAS, 451, 3107
- [70] Romeo A. B., Wiegert J., 2011, MNRAS, 416, 1191
- [71] Romeo A. B., Horellou C., Bergh J., 2004, MNRAS, 354, 1208
- [72] Romeo A. B., Burkert A., Agertz O., 2010, MNRAS, 407, 1223
- [73] Rousseeuw P. J., 1991, J. Chemometrics, 5, 1
- [74] Sakamoto K., Okumura S. K., Ishizuki S., Scoville N. Z., 1999, ApJS, 124, 403
- [75] Schinnerer E., Eckart A., Tacconi L. J., Genzel R., Downes D., 2000, ApJ, 533, 850
- [76] Schoenmakers R. H. M., Franx M., de Zeeuw P. T., 1997, MNRAS, 292, 349
- [77] Sellwood J. A., 2014, Rev. Mod. Phys., 86, 1
- [78] Shapiro K. L., Gerssen J., van der Marel R. P., 2003, AJ, 126, 2707
- [79] Shlosman I., Frank J., Begelman M. C., 1989, Nature, 338, 45
- [80] Shu F. H., 1992, The Physics of Astrophysics Vol. 2: Gas Dynamics. University Science Books, Mill Valley
- [81] Storchi-Bergmann T., 2014, in Sjouwerman L. O., Lang C. C., Ott J., eds, Proc. IAU Symp. 303, The Galactic Center: Feeding and Feedback in a Normal Galactic Nucleus. Cambridge Univ. Press, Cambridge, p. 354
- [82] Telesco C. M., Decher R., 1988, ApJ, 334, 573
- [83] Teuben P. J., 2002, in Athanassoula E., Bosma A., Mujica R., eds, ASP Conf. Ser. Vol. 275, Disks of Galaxies: Kinematics, Dynamics and Perturbations. Astron. Soc. Pac., San Francisco, p. 217
- [84] Toomre A., 1964, ApJ, 139, 1217
- [85] Westfall K. B., Andersen D. R., Bershady M. A., Martinsson T. P. K., Swaters R. A., Verheijen M. A. W., 2014, ApJ, 785, 43
- [86] Williamson D., Martel H., Kawata D., 2016, preprint (arXiv:1602.03817)
- [87] Wong T., Blitz L., Bosma A., 2004, ApJ, 605, 183
- [88] Yim K., Wong T., Xue R., Rand R. J., Rosolowsky E., van der Hulst J. M., Benjamin R., Murphy E. J., 2014, AJ, 148, 127
- [89] Young J. S., Scoville N., 1982, ApJ, 258, 467
- [90] Young J. S. et al., 1995, ApJS, 98, 219
- [91] Zhang X., 2012, preprint (arXiv:1208.3537)
- [92] Zheng Z., Meurer G. R., Heckman T. M., Thilker D. A., Zwaan M. A., 2013, MNRAS, 434, 3389