The Parkes HI Zone of Avoidance Survey
Abstract
A blind H I survey of the extragalactic sky behind the southern Milky Way has been conducted with the multibeam receiver on the 64-m Parkes radio telescope. The survey covers the Galactic longitude range and Galactic latitudes to an rms sensitivity of 6 mJy per beam per 27 km s-1 channel, and yields 883 galaxies to a recessional velocity of 12,000 km s-1. The survey covers the sky within the H I Parkes All-Sky Survey (HIPASS) area to greater sensitivity, finding lower H I-mass galaxies at all distances, and probing more completely the large-scale structures at and beyond the distance of the Great Attractor. Fifty-one percent of the H I detections have an optical/near-infrared (NIR) counterpart in the literature. A further 27% have new counterparts found in existing, or newly obtained, optical/NIR images. The counterpart rate drops in regions of high foreground stellar crowding and extinction, and for low-H I mass objects. Only 8% of all counterparts have a previous optical redshift measurement. The H I sources are found independently of Galactic extinction, although the detection rate drops in regions of high Galactic continuum. The survey is incomplete below a flux integral of approximately 3.1 Jy km s-1 and mean flux density of approximately 21 mJy, with 75% and 81% of galaxies being above these limits, respectively. Taking into account dependence on both flux and velocity width, and constructing a scaled dependence on the flux integral limit with velocity width (), completeness limits of 2.8 Jy km s-1 and 17 mJy are determined, with 92% of sources above these limits. A notable new galaxy is HIZOA J135358, a possible companion to the Circinus galaxy. Merging this catalog with the similarly-conducted northern extension (Donley et al. 2005), large-scale structures are delineated, including those within the Puppis and Great Attractor regions, and the Local Void. Several newly-identified structures are revealed here for the first time. Three new galaxy concentrations (NW1, NW2 and NW3) are key in confirming the diagonal crossing of the Great Attractor Wall between the Norma cluster and the CIZA J1324.7-5736 cluster. Further contributors to the general mass overdensity in that area are two new clusters (CW1 and CW2) in the nearer Centaurus Wall, one of which forms part of the striking (Mpc) long filament that dominates the southern sky at velocities of km s-1, and the suggestion of a further wall at the Great Attractor distance at slightly higher longitudes.
1 Introduction
In addition to serving as a direct probe of neutral hydrogen gas, observations of the 21-cm line of H I allow the detection of galaxies through the thickest Galactic obscuration and the presence of the highest foreground stellar confusion, which mask galaxies at optical/IR wavelengths. The historical Zone of Avoidance (ZOA) has prevented study of the distribution of galaxies behind the Milky Way and is most pronounced in the optical. Dedicated low-Galactic-latitude optical searches and surveys of galaxies in the infrared have narrowed the ZOA, but still fail to detect galaxies where Galactic emission, dust obscuration, and stellar confusion prevent the recognition of background galaxies. The near-infrared (NIR) has been particularly fruitful for finding large numbers of low-latitude galaxies. However, the most homogeneous NIR wide-angle redshift survey, the 2MASS Redshift Survey (Huchra et al. 2012), is still not an all-sky survey, as it retains a gap of around the Galactic Plane. While this does not affect our understanding of galaxy populations, as there is no reason to think galaxies in the ZOA are in any way different from high-latitude ones, the lack of information in the ZOA contributes uncertainty to our understanding of dynamics in the local Universe. Controversial results persist for the apex and convergence radius for the CMB dipole from galaxy redshift and peculiar velocity surveys (e.g., Erdogdu et al. 2006; Watkins et al. 2009; Lavaux et al. 2010; Lavaux and Hudson 2011; Courtois et al. 2012, Ma et al. 2012; Springob et al. 2014). While insufficient depth in redshift space of the relevant datasets (e.g., optical, 2MASS, IRAS, galaxy clusters) may be a factor, the incomplete mapping of the ZOA is also important (e.g., Kraan-Korteweg and Lahav 2000, Loeb and Narayan 2008).
Beyond the ability to find galaxies in regions of arbitrarily high extinction and stellar confusion, using the 21-cm line of H I to detect galaxies has the added benefit of immediate redshift measurement, eliminating the need that two-dimensional imaging surveys have for follow-up observations to obtain redshifts. This blind H I survey technique for finding hidden galaxies was pioneered by Kerr and Henning (1987), but technology allowing large areas of the sky to be surveyed at 21-cm became available only relatively recently, with L-band multibeam receivers installed on the Parkes, Arecibo, Jodrell Bank Lovell, and Effelsberg radio telescopes.
We report here on a 21-cm H I survey of the southern hemisphere ZOA, fully covering the area ; to a sensitivity of 6 mJy at velocity resolution of 27 km s-1 with the 64 m Parkes radio telescope. We refer to this survey as HIZOA-S. A shallow survey of this area, with partial data and much lower sensitivity (15 mJy), was presented by Henning et al. (2000), and an intermediate-depth study of the Great Attractor region was conducted by Juraszek et al. (2000), with rms 20 mJy at slightly better velocity resolution. Two extensions to the north ( and ) have been studied at identical sensitivity to HIZOA-S by Donley et al. (2005). We refer to this as HIZOA-N. A region of the Galactic Bulge, above and below our latitude range around the Galactic Center, has also been surveyed to higher Galactic latitude, but has not been fully analysed yet. Preliminary descriptions appear in Shafi (2008) and Kraan-Korteweg et al. (2008). The current work presents the data for the main full-sensitivity southern ZOA survey, HIZOA-S. The discussion of large-scale structures (§7) makes use of the combined southern and northern data. We refer to the combined sample as HIZOA. The H I Parkes All-Sky Survey (HIPASS; Meyer et al. 2004) also covers the area, but to 2-3 times lower sensitivity than the current work and is unable to define detailed structure at Great Attractor distances.
An early fully-sampled, blind, but shallow H I survey (Koribalski et al. 2004) has delineated local large-scale structures at low Galactic latitudes. Further, pointed 21-cm observations of partially-obscured galaxies have revealed large-scale structures in selected regions (Kraan-Korteweg, Henning and Schröder 2002; Schröder, Kraan-Korteweg and Henning 2009), but the current work covers the entire southern ZOA, over 1800 deg2, in a blind, deep, and complete fashion. The remainder of the great circle of the ZOA in the northern hemisphere is now being surveyed by the Arecibo (Henning et al. 2010, McIntyre et al. 2015) and Effelsberg (Kerp et al. 2011) radio telescopes. There are also ongoing efforts to uncover the three-dimensional distribution of partially-obscured galaxies with pointed 21-cm observations of selected galaxies visible in the NIR with the Nançay radio telescope (van Driel et al. 2009, Ramatsoku et al. 2014). The combination of H I and deep NIR imaging in regions of modest extinction and stellar confusion allows determination of peculiar velocities via the Tully-Fisher relation, and thus provides information on galaxy flows. Such surveys are possible in the ZOA with the advent of large H I surveys, such as the current work, and follow-up NIR imaging of the counterparts of the HIZOA-galaxies (Williams et al. 2014, Said et al. in prep.). In the future, all-sky H I surveys, using the Australian Square Kilometre Array Pathfinder (ASKAP: Johnston et al. 2007; Koribalski 2012), and the APERture Tile In Focus system on the Westerbork telescope in the north (APERTIF: Verheijen et al. 2009), will allow comprehensive and complete mapping of large-scale structures as revealed by neutral hydrogen. Preparatory work is already underway for such large interferometric ZOA surveys; for instance the Westerbork Synthesis Radio Telescope (WSRT) has been used for a deep ZOA mosaic with a field of view close to that of the forthcoming APERTIF system. Ultimately, the SKA itself will extend such H I surveys further in redshift.
In §2, we present details of the observations and data reduction for the survey; in §3 we describe the sample compilation and H I parametrization. In §4, H I properties of the sample are presented, and multiwavelength counterparts are described in §5. §6 presents the survey’s completeness, reliability and parameter accuracy. In §7, new large-scale structures and their relationships to high-latitude structures are discussed. We present conclusions in §8.
2 Observations and Data Reduction
2.1 Multibeam Observations
The observations described here were taken with the 21-cm multibeam receiver (Staveley-Smith et al. 1996) at the Parkes telescope between 1997 March 22 and 2000 June 8, contemporaneously with the southern component of HIPASS. The observations cover the Galactic longitude range in 23 separate regions, each 8° wide in longitude, and cover the latitude range with almost uniform sensitivity. As noted above, later observations (Donley et al. 2005) extended the longitude range by 16° in each direction (HIZOA-N). The observational parameters are identical to those described in Donley et al. (2005), but are summarised in Table 1 for completeness.
Each of the 23 longitude regions (8° in longitude by 10° in latitude) was scanned in raster fashion by the telescope at a rate of 1° min-1, in a direction of increasing, or decreasing, Galactic longitude. Each scan therefore lasted 8 minutes plus overlap and turn-around time. The central beam was scanned at constant latitude; however, to minimise bandpass effects, the receiver was not rotated (‘parallactified’) during the scan. The other 12 beams tended therefore to deviate slightly from constant latitude. The receiver rotation was adjusted such that the feed rotation was approximately 15° from the direction of the scan at the mid-point of each observation (Staveley-Smith 1997). This ensured almost-Nyquist coverage of the sky even for a single scan, covering a region in size. However, for sensitivity reasons, each of the 23 regions was raster scanned 425 times, giving a total integration time of approximately 2100 s for each point of the sky (with the actual value dependent on gridding strategy) and an rms noise of 6 mJy beam-1. The observations were conducted at night over a period of three years, and there was considerable redundancy in the data. Each point in the sky was visited hundreds of times, allowing mitigation of the already low levels of radio frequency interference (RFI) in this band. For more details, see Meyer et al. (2004). The main issue encountered was confusion with Galactic recombination lines (see Meyer et al. 2004 or Alves et al. 2015) which, being diffuse and associated with radio continuum emission, was straightforward to recognise in the image domain.
The central observing frequency was 1394.5 MHz with a bandwidth of 64 MHz and a channel spacing of 62.5 kHz. This corresponds to a velocity range of km s-1, and a channel spacing of 13.2 km s-1 at zero redshift. After Hanning smoothing, the velocity resolution was 27 km s-1. The correlator integration time was 5 sec, resulting in negligible smearing along the scan direction. Two orthogonal linear polarisations were recorded, and combined to Stokes in the gridding step (see below). Calibration against the continuum radio sources Hydra A and PKS B1934-638 was usually monitored on a daily or weekly basis to check system performance. However, all calibration was referenced to a continuously firing noise diode inserted in each of the 13 feeds at 45° to the transducers. No evidence was found for any time variability in the noise diode amplitude. Neither is there any measurable gain-elevation effect at the Parkes telescope at these frequencies.
| Parameter | Value | unit |
|---|---|---|
| Galactic longitude | ||
| Galactic latitude | ||
| Velocity range | km s-1 | |
| Velocity resolution | 27 | km s-1 |
| Scan rate | 1.0 | degree min-1 |
| Beam size (FWHP) | 15.5 | arcmin |
| Correlator cycle | 5 | s |
| Integration time per beam | 2100 | s |
| Cube rms | 6 | mJy |
2.2 Data Reduction through to Cubes
The spectral data was reduced at the telescope in real time using the LiveData package111http://www.atnf.csiro.au/computing/software/livedata. LiveData buffered the incoming data and applied position interpolation so that the correct beam position was assigned to the mid-point of each correlator spectrum. It then applied a barycentric correction using an FFT shift and smoothed the data with a Tukey 25% filter (see Barnes et al. 2001). Bandpass correction was then applied using reference spectra derived from the median of all spectra taken within 2 min ( in the scan direction) of each spectrum being corrected, except where a scan boundary was encountered. The reference spectrum was calculated separately for each beam and polarisation. Up to 49 spectra, including the spectrum being corrected, were used to form each reference spectrum. The median statistic helped to suppress any RFI and any compact HI emission in the reference spectrum, which would otherwise appear as a spatial sidelobe. The bandpass was then corrected, and the flux density calibration applied.
Automated and manual quality control measures were used to ensure that high data quality was maintained. Scans containing bad data, or scans containing telescope or correlator errors were always re-observed, unless the errors were not recognised until after the completion of all ZOA observations.
Gridding into sky cubes was performed using gridzilla, also written especially for the large datasets arising from multibeam observations (this data set consists of over 24 million spectra). Cubes were made using a simple top-hat median filter of all the data for a given spectral channel lying within a radius of 6′ of each pixel. Although this technique loses S/N ratio relative to normal least-squares parametric techniques, it proved extremely effective in removing residual RFI or variable baseline ripple without extensive manual intervention. As noted in Barnes et al. (2001), this particular gridding kernel requires an adjustment to the flux scale of 28% in order that the flux density of compact sources is preserved. This is applied directly to the cubes.
The pixel size of the final cubes is 4′ in RA and Dec and 13.2 km s-1 in velocity (at zero redshift). The gridded FWHP beamsize is approximately 155, compared with the normal Parkes beam at 1400 MHz of 143, averaged across the 13 beams. Most of the considerable continuum emission was removed using the bandpass correction procedure described above. However, residual continuum emission remained, and this was further suppressed using the ‘scaled template method’ (luther), written by one of us and described in Barnes et al. (2001), where a weighted spectral template derived from the strongest sources in the field was scaled in amplitude to fit to the spectrum at each point in the cube. Finally, the data cubes were Hanning-smoothed to minimise ripple from strong Galactic H I signals. This results in a final velocity resolution of 27 km s-1. Spectra from the final cubes are available for download222http://www.atnf.csiro.au/research/multibeam/release – select ‘Data Source = ZOA’..
3 Sample Compilation and H I Parametrization
The initial HIPASS automated source list (Meyer et al. 2004) required the visual inspection of 33 times the number of galaxies that appeared in the final catalog. Due to residual baseline excursions, especially in the presence of strong continuum, the efficiency of automated algorithms applied to the HIZOA data was even lower. Therefore, we chose to create the HIZOA catalog by visual searches alone. Each Hanning-smoothed cube was independently visually inspected by 2 or 3 authors, over the entire velocity range from km s-1 to km s-1, using the visualization package karma (Gooch 1996). The candidate lists created by each searcher were given to a single author who served as “adjudicator” for all cubes to produce as uniform a final catalog as possible. There were no quantitative a priori selection criteria, although for a signal to be accepted as extragalactic H I it had to be at or exceeding the 5 level in peak flux density, at least marginally extended in velocity, and cleanly separated from Galactic H I in velocity space. Galactic gas tends to be more diffuse than external galaxies at our resolution, which are typically unresolved by the Parkes beam, although compact clouds certainly exist. While it is difficult to securely discriminate between High-Velocity Clouds and nearby dwarf galaxies in H I, the former are generally spatially more extended and visibly related to lower-velocity Galactic gas in our cubes. Generally, the H I sources showed distributions in velocity space consistent with known H I sources, i.e. either two-horned, flat-topped, or Gaussian profiles, and are well separated from Galactic gas velocities.
Once the final list of sources was made, the determination of H I parameters was done using the program mbspect within the miriad package (Sault et al. 1995). For each source, zeroth-moment maps were made, and the centroid of the H I emission was obtained by Gaussian fitting with either a FWHM equal to the gridded telescope beam for unresolved galaxies, or a Gaussian of matching width in the case of resolved galaxies. Using this fitted position, the weighted sum of the emission along the spectral dimension of the datacube was calculated, producing the one-dimensional H I spectrum. Each spectrum was visually inspected, and a low-order polynomial was fit to the line-free channels and subtracted, to remove any slowly-varying spectral baseline. The total flux due to H I was then determined from this baseline-subtracted spectrum by integrating across the channels containing 21-cm emission. The heliocentric velocity (in the optical convention, ) of each source was determined by taking the average of the velocity values at the 50% of peak flux points on the profile. Linewidths at the 50% or 20% of peak flux levels were measured ( and respectively), using a width-maximizing algorithm. To correct for instrumental broadening due to the coarse velocity resolution after Hanning smoothing (27 km s-1), the values of and were decreased by 14 and 21 km s-1, respectively (Henning et al. 2000). The errors on all values were calculated using the formalism of Koribalski et al. (2004); they do not take into account baseline fitting errors. The errors that depend on linewidth (errors on heliocentric velocity, and ) were calculated using the observed (uncorrected) linewidths and are therefore somewhat conservative values. In the case that the linewidth at 20% of peak flux was not robustly measurable due to the signal’s being too close to the noise level, no value is listed in the catalog (Table 2). Because the errors on heliocentric velocity and also depend on , via measurement of the steepness of the profile edges, the sample average value of ( km s-1 was used to calculate these two errors when was not available for a particular source.

| HIZOA ID | f | RA | Dec | Flux | |||||||||
|---|---|---|---|---|---|---|---|---|---|---|---|---|---|
| J2000.0 | [deg] | [deg] | [km s-1] | [km s-1] | [km s-1] | [Jy km s-1] | [km s-1] | [Mpc] | [M] | ||||
| (1) | (2) | (3a) | (3b) | (4a) | (4b) | (5) | (6) | (7) | (8) | (9) | (10) | (11) | (12) |
| J063101 | 06 31 49.3 | 40 25 | 212.19 | 0.77 | 663422 | 18444 | 26267 | 9.23.1 | 6475 | 86.3 | 10.21 | ||
| J063801 | 06 38 16.6 | 28 56 | 212.75 | 1.09 | 26158 | 20016 | 22625 | 4.71.0 | 2453 | 32.7 | 9.07 | ||
| J064002 | 06 40 53.6 | 39 50 | 214.10 | 1.00 | 118246 | 7812 | 11118 | 4.30.8 | 11656 | 155.4 | 10.38 | ||
| J064101 | 06 41 01.9 | 41 34 | 213.25 | 0.82 | 27255 | 10811 | 13416 | 8.61.4 | 2561 | 34.1 | 9.37 | ||
| J064503 | 06 45 20.1 | 05 58 | 215.00 | 1.14 | 777413 | 18325 | 27738 | 3.80.6 | 7602 | 101.4 | 9.96 | ||
| J064700A | 06 47 03.5 | 36 31 | 212.97 | 0.78 | 40588 | 4716 | 6023 | 2.41.0 | 3895 | 51.9 | 9.18 | ||
| J064700B | 06 47 18.8 | 50 33 | 213.21 | 0.78 | 420312 | 10024 | 13336 | 2.70.9 | 4039 | 53.8 | 9.26 | ||
| J064900 | 06 49 40.4 | 10 36 | 212.89 | 0.78 | 26936 | 11412 | 12918 | 2.20.6 | 2530 | 33.7 | 8.77 | ||
| J065011 | 06 50 13.7 | 13 08 | 222.81 | 0.82 | 27286 | 25312 | 27519 | 13.11.9 | 2525 | 33.7 | 9.54 | ||
| J065203 | 06 52 14.0 | 40 01 | 216.29 | 1.06 | 261412 | 17323 | 2.50.7 | 2436 | 32.5 | 8.78 | |||
| J065303A | 06 53 10.6 | 59 57 | 216.69 | 1.23 | 28704 | 668 | 8412 | 5.10.8 | 2691 | 35.9 | 9.19 | ||
| J065303B | 06 53 21.1 | 53 32 | 216.61 | 1.17 | 25655 | 15110 | 17316 | 8.21.2 | 2386 | 31.8 | 9.29 | ||
| J065304 | 06 53 52.5 | 00 18 | 216.77 | 1.25 | 25597 | 8014 | 3.80.8 | 2379 | 31.7 | 8.95 | |||
| J065404 | 06 54 10.0 | 44 26 | 217.46 | 1.23 | 65869 | 9919 | 12628 | 2.30.7 | 6403 | 85.4 | 9.60 | ||
| J065403 | 06 54 41.8 | 15 38 | 216.21 | 0.76 | 27777 | 6314 | 7521 | 1.50.5 | 2600 | 34.7 | 8.62 | ||
| J065609 | 06 56 10.9 | 34 29 | 222.00 | 0.70 | 27263 | 257 | 4010 | 1.90.4 | 2525 | 33.7 | 8.69 | ||
| J065603 | 06 56 16.1 | 42 29 | 216.78 | 0.99 | 24815 | 8310 | 10115 | 3.00.6 | 2301 | 30.7 | 8.82 | ||
| J065705A | 06 57 30.0 | 11 12 | 218.24 | 1.01 | 25805 | 2869 | 32914 | 25.72.0 | 2394 | 31.9 | 9.79 | ||
| J065713 | 06 57 46.0 | 10 58 | 225.40 | 0.64 | 62278 | 6916 | 9724 | 2.80.8 | 6014 | 80.2 | 9.63 | ||
| J065705B | 06 57 57.8 | 19 26 | 218.41 | 1.09 | 27213 | 946 | 12010 | 25.42.6 | 2535 | 33.8 | 9.83 | ||
| J065805 | 06 58 20.7 | 58 48 | 219.04 | 1.18 | 28176 | 3211 | 5017 | 2.70.9 | 2628 | 35.0 | 8.90 | ||
| J065812 | 06 58 34.8 | 19 52 | 224.73 | 0.58 | 550022 | 11343 | 29165 | 4.00.9 | 5289 | 70.5 | 9.67 | ||
| J065901 | 06 59 18.8 | 31 14 | 215.18 | 0.69 | 17343 | 1546 | 1719 | 18.31.9 | 1561 | 20.8 | 9.27 | ||
| J065900 | 06 59 51.5 | 23 42 | 214.24 | 0.60 | 698512 | 26423 | 5.61.3 | 6816 | 90.9 | 10.04 | |||
| J070013 | 07 00 07.2 | 54 18 | 226.31 | 0.52 | 56488 | 18315 | 19623 | 2.60.7 | 5432 | 72.4 | 9.51 | ||
| J070002 | 07 00 19.4 | 23 44 | 216.08 | 0.73 | 17745 | 3410 | 5014 | 2.50.7 | 1597 | 21.3 | 8.43 | ||
| J070004 | 07 00 29.5 | 12 28 | 217.71 | 0.87 | 2973 | 606 | 799 | 30.63.8 | 113 | 1.5 | 7.22 | ||
| J070010 | 07 00 51.0 | 21 40 | 223.22 | 0.58 | 960812 | 33824 | 39437 | 7.61.3 | 9403 | 125.4 | 10.45 | ||
| J070011 | 07 00 58.1 | 47 17 | 224.51 | 0.56 | 27443 | 4107 | 42910 | 18.51.4 | 2534 | 33.8 | 9.70 | ||
| J070001 | * | 07 01 04.2 | 54 02 | 212.34 | 0.45 | 17556 | 31912 | 34819 | 15.52.3 | 1595 | 21.3 | 9.22 | |
| J070112 | 07 01 21.0 | 14 31 | 224.96 | 0.68 | 94276 | 7512 | 10718 | 2.90.6 | 9215 | 122.9 | 10.01 | ||
| J070107 | 07 01 58.5 | 18 38 | 220.64 | 0.94 | 17508 | 10716 | 13324 | 3.10.8 | 1555 | 20.7 | 8.50 | ||
| J070211 | 07 02 09.6 | 34 48 | 224.46 | 1.50 | 28196 | 4912 | 6818 | 2.30.6 | 2609 | 34.8 | 8.81 | ||
| J070215 | 07 02 12.9 | 27 57 | 227.93 | 0.51 | 814513 | 4326 | 5239 | 0.90.7 | 7923 | 105.6 | 9.36 | ||
| J070203A | 07 02 15.3 | 13 38 | 217.04 | 1.76 | 668512 | 40223 | 41735 | 5.21.5 | 6504 | 86.7 | 9.96 | ||
| J070203B | 07 02 34.5 | 18 30 | 217.15 | 0.99 | 25796 | 12311 | 13617 | 3.70.8 | 2398 | 32.0 | 8.95 | ||
| J070212 | 07 02 50.3 | 19 37 | 225.20 | 0.67 | 93276 | 7912 | 9218 | 2.40.7 | 9114 | 121.5 | 9.93 | ||
| J070413 | 07 04 25.1 | 42 07 | 226.60 | 0.65 | 90009 | 7818 | 3.40.9 | 8782 | 117.1 | 10.04 | |||
| J070502 | 07 05 37.1 | 37 01 | 212.22 | 0.39 | 17434 | 389 | 5813 | 6.21.4 | 1583 | 21.1 | 8.81 | ||
| J070512 | 07 05 39.9 | 59 55 | 226.11 | 0.60 | 54554 | 1859 | 19813 | 5.80.9 | 5239 | 69.9 | 9.83 | ||
| J070604 | 07 06 15.9 | 55 23 | 219.00 | 0.51 | 24816 | 5312 | 7118 | 2.40.7 | 2292 | 30.6 | 8.72 | ||
| J070606 | 07 06 55.2 | 24 24 | 220.40 | 0.71 | 25084 | 697 | 8311 | 5.30.9 | 2313 | 30.8 | 9.08 | ||
| J070711 | 07 07 12.3 | 30 20 | 224.96 | 0.60 | 17308 | 16216 | 17323 | 2.30.7 | 1518 | 20.2 | 8.34 | ||
| J070714 | 07 07 24.5 | 24 55 | 227.57 | 0.61 | 273210 | 3220 | 6030 | 1.30.6 | 2511 | 33.5 | 8.53 | ||
| J070808 | 07 08 18.6 | 17 01 | 222.22 | 0.64 | 64727 | 23013 | 26720 | 5.20.7 | 6270 | 83.6 | 9.93 | ||
| J070801 | 07 08 40.8 | 25 41 | 216.17 | 0.24 | 74839 | 18617 | 3.80.8 | 7306 | 97.4 | 9.93 | |||
| J070903 | 07 09 01.0 | 57 37 | 218.46 | 0.33 | 36636 | 7812 | 9018 | 2.00.6 | 3476 | 46.4 | 9.01 | ||
| J070905 | 07 09 34.2 | 24 14 | 219.81 | 0.40 | 17195 | 24810 | 27315 | 14.41.6 | 1527 | 20.4 | 9.15 | ||
| J071007 | 07 10 51.0 | 57 48 | 222.23 | 0.55 | 24058 | 9216 | 12324 | 2.60.7 | 2203 | 29.4 | 8.72 | ||
| J071105 | 07 11 45.0 | 19 26 | 219.99 | 0.34 | 365712 | 3425 | 6637 | 2.21.1 | 3464 | 46.2 | 9.05 | ||
| J071209 | 07 12 48.6 | 18 58 | 223.65 | 0.56 | 243710 | 8420 | 2.90.9 | 2230 | 29.7 | 8.78 | |||
| J071301 | 07 13 24.2 | 31 03 | 216.79 | 0.15 | 49575 | 479 | 6314 | 1.70.4 | 4778 | 63.7 | 9.22 | ||
| J071307A | 07 13 34.5 | 51 10 | 222.44 | 0.53 | 24713 | 577 | 7810 | 14.21.9 | 2268 | 30.2 | 9.48 | ||
3.1 The Catalog
The H I profiles for the first 32 of the 883 galaxies in the survey are shown in Figure 1 (the remainder are available in the online version of the Journal). Vertical lines indicate the spectral ranges used for baseline subtraction, and the linear or polynomial fit is shown. On each profile, the peak, 50% and 20% levels are noted with dots. Table 2 is an example page of the full catalog (the table is published in its entirety in the electronic edition of the Astronomical Journal); it lists H I parameters and derived quantities for the galaxies in the following columns:
Columns (1) and (2) - Source name and flag. HIZOA galaxies in the Great Attractor region which were first reported by Juraszek et al. (2000) and in HIZOA-N (Donley et al. 2005) retain their original names, even if the position measurement has been improved by this survey. Names affected by those positional changes are indicated with an asterisk in Col. 2. The H I parameters quoted are for the current work.
Columns (3a and 3b) - Equatorial coordinates (J2000.0) of the fitted position.
Columns (4a and 4b) - Galactic coordinates.
Column (5) - Reddening as derived from the IRAS/DIRBE maps (Schlegel et al. 1989) and corrected with a factor of 0.86 as derived by Schlafly & Finkbeiner (2011).
Column (6) - Heliocentric velocity and error.
Column (7) - Velocity width at 50% of peak flux density, corrected for instrumental broadening, and associated error.
Column (8) - Velocity width at 20% of peak flux density, corrected for instrumental broadening, and associated error.
Column (9) - H I flux integral and associated error.
Column (10) - Velocity of the galaxy corrected to the Local Group frame of reference via:
Column (11) - Distance to the galaxy in Megaparsec, based on and H0 = 75 km s-1Mpc-1.
Column (12) - Logarithm of the H I mass.
4 H I Properties of the Sample
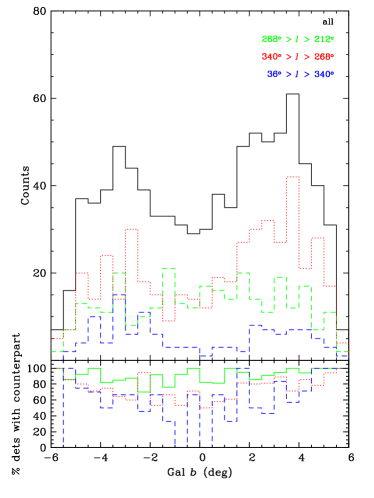
An overview of the H I properties of the sample of 883 galaxies is shown in Fig. 2. The top panel shows the distribution of the galaxies’ recessional velocities in the Local Group frame of reference. The distribution generally reflects the noise-limited sensitivity of the survey, but also reveals the overdensity of galaxies in the Great Attractor region, at about 5000 km s-1. This feature is apparent despite the averaging across a variety of large-scale structures in this wide-angle survey, described in more detail in §7. The HIZOA survey was designed to map large-scale structure at the distance of the Great Attractor more completely than the HIPASS survey, which did not have the sensitivity to trace structure beyond about 4000 km s-1 (the rms for HIPASS is mJy in the Galactic Plane versus an average of 6 mJy for HIZOA). This allowed HIZOA to detect galaxies at lower H I masses, and thus probe lower down the H I mass function at Great Attractor distances (eg. Fig. 3).
The next panel shows the distribution of H I linewidths measured at half-peak, , which has a mean value of 163 km s-1 and a median of 147 km s-1, with large, non-Gaussian variation from the smallest value of 17 km s-1 to 699 km s-1 maximum. Three detections, which we believe are not confused, have km s-1, the largest of which (J141658, km s-1) is a perfectly edge-on spiral. The iteratively-clipped rms noise at the location of each detected source is shown in the next panel. Due to the clipping and the limited velocity range over which the measurement is made, this is normally much lower than the overall cube rms of 6 mJy. Some galaxies were found in areas with rms as high as mJy at the edge of the field or near strong Galactic foreground radiation. The lowest panel shows the distribution of the H I masses, which ranges from 6.8 to 10.8 in the logarithm, with a mean of 9.5 and a median of 9.6. The most massive H I object, HIZOA J083643, has been the subject of radio interferometry and deep NIR

follow-up observations, showing it to be a high surface brightness, massive disk galaxy with an extended H I disk (Donley et al. 2006; Cluver et al. 2008, 2010).

The well-known Circinus galaxy lies within the survey area, and is re-detected here as HIZOA J141365. The narrow velocity width, low-H I-mass () detection HIZOA J135358, less than from Circinus, has a recessional velocity that is only about 200 km s-1 different from the large galaxy. At the low recession velocities of these objects of only a few hundred km s-1, Hubble flow distances are very uncertain, but it seems likely this newly-detected object is a previously-unknown galaxy which is related to the Circinus galaxy. As its velocity corrected to the Local Group frame is negative, and thus a Hubble distance is undefined in this frame, we adopt a redshift-independent distance measurement to Circinus, 4.2 Mpc (Tully et al. 2009), as the distance to both HIZOA J141365 and HIZOA J135358.
The Circinus galaxy as well as four other detections (J150952, J151452, J153256, J161655) are significantly extended, that is, resolved with respect to the beam.
Figure 3 shows the distribution of H I mass as a function of velocity in the Local Group frame for the HIZOA-S and HIPASS (Meyer et al. 2004) samples. This illustrates the higher sensitivity of the HIZOA survey over HIPASS, as HIZOA finds lower H I-mass galaxies at all distances, but also reflects the smaller area covered, which produced fewer detections overall, compared to HIPASS. The completeness limit for HIZOA-S is also shown in the figure and is fully described in §6. As in the top panel of Fig. 2, despite the inclusion of a variety of large-scale structures probed in this wide-angle survey, clear overdensities at km s-1 (Hy/Ant and Puppis) and km s-1 (the Great Attractor region) are evident in the velocity distribution of the HIZOA galaxies. These structures are discussed in detail in §7.
5 Multiwavelength Counterparts
To find counterparts for the H I detections, we have (a) searched the literature through online databases, and (b) searched images at various wavelengths.
Our main literature search was done using the NASA/IPAC Extragalactic Database (NED)333http://ned.ipac.caltech.edu/. We submitted a list of the H I detections through the NED batch service using a search radius (status 2013 August). For comparison, we also conducted a search with the SIMBAD444http://simbad.u-strasbg.fr/simbad/ Astronomical Database. There were only a couple of cases in which SIMBAD had a galaxy listed but NED did not. On the other hand, SIMBAD listed more (unclassified) IRAS sources than NED, which we looked at (using their colors as a first-order indicator for galaxies). The searches also supplied a redshift where available. Particular attention was paid to galaxies with optical redshifts since these have negligible positional uncertainties.
For the visual search, we downloaded images from the SuperCOSMOS Sky Surveys555http://www-wfau.roe.ac.uk/sss/ (-band), the Digitized Sky Surveys (DSS)666http://www3.cadc-ccda.hia-iha.nrc-cnrc.gc.ca/en/dss/ (- and -band), 2MASS777http://irsa.ipac.caltech.edu/applications/2MASS/ (-band) as well as UKIDSS888http://surveys.roe.ac.uk/wsa/ and VISTA999http://horus.roe.ac.uk/vsa/ wherever possible (mainly -band but if not available we used the band closest in wavelength). Finally, we added -band images (as well as in or when necessary) which were obtained at the Infrared Survey Facility at Sutherland (IRSF) for the purpose of extracting photometry on all galaxies within the HIZOA search circles. A first set of this catalog was published by Williams et al. (2014) and the rest is in preparation (Said et al. in prep.).
While the field-of-view of the IRSF images is , the downloaded images were extracted as or, in some cases, . The 2MASS images are only wide and clearly not all of the -radius search circle could be covered in a single image. 2MASS images covering the missing bits of the search area were added when no suitable candidate could be found at any other passband. In addition, the DIRBE/IRAS maps101010http://www.astro.princeton.edu/s̃chlegel/dust/ (Schlegel et al. 1998) were downloaded and viewed together with the images to take into account the amount and distribution of extinction in the area. WISE111111http://irsa.ipac.caltech.edu/applications/wise/ images (Wright et al. 2010) were used to better distinguish between galaxies and Galactic objects.
Images were viewed with DS9121212http://ds9.si.edu/ and overlaid with regions indicating (i) the H I position, (ii) the search radius, and (iii) the positions of the objects found with NED and SIMBAD. We added positions from HIPASS (Meyer et al. 2004) and the HIZSS shallow survey catalog (Henning et al. 2000). While displaying the H I parameters, these images were searched simultaneously by eye to detect any possible galaxy in the field. Most galaxies found in the literature were visible in at least one passband, and quite often unpublished galaxies could be found, especially blue late-type galaxies (often not or barely visible in the NIR) or, on deep NIR images, galaxies at high extinctions or near the Galactic bulge where 2MASS has difficulty detecting galaxies due to severe star crowding.
If more than one galaxy was found, the most likely counterpart was selected based on the H I parameters, the appearance of the galaxy on the images and the extinction information. In some cases no reasonable decision could be made on which of the galaxies is the counterpart, hence, both possible (but ambiguous) candidates are retained. In other cases, the chosen candidate was classified as ‘probable’, indicating that another galaxy could also be considered as the counterpart albeit less likely. This class was also used when no second candidate was visible but the appearance of the galaxy was not an ideal match with the H I parameters. Finally, sometimes more than one candidate is considered to contribute to the profile (i.e., the profile is likely to be ‘confused’).
Some of the counterparts lie beyond the nominal search radius. They were found when a larger search circle seemed appropriate (cf. the discussion below).
The counterparts are listed in Table 3 (an example page of which is shown here), which is published in its entirety in the electronic edition of the Astronomical Journal. It is divided into three parts, reflecting the different types or counterparts found as explained above. Table 3a lists those HIZOA detections which either have a single or no counterpart. Table 3b presents detections where more than one galaxy is assumed to contribute to the H I profile (note that where the confusing partner was another of our H I detections we do not list them separately). Finally, Table 3c lists those cases where more than one candidate was found but, judged by the profile, only one of them is the likely counterpart. The columns are as follows:
Column (1) - Source name as in Table 2.
Columns (2a and 2b) - Galactic coordinates of the H I detection.
Column (3) - Distance to the H I galaxy in Megaparsec, as in Table 2.
Column (4) - Logarithm of the H I mass, as in Table 2.
Column (5) - Extinction in the -band, converted from given in Table 2 using . A star denotes an extinction value deemed to be uncertain during the search (e.g., due to high spatial variability).
Column (6) - Classification of the counterpart; ‘d’ = definite, ‘p’ = probable, ‘a’ = ambiguous, ‘c’ = confused candidate; ‘–’ = no candidate.
Column (7) - Flags for counterparts in major catalogs: ‘I’ stands for IRAS Point Source Catalog (Helou & Walker 1988), ‘M’ for 2MASX (Jarrett et al. 2000), ‘W’ for Williams et al. 2014 (the IRSF catalog), ‘H’ for the HIPASS catalogs (South, Meyer et al. 2004 and North, Wong et al. 2006) or ‘h’ for other HIPASS publications (Kilborn et al. 2002; Ryan-Weber et al. 2002), ‘S’ for the H I Parkes ZOA Shallow Survey (HIZSS, Henning et al. 2000), and ‘Z’ for earlier HIZOA publications (Juraszek et al. 2000 and Donley et al. 2005).
Column (8) - Velocity in the literature (cf. NED and HyperLEDA131313http://leda.univ-lyon1.fr/): ‘o’ = optical (and, in one case, ‘x’ for X-ray), ‘h’ = H I (note that Juraszek et al. 2000 and Henning et al. 2000 are not included here since their H I parameters are not independent of ours, but see flags in Col. 7).
Column (9) - Source ‘l’ for name and coordinates: ‘N’ is listed in NED, ‘S’ is listed in SIMBAD, ‘c’ is coordinates measured on DSS or NIR images (note that some published coordinates were not centered properly so we give the measured ones).
Column (10) - Note in the appendix.
Columns (11a and 11b) - Equatorial coordinates (J2000.0) of the counterpart.
Column (12) - Distance between the H I fitted position and the counterpart position in arcminutes.
Column (13) - One name in the literature in this order of preference: NGC, ESO, RKK/WKK, CGMW, 2MASS, others.
| HIZOA ID | class | I | M | W | H | S | Z | o | h | l | c | Note | RA | Dec | Name | ||||||
|---|---|---|---|---|---|---|---|---|---|---|---|---|---|---|---|---|---|---|---|---|---|
| [deg] | [deg] | [Mpc] | [M] | [mag] | J2000.0 | [] | |||||||||||||||
| (1) | (2a) | (2b) | (3) | (4) | (5) | (6) | (7) | (8) | (9) | (10) | (11a) | (11b) | (12) | (13) | |||||||
| (a) HI detections with single cross-matches: | |||||||||||||||||||||
| J063101 | 212.19 | 86.3 | 10.21 | 3.2 | p | - | - | - | H | - | - | - | h | - | c | n | 06 32 09.5 | 01 36 53 | 6.1 | – | |
| J063801 | 212.75 | 32.7 | 9.07 | 4.5 | d | - | - | - | - | - | - | - | - | - | c | - | 06 38 20.3 | 01 28 38 | 1.0 | – | |
| J064002 | 214.10 | 155.4 | 10.38 | 4.2 | d | - | M | - | - | - | - | - | - | N | - | - | 06 40 56.02 | 02 38 32.6 | 1.4 | 2MASX J06405601-0238326 | |
| J064101 | 213.25 | 34.1 | 9.37 | 3.4 | d | - | - | - | - | - | - | - | - | - | c | - | 06 40 58.4 | 01 44 03 | 2.6 | – | |
| J064503 | 215.00 | 101.4 | 9.96 | 4.7 | d | - | M | - | - | - | - | - | - | N | - | - | 06 45 23.44 | 03 07 14.3 | 1.5 | 2MASX J06452346-0307141 | |
| J064700A | 212.97 | 51.9 | 9.18 | 3.2 | - | - | - | - | - | - | - | - | - | - | - | n | – | – | – | ||
| J064700B | 213.21 | 53.8 | 9.26 | 3.2 | p | - | M | - | - | - | - | - | - | N | - | - | 06 47 13.16 | 00 49 50.1 | 1.6 | 2MASX J06471318-0049501 | |
| J064900 | 212.89 | 33.7 | 8.77 | 3.2 | d | - | - | - | - | - | - | - | - | - | c | - | 06 49 29.7 | 00 09 03 | 3.1 | – | |
| J065011 | 222.81 | 33.7 | 9.54 | 3.4 | d | I | M | - | H | - | - | o | h | N | - | - | 06 50 10.61 | 11 15 13.0 | 2.2 | CGMW 1-0411 | |
| J065203 | 216.29 | 32.5 | 8.78 | 4.4 | d | - | M | - | - | - | - | - | - | N | - | - | 06 52 00.20 | 03 40 34.2 | 3.5 | CGMW 1-0424 | |
| J065303A | 216.69 | 35.9 | 9.19 | 5.1 | p | - | - | - | H | - | - | - | h | - | c | n | 06 53 13.6 | 04 00 04 | 0.7 | – | |
| J065303B | 216.61 | 31.8 | 9.29 | 4.8 | d | - | - | - | H | - | - | - | h | - | c | n | 06 53 21.8 | 03 52 57 | 0.6 | – | |
| J065304 | 216.77 | 31.7 | 8.95 | 5.2 | - | - | - | - | - | - | - | - | - | - | - | n | – | – | – | ||
| J065404 | 217.46 | 85.4 | 9.60 | 5.1 | d | - | - | - | - | - | - | - | - | - | c | - | 06 53 59.7 | 04 42 16 | 3.3 | – | |
| J065403 | 216.21 | 34.7 | 8.62 | 3.2 | p | - | - | - | - | - | - | - | - | - | c | - | 06 54 39.0 | 03 16 23 | 1.0 | – | |
| J065609 | 222.00 | 33.7 | 8.69 | 2.9 | d | - | - | - | - | - | - | - | - | - | c | - | 06 56 09.2 | 09 36 31 | 2.1 | – | |
| J065603 | 216.78 | 30.7 | 8.82 | 4.1 | p | - | - | - | H | - | - | - | h | - | c | - | 06 56 23.0 | 03 45 26 | 3.4 | – | |
| J065705A | 218.24 | 31.9 | 9.79 | 4.2 | d | I | M | - | H | - | - | - | h | N | - | n | 06 57 21.50 | 05 08 59.6 | 3.1 | CGMW 1-0464 | |
| J065713 | 225.40 | 80.2 | 9.63 | 2.7 | d | - | M | - | - | - | - | - | - | N | - | - | 06 57 40.63 | 13 11 15.2 | 1.3 | 2MASX J06574062-1311150 | |
| J065705B | 218.41 | 33.8 | 9.83 | 4.5 | d | I | M | W | H | S | - | o | h | N | - | n | 06 58 02.90 | 05 20 41.0 | 1.8 | CGMW 1-0470 | |
| J065805 | 219.04 | 35.0 | 8.90 | 4.9 | - | - | - | - | H | - | - | - | h | - | - | - | – | – | – | ||
| J065812 | 224.73 | 70.5 | 9.67 | 2.4 | d | - | M | - | - | - | - | - | - | N | - | - | 06 58 30.63 | 12 22 00.8 | 2.4 | CGMW 1-0472 | |
| J065901 | 215.18 | 20.8 | 9.27 | 2.8 | d | - | - | - | H | S | - | - | h | N | c | - | 06 59 20.4 | 01 31 31 | 0.5 | CGMW 1-0476 | |
| J065900 | 214.24 | 90.9 | 10.04 | 2.5 | d | I | M | - | - | - | - | o | - | N | - | - | 06 59 53.72 | 00 25 27.5 | 1.8 | CGMW 1-0479 | |
| J070013 | 226.31 | 72.4 | 9.51 | 2.2 | d | - | - | W | - | - | - | - | - | - | c | - | 07 00 02.4 | 13 52 05 | 2.5 | – | |
| J070002 | 216.08 | 21.3 | 8.43 | 3.0 | d | - | - | - | H | - | - | - | h | - | c | - | 07 00 31.8 | 02 22 45 | 3.3 | – | |
| J070010 | 223.22 | 125.4 | 10.45 | 2.4 | p | - | M | - | - | - | - | - | - | N | - | - | 07 00 34.38 | 10 20 15.1 | 4.3 | 2MASX J07003437-1020151 | |
| J070011 | 224.51 | 33.8 | 9.70 | 2.3 | d | - | M | - | H | - | - | - | h | N | - | - | 07 00 56.14 | 11 47 34.3 | 0.6 | CGMW 1-0488 | |
| J070001 | 212.34 | 21.3 | 9.22 | 1.8 | d | I | M | - | H | - | Z | o | h | N | - | - | 07 01 03.30 | 01 54 40.6 | 0.7 | UGC03630 | |
| J070112 | 224.96 | 122.9 | 10.01 | 2.8 | d | - | M | - | - | - | - | - | h | N | - | - | 07 01 25.75 | 12 15 22.0 | 1.4 | CGMW 1-0491 | |
| J070107 | 220.64 | 20.7 | 8.50 | 3.9 | d | - | - | - | - | - | - | - | - | - | c | - | 07 01 47.2 | 07 19 36 | 3.0 | – | |
| J070211 | 224.46 | 34.8 | 8.81 | 6.2 | - | - | - | - | - | - | - | - | - | - | - | - | – | – | – | ||
| J070215 | 227.93 | 105.6 | 9.36 | 2.1 | d | - | - | - | - | - | - | - | - | - | c | - | 07 02 18.1 | 15 26 47 | 1.7 | – | |
| J070203A | 217.04 | 86.7 | 9.96 | 7.3* | d | - | M | - | - | - | - | - | - | N | - | - | 07 02 15.33 | 03 13 46.6 | 0.1 | CGMW 1-0497 | |
| J070203B | 217.15 | 32.0 | 8.95 | 4.1 | - | - | - | - | H | - | - | - | h | - | - | - | – | – | – | ||
| J070212 | 225.20 | 121.5 | 9.93 | 2.8 | d | - | - | - | - | - | - | - | - | - | c | - | 07 02 52.9 | 12 20 16 | 0.9 | – | |
| J070413 | 226.60 | 117.1 | 10.04 | 2.7 | d | - | M | - | - | - | - | - | - | N | - | n | 07 04 25.31 | 13 46 26.0 | 4.3 | CGMW 1-0523 | |
| J070502 | 212.22 | 21.1 | 8.81 | 1.6 | d | - | - | - | H | - | Z | - | h | N | c | - | 07 05 38.5 | 02 37 18 | 0.4 | [H92] 16 | |
| J070512 | 226.11 | 69.9 | 9.83 | 2.5 | d | - | - | - | H | - | - | - | h | - | c | - | 07 05 41.8 | 13 00 30 | 0.8 | – | |
| J070604 | 219.00 | 30.6 | 8.72 | 2.1 | d | - | - | - | - | - | - | - | - | - | c | - | 07 06 14.0 | 04 57 09 | 1.8 | – | |
| J070606 | 220.40 | 30.8 | 9.08 | 2.9 | d | - | - | - | - | - | - | - | - | - | c | - | 07 06 58.0: | 06 25 10: | 1.0 | – | |
| J070711 | 224.96 | 20.2 | 8.34 | 2.5 | d | - | M | - | - | - | - | - | - | N | - | - | 07 07 16.68 | 11 30 27.8 | 1.1 | 2MASX J07071668-1130281 | |
| J070714 | 227.57 | 33.5 | 8.53 | 2.5 | - | - | - | - | - | - | - | - | - | - | - | - | – | – | – | ||
| J070808 | 222.22 | 83.6 | 9.93 | 2.7 | d | - | - | - | - | - | - | - | - | - | c | - | 07 08 25.8 | 08 17 01 | 1.8 | – | |
| J070801 | 216.17 | 97.4 | 9.93 | 1.0 | d | - | - | - | - | - | - | - | - | N | - | - | 07 08 36.83 | 01 26 30.8 | 1.3 | 2MASX J07083681-0126306 | |
| J070903 | 218.46 | 46.4 | 9.01 | 1.4 | d | - | - | - | - | - | - | - | - | S | c | n | 07 08 57.8 | 03 58 39 | 1.3 | DSH J0708.9-0358 | |
| J070905 | 219.81 | 20.4 | 9.15 | 1.6 | d | I | M | - | H | S | - | o | h | N | - | - | 07 09 34.59 | 05 25 40.5 | 1.4 | CGMW 1-0575 | |
| J071007 | 222.23 | 29.4 | 8.72 | 2.3 | p | - | - | - | - | - | - | - | - | - | c | - | 07 10 57.9 | 07 54 31 | 3.7 | – | |
| J071105 | 219.99 | 46.2 | 9.05 | 1.4 | d | - | - | - | - | - | - | - | - | - | c | - | 07 11 54.0 | 05 18 13 | 2.5 | – | |
| J071209 | 223.65 | 29.7 | 8.78 | 2.3 | d | I | M | W | - | - | - | - | h | N | - | - | 07 12 48.61 | 09 18 22.6 | 0.6 | CGMW 1-0617 | |
5.1 Results of counterpart search
Of the 883 H I detections, we found cross matches for 688 (78%). At least 18 (2%) H I detections have more than one counterpart, that is, more than one galaxy contributes to the H I profile, see Table 3b (not counted here are detections that are confused but could be separated into their H I components which are all listed in Table 2). For another 17 (2%) H I detections, there is no unambiguous counterpart. Instead we list two possible candidates each in Table 3c (note that these profiles do not show any indication of confusion).
A total of 295 (33%) detections have been detected previously in H I, where 256 (28%) have been detected with HIPASS and 110 (12%) are also listed in the HIZSS catalog.
Of the 708 cross matches found (from Table 3c we count arbitrarily only the first entry each), 328 (46%) are listed in NED or SIMBAD (), an additional 138 (19%) are detected by Williams et al. (2014) on deep NIR images, and 240 (34%) have no optical/IR counterparts. There are 128 (18%) IRAS counterparts (with a further 8 (1%) uncertain identifications), 248 (35%) are listed in 2MASS, and 58 (8%) have an optical (that is, independent) velocity.
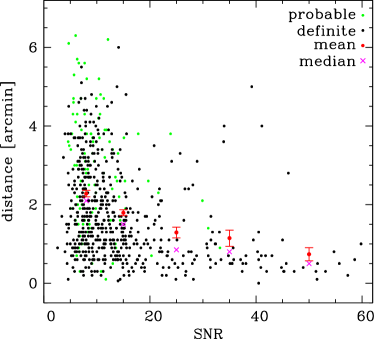
Of the 558 single cross matches (that is, matches from Table 3a only and excluding probable matches), the median distance between the H I position and the actual position is , while 95% of the cross matches have a distance . The dependence of the mean and median distance on signal-to-noise ratio (SNR) is shown in Fig. 4. Aside from low SNR, unusually large distances are probably due to offset emission or confusion (two or more galaxies contributing to the emission) (cf. Table 3b).
For example, in Fig. 4, two of the five objects with SNR and distance have and two are extended. In one case (J081729B with km s-1, km s-1, SNR, dist) there is a very bright, nearby H I detection 20′ away (J081730 with km s-1, km s-1).
Koribalski et al. (2004) find that 95% of their optical cross matches have a positional offset . If we use a cut in peak flux similar to theirs ( Jy), our offset for 95% of our cross matches is . Reasons for the difference can be our smaller sample size for this cut () and the fact that Koribalski et al. use the nearest match in HyperLEDA, while we make an informed decision which of the close-by galaxies is the counterpart. In fact, we find that for 13% of our H I detections there is a galaxy closer than the cross match.
5.2 Properties of the counterpart sample
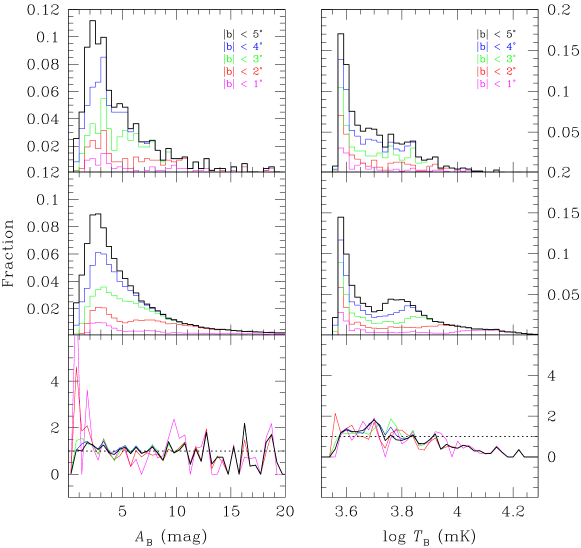
With a counterpart found for 78% of the H I detections, we can investigate whether there are any systematics that affect the finding of counterparts. Obviously there is a dependence on extinction, although we find that the identification of counterparts is fairly independent of extinction up to due to the available deep NIR imaging (VISTA, UKIDSS, IRSF).
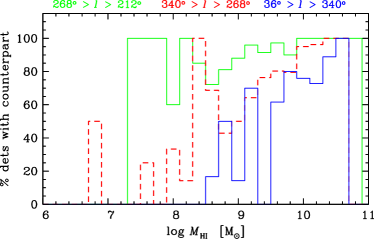
Galaxies with high H I mass and broad linewidths are more easily recovered than (late-type) dwarf galaxies, although this also depends on the extinction. Figure 5 shows histograms of the H I mass of cross-identified H I detections dependent on the location in the ZOA (Puppis area in green; GA area in dashed red; Local Void area in blue). In the Puppis area, far from the Galactic Bulge, we find almost all HIZOA detections have cross matches. However, the detection rate decreases with H I mass for galaxies found in the Local Void / Galactic Bulge area where stellar crowding and extinction severely affects the cross-identification in the optical/NIR.
6 Completeness, Accuracy and Reliability
6.1 Completeness
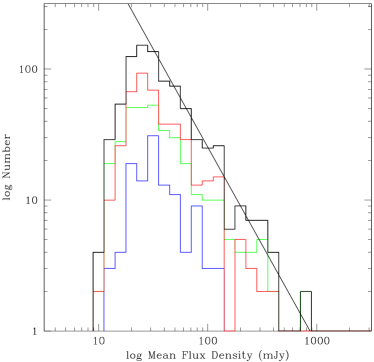
Previous analysis of the data in the otherwise identical northern extension of this survey, HIZOA-N (Donley et al. 2005), has concluded that the completeness limit lies at a mean flux density of 22 mJy. That is, galaxies with profiles whose mean flux density, , is greater than 22 mJy are generally detected with high completeness. Galaxies below this threshold can be detected, but with increasingly poor completeness. The main exceptions to this limit, as also noted by Donley et al. , are in regions of high rms at the edge of the field of view and, more importantly, towards bright radio continuum regions in the Galactic Plane. Bright Galactic continuum not only raises the receiver temperature and lowers sensitivity, but can also give rise to non-flat spectral baselines, hampering detectability. A histogram of the mean flux density, , for HIZOA-S constrained by and is shown in Fig. 6, as well as three subsets of different Galactic longitude ranges of width . In agreement with Donley et al., incompleteness in mean flux density is obvious below 30 mJy. Incompleteness seems to drop off more quickly in the region represented by the blue histogram which contains the Local Void. This is probably due to a combination of the higher continuum in this region (see below) and large-scale structure.
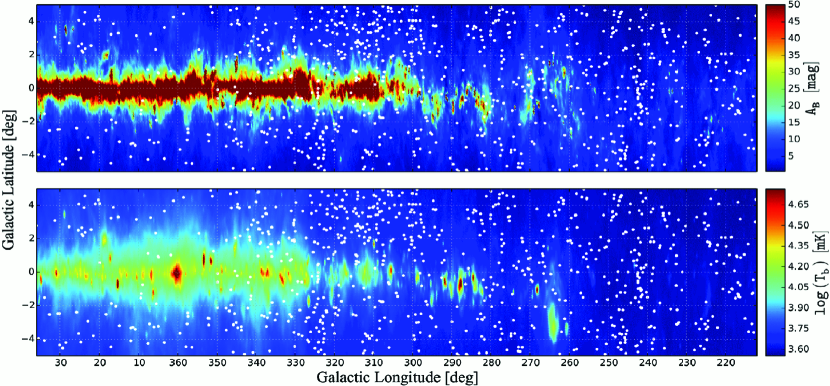
The 883 galaxies detected in HIZOA-S are overlaid on an image of the Galactic continuum background made from the same multibeam data by Calabretta, Staveley-Smith & Barnes (2014) in Fig. 7, bottom panel. The anti-correlation between Galactic continuum and galaxy detection is noticeable for , although note that the Local Void (§7) results in reduced galaxy density at all latitudes for . Figure 7 also shows the correlation with dust extinction (top panel). Although a broadly similar anti-correlation at is evident, a detailed comparison shows that galaxies can be detected at all optical extinctions (including mag) as long as the Galactic foreground temperature is K. More quantitatively, the detection rate as a function of Galactic latitude is plotted in Fig. 8. A deficit in detections is apparent outside the nominal latitude range and at . The latter deficit is much more striking near the Galactic Center. The relative surface density of galaxies found at increasing continuum temperature and optical extinction is shown in Fig. 9. The anti-correlation with continuum is much tighter than for extinction, with % detectability for K, decreasing to 50% at 10 K and to almost zero at K, although the latter represents only 1.9% of the area surveyed. As with HIZOA-N, the reason for the low detectability in regions of bright continuum is mainly the increased baseline ripple and higher system temperature. Very little of the Galactic Plane is optically thick at 1.4 GHz.
The significant numbers of galaxies detected in this survey allow a more detailed characterisation of completeness than made by Donley et al. (2005). We use the technique of Rauzy (2001), which is a modified test. This has previously been used for H I surveys alongside false-source injection techniques by Zwaan et al. (2004) for HIPASS and Hoppmann et al. (2015) for the Arecibo Ultra Deep Survey (AUDS), and has been shown to be a robust alternative. Its main advantage is that, compared with source counts (e.g., Fig. 6), it is insensitive to large-scale structure, which is considerable in the southern ZOA. Disadvantages are: (a) it does not allow the characterisation of a ‘soft’ rolloff in completeness; and (b) the method assumes no substantial variation in the shape of the H I mass function with position, e.g., as a function of environment. Evolutionary effects (Rauzy 2001) and bright limits (Johnston, Teodoro & Hendry 2007) can be incorporated, but are unnecessary for this analysis.
| Parameter | Limit | Limit | |||
|---|---|---|---|---|---|
| Flux integral, | 3.1 Jy km s-1 | 0.75 | 3.3 Jy km s-1 | 0.72 | |
| Mean flux density, | 21 mJy | 0.81 | 22 mJy | 0.74 | |
| km s-1 | 2.8 Jy km s-1 | 0.92 | 2.9 Jy km s-1 | 0.90 | |
| km s-1 | 17 mJy | 0.91 | 18 mJy | 0.90 | |

Results of the Rauzy test are presented in Table 4 and Fig. 10. For regions within the main survey area (, ) and K, the completeness limits are Jy km s-1 for flux integral and mJy for mean flux density. The Rauzy test indicates that there is only 0.6% probability that the actual completeness limits are fainter than this. The mean flux density limit (defined here as the ratio of flux integral, , to the velocity width prior to resolution correction, ) is satisfactorily similar to the value of 22 mJy deduced by Donley et al. (2005). However, Fig. 10 shows that the flux-integral completeness starts to reduce below 100% well above the formal completeness limit. To a lesser extent, the mean flux density completeness also rolls off. The reason for this is that, as shown in previous blind H I surveys, completeness is a function of both flux and velocity width. This is illustrated in Fig. 11 where galaxies of a given flux integral are clearly easier to detect at fainter limits when they have a narrow linewidth, . Conversely, galaxies of a given mean flux density are easier to detect when they have a large linewidth.

The radiometer equation suggests that the flux integral selection limit should scale as , with . Conversely, the flux density selection limit should scale approximately as . However, the well-known effect of baseline ripple makes high velocity width galaxies harder to detect in practice. At Parkes, the primary ripple wavelength corresponds to 1,200 km s-1. Figure 11 shows that a more appropriate index is , where the selection limit is characterised for flux integral by km s-1 and for mean flux density by km s-1. With this scaling, much tighter selection limits of Jy km s-1 and mJy are obtained. At a velocity width of 50 km s-1, this corresponds to flux integral and flux density limits of 1.2 Jy km s-1 and 24 mJy, respectively. At a velocity width of 350 km s-1, this corresponds to flux integral and flux density limits of 5.0 Jy km s-1 and 14 mJy, respectively. Thus defined, 92% of the sample is brighter than the hybrid selection limit, compared with only 75% and 81% for pure flux and flux density-limited samples, respectively. Additional dependencies, such as with profile shape (Zwaan et al. 2004), are small for the hybrid limit.
6.2 Comparison with other H I catalogs
Two subsamples of the data presented here had been previously analysed: Henning et al. (2000) published 110 bright H I detections based on 8% of the full integration time and Juraszek et al. (2000) published 42 H I detections in the GA region based on 16% of the full integration time. All of these detections were recovered. The only H I detection with a large positional offset compared to the previous publications () is J1616-55 which is an extended, multi-component object described in detail in Staveley-Smith et al. (1998) (cf. note in Appendix A).
As is normal between adjacent cubes, there is a -overlap around and between this catalog and its extension to the north, HIZOA-N (Donley et al. 2005). The two catalogs have three galaxies in common. A further detection, found by us at , is technically part of HIZOA-N but was missed there.
We compared our detections with HIPASS, which is an independent survey of the southern hemisphere (Meyer et al. 2004; hereafter HIPASS-South), and its extension to the north (Wong et al. 2006; hereafter HIPASS-North) at 20% of our integration time. There are 251 detections in common, only one of which is listed in HIPASS-North (J0705+02). One HIPASS detection is confused (J1000-58) and was resolved into two detections in our deeper survey. An additional two detections each are recorded in publications based on older versions of the HIPASS catalog, namely Kilborn et al. (2002) and Ryan-Weber et al. (2002).
| HIPASS | Gal | SNR | Note | Comment | |
|---|---|---|---|---|---|
| J081745 | -5.59 | 9.2 | 1 | real | below the acceptance limit (noisy area at the edge) |
| J084438 | 2.45 | 4.6 | 2 | not real | |
| J085741 | 2.55 | 4.5 | 2 | not real | |
| J102651 | 5.09 | 6.2 | 1 | real | below the acceptance limit (bad baseline at the edge) |
| J123268 | -5.38 | 5.4 | 1 | real | below the acceptance limit (noisy area at the edge) |
| J141265 | -4.09 | 132.4 | 1 | not real | part of Circinus |
| J141863 | -2.19 | 3.3 | 2 | not real | |
| J143954 | 5.28 | 6.0 | 1 | real | below the acceptance limit (faintly visible at edge) |
| J144053 | 5.58 | 7.8 | 1 | real | below the acceptance limit (visible at edge) |
| J144453 | 5.38 | 4.5 | 2 | not real | |
| J151658 | -0.50 | 3.5 | 2 | not real | |
| J160052 | 0.48 | 4.2 | 2 | not real | |
| J162447 | 1.42 | 4.0 | 1 | not real | |
| J165549 | -3.99 | 4.4 | 2 | not real | |
| J164237 | 5.66 | 6.3 | 1 | real | below the acceptance limit (visible at edge) |
| J170837 | 1.35 | 8.0 | 1 | not real | likely RFI |
| J174037 | -3.80 | 7.9 | 1 | not real | likely RFI |
| J171333 | 2.94 | 9.2 | 1 | not real | likely RFI |
| J171827 | 5.62 | 6.4 | 1 | real | below the acceptance limit (faintly visible at edge) |
| J174321 | 4.09 | 5.9 | 1 | real | below the acceptance limit |
| J182316 | -1.44 | 5.4 | 1 | not real | likely RFI |
| J182809 | 0.82 | 4.0 | 1 | not real | |
| J181704 | 5.75 | 4.6 | 1 | not real |
aHIPASS quality flag: = ‘real’, = ‘have concerns’.
There are a further 23 galaxies (all in HIPASS-South) that were not detected in HIZOA-S, see Table 5. On closer inspection, we find 8 detections likely to be real, of which four were detected in the visual searches but lie below our limit for inclusion (usually due to locally high rms), while the other four are located near the edge of a cube and were thus missed due to the higher noise (though they were also below our acceptance limit).
Of the 15 HIPASS detections considered not to be real, seven were labeled in the HIPASS catalog as ‘have concerns’ (quality flag ), all of which have low SNR (); they could not be confirmed in our cubes. Three further detections with have similarly low SNR and could not be confirmed by us either. One HIPASS detection (J141265) forms part of Circinus (our J141365 detection). The remaining four detections seem to be caused by RFI: they are narrow peaks with high SNR in the HIPASS spectra, but nothing is evident in the HIZOA cubes.
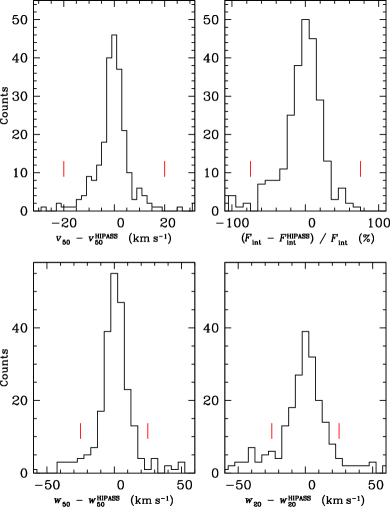
In Fig. 12 we compare the parameters of the 254 detections in common (excluding J100058). For HIPASS we use their width-maximised , and . Note that not all objects have an entry for these parameters, while our catalog also misses some of the parameters. Outliers are generally due to two reasons: (i) confused or lopsided profiles (all extreme cases fall into this category) and (ii) noisy profiles or profiles affected by a poor baseline. Table 6 gives the mean and standard deviations of the ‘core’ of the histograms shown in Fig. 12 (indicated with red vertical bars). In summary, we see no statistically significant systematic effects.
| Parameter | Cut | Mean | Std dev | |
|---|---|---|---|---|
| 20 km s-1 | 227 | km s-1 | 5.6 km s-1 | |
| Flux integral, | 75% | 246 | % | 23.8% |
| 25 km s-1 | 214 | km s-1 | 8.8 km s-1 | |
| 25 km s-1 | 179 | km s-1 | 9.9 km s-1 |
We have also compared our detections with the deeper, pointed Parkes survey of southern ZOA galaxies by Kraan-Korteweg et al. (2002) and Schröder et al. (2009) which has a typical rms of mJy (hereafter referred to as PKS sample). We have 39 detections in common. In six cases the ID given in the PKS sample seems to be mis-judged (J122257, J133758B (confused profile), J140565, J155058, J155361, J161256; see Appendix A for details), which is mostly due to off-beam detections in the high galaxy density area in the GA region. The 23 detections in the PKS sample not recovered by us are usually below the HIZOA sensitivity limit or lie near the edge of our survey area and are thus lost in the noise (). Three PKS detections were detected in our visual searches but were just under the acceptance limit.
A comparison of parameters gives similar values of mean and scatter as for HIPASS though with larger uncertainties due to the smaller number of samples. Outliers are due to confused profiles () or low SNR/baseline variations ().
We have also used HyperLEDA to extract all galaxies with H I velocities within our survey region. Next to the HIPASS and PKS detections discussed above, there are 39 H I detections not detected by us. Of these, 31 are too faint or too close to the survey limits to be detectable by us. Four of these detections were found in the visual searches of the HIZOA cubes, but were under the acceptance limit. Two detections seem to be off-beam detections of one of our detections: (i) J080627 was attributed to PGC022808 by Matthews & Gallagher (1996); and (ii) J074926B was correctly attributed to CGMW 2-1330 by Matthews et al. (1995), but with the wrong coordinates (that is, it was cross-matched with PGC100722 in HyperLEDA). Two bright detections (with Jy km s-1) could not be confirmed by us: ESO494-013 (reported by Kraan-Korteweg & Huchtmeier (1992) and which we detected as J080222 at a different velocity) and PGC2815809 (Huchtmeier et al. 2001); they are both detections with the Effelsberg Radio Telescope and possibly RFI.
6.3 Reliability
Within the boundaries of the full-sensitivity survey and the source detection adjudication process (§3), the sample is expected to be nearly 100% reliable (cf. Donley et al. 2005). The high reliability was ensured by a reasonably high cut-off in signal-to-noise ratio. No marginal detections were included in the catalog, though follow-up observations are planned to confirm some of these.
We have conducted two checks on the reliability:
(i) Of 56 detections in the overlap regions between adjacent cubes, only two were not detected in both cubes: J1847+04 belongs nominally to the northern extension, and J081833 is faint and was not recognised in one cube due to large baseline variations near the edge of the cube.
(ii) We have cross-checked our detections with the non-detections in the deeper (but pointed) Parkes survey of optically-selected galaxies in the southern ZOA by Kraan-Korteweg et al. (2002) and Schröder et al. (2009) and found no false positives (with the caveat that a pointed survey has a different selection function than a blind survey).
7 Large-Scale Structure
In this section we investigate the large-scale distribution of the galaxies detected in this survey and discuss newly identified structures in the context of known large-scale structures in the immediate vicinity. For the latter we use publicly available data archives like HyperLEDA (Paturel et al. 2003) and, for some discussion, the 2MASS Redshift Survey (2MRS; Huchra et al. 2012). We combine our survey with the northern extension (HIZOA-N; Donley et al. 2005). That survey was observed with the same telescope using an identical strategy and analysed in exactly the same manner by the same team. The structures identified in HIZOA-N (two fields) can be better appreciated by combining with the current HIZOA-S catalog. The combined HIZOA survey data cover the Galactic longitude range () for the latitude range of (see Fig. 13).
Duplicates from overlap regions in the two surveys were eliminated. As discussed in §6.2, three galaxies were published in Donley et al. (2005) but nominally belong in the current HIZOA-S catalog, while there was one galaxy identified in the HIZOA-S cubes that technically belongs in HIZOA-N but was not listed there. This means that the total number of galaxies in the merged list sums to rather than ().
For the large-scale structure discussion, all HIZOA galaxies will be used. Note though that 62 galaxies lie just beyond the nominal latitude limit () and a further one outside the longitude limit. The total number in the full-sensitivity survey area, away from the edges, is therefore galaxies which translates to an average density of 0.41 galaxies per square degree for the nominal survey area of 2160 deg2.
7.1 2D and redshift distributions of the HIZOA galaxies
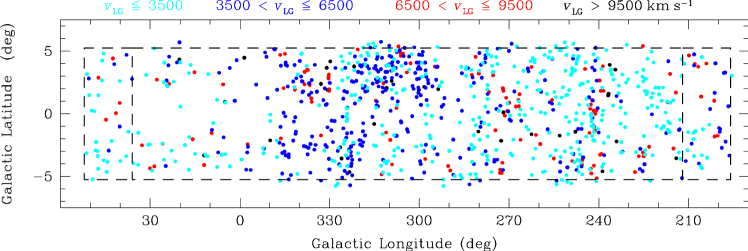
Figure 13 displays the distribution around the Galactic Plane of the 957 galaxies detected in the HIZOA survey. The survey areas are marked by the dashed line. The 63 galaxies that lie just beyond the nominal survey borders are easily identifiable. The resulting galaxy distribution shows remarkable substructures. These stand out even when ignoring the color-coding of the dots that symbolises different redshift ranges (cyan: km s-1; blue: km s-1; red: km s-1; black: km s-1). The right-hand part of the plot shows a fairly smooth distribution of galaxies with an inkling of a filamentary feature crossing the Plane vertically in Puppis at about . This part has an average detection rate (0.44 deg-2), similar to the mean of the survey. The middle part shows a clear density enhancement (0.6 deg-2) which is associated with the Great Attractor (GA), whereas the left part, centered around the Galactic Bulge, has few galaxies particularly at the lowest latitudes. The density of the detections is about half of that in the Puppis region, and a third of that in the GA region. This is mostly due to the dominance of the Local Void (LV; Tully & Fisher 1987; Kraan-Korteweg et al. 2005) rather than a bias due to its location behind the Galactic Bulge. As discussed in §6, there is no dependence of the detection rate on foreground extinction levels, and only a minor reduction where the brightness temperature is elevated ( K). Only a small part of the survey area, generally limited to , has a higher detection threshold (cf. Figs. 7 and 9).
The variation of the detection rate is not the only systematic apparent in Fig. 13. The mean redshifts also show a striking difference as a function of longitude. The general Puppis area is dominated by nearby structures (cyan). The area centered on the GA is dominated by higher velocities (dark blue), particularly for longitudes of (). The few galaxies uncovered at are mainly nearby but with some at higher redshift (red and black), suggestive of being at the far side of the LV.
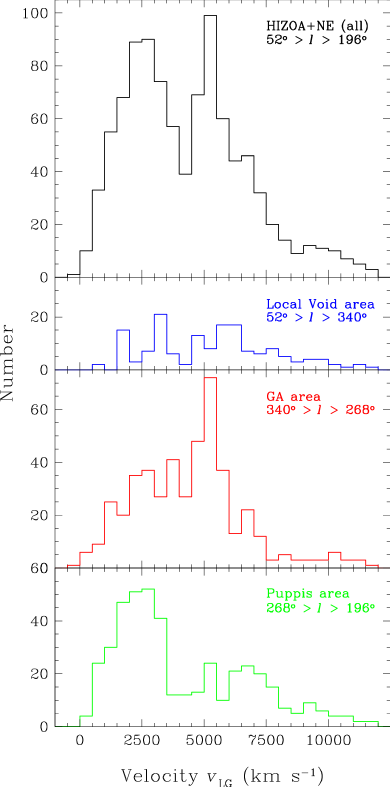
This can be better appreciated in Fig. 14 which shows the overall velocity histogram (top panel), together with three velocity histograms subdivided in longitude ranges of width each. The histogram of the whole survey displays a fairly steep rise up to velocities of about 3000 km s-1 followed by a gradual drop-off towards the highest velocities which is consistent with expectations from the loss of sensitivity at higher redshifts. A distinct peak around 5000 km s-1 superimposed on the gradual drop-off is due to the GA overdensity (see 3rd panel). Note that galaxies are found all the way out to the velocity limit of the survey, and thus probe the local volume considerably deeper than HIPASS (Meyer et al. 2004).
In the second panel, the LV clearly dominates. There are very few galaxies up to about 4500 km s-1, and only one below 1500 km s-1. A broad peak ranging from about km s-1 seems to demarcate the right-hand side of the boundary of the LV (; see Fig. 15) as well as the far side of the LV (see also Figs. 15 and 16). A more detailed discussion on the extent of the LV can be found in Kraan-Korteweg et al. (2008), including preliminary data from an extension of the deep Parkes multibeam H I survey to higher latitudes around the Galactic Bulge. At higher velocities the numbers drop down to extremely low levels again, indicative of a further underdense region behind the LV, which probably is quite extended on the sky, because it is visible also in the third panel.
The third panel with its strong peak at about 5000 km s-1 is clearly dominated by the Norma supercluster (Woudt & Kraan-Korteweg 2000; Woudt et al. 2004; Radburn et al. 2006). At lower velocities the numbers are also elevated. This can be explained by the nearer filament that crosses the plane at about 3000 km s-1 and links up with the Centaurus clusters at higher latitudes. The number counts at higher redshifts are particularly low, and the Norma overdensity seems well separated from other structures. This is not unexpected for a cosmic web-like Universe where underdense region are surrounded by wall-like structures.
The bottom panel is dominated by low-velocity galaxies ( km s-1). They form part of the quite distinct and much larger filament that crosses the Plane in Puppis. It will be discussed in more detail in Fig. 16 which merges the new detections with known features beyond the ZOA. The slight overdensity around 7500 km s-1 is real and seems suggestive of a more distant filament, one that has already been highlighted as such in early ZOA H I work by Chamaraux & Masnou (2004).
7.2 New large-scale structures and their connectivity
In the following we give a qualitative description of new structures detected in HIZOA, and how they link and contribute to known structures based on the finalised H I data set. A few results have been previously presented based on preliminary catalogs (e.g., Kraan-Korteweg, 2005, Kraan-Korteweg et al. 2005; Henning et al. 2005). A more quantitative analysis will be given in a subsequent paper; also included will be: (a) the further extension of the Parkes ZOA surveys to higher latitudes around the Galactic Bulge ( for the longitude range , reaching up to higher positive latitudes () for ), where both the deep optical and near-infrared 2MASS surveys fail at identifying galaxies due to stellar crowding; and (b) near-infrared counterparts of all HIZOA galaxies based on a systematic deep near-infrared () follow-up imaging observations (Williams et al. 2014, Said et al. in prep.).
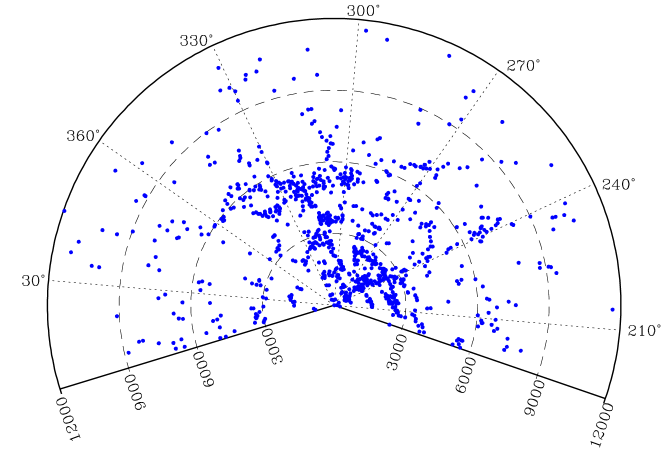
We investigate the large-scale structures by examining the redshift cone defined by the HIZOA galaxies (Fig. 15), and we will refer to on-sky distributions for various redshift intervals at the same time (Fig. 16).
Figure 15 presents a redshift wedge with the HIZOA galaxies. The width of the wedge corresponds to the HIZOA survey width and includes all galaxies detected up to , the most opaque part of the Milky Way. It traces the structures along its full longitude range out to the velocity limit of km s-1. Hardly any of these galaxies were known before the HIZOA survey, apart from a handful of galaxies in the Puppis area where the dust column density is particularly low. The high efficiency of tracing large-scale structures with systematic H I surveys without hindrance by the foreground “pollution” of our Milky Way – which biases most other multi-wavelength surveys (e.g., Kraan-Korteweg & Lahav 2000) – is clearly demonstrated.
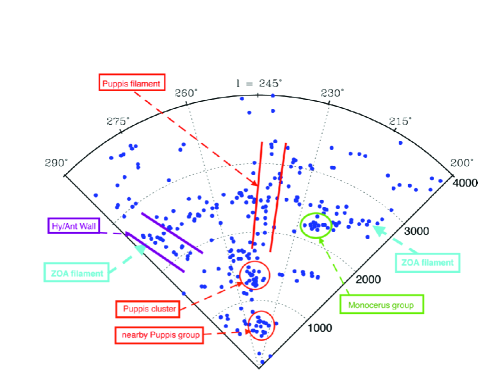
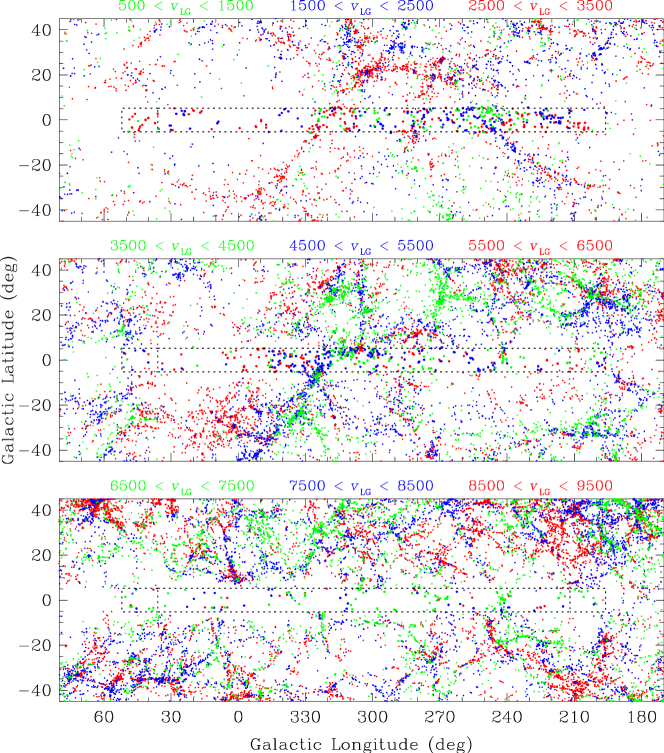
Figure 16 shows on-sky distributions in Galactic coordinates centered on the southern Galactic Plane. The H I-detected galaxies are plotted together with galaxies surrounding the ZOA using redshifts extracted from HyperLEDA141414http://leda.univ-lyon1.fr/ (Paturel et al. 2003) for the Galactic latitude range of to allow the interpretation of the newly revealed features in context with known large-scale structures. It should be emphasised that the merged samples are very differently selected. The HyperLEDA sample contains redshifts purely based on their availability in the literature and thus does not provide homogenous coverage. It also contains both radio and optically determined redshifts. Restricting the data to H I redshifts only results in an extremely shallow coverage – except for the Arecibo declination range – showing again the urgent need for the forthcoming SKA Pathfinder H I surveys. Another comparison sample could have been the 2MRS (Huchra et al. 2012) which is uniform and all-sky down to latitudes of . However, the H I and NIR selected surveys favor vastly different populations, gas-rich bluish versus early-type red galaxies, which leads to vastly different selection functions. The HIZOA galaxies are densest at low velocities because HIZOA is so sensitive to gas-rich nearby dwarfs which 2MRS does not easily detect, whereas the 2MRS numbers steeply rise with redshift and the balance shifts rapidly. We hence prefer to use the HyperLEDA data sample to display the connectivity of structure across the Milky Way, because it overall it provides the deepest data set, hence the optimal source to delineate structure: voids remain empty if real, and filaments will only appear more pronounced when sampled more deeply.
The panels in Fig. 16 show three contiguous shells in velocity space, each of width of 3000 km s-1. Colors indicate finer redshift intervals within each panel. This figure also demonstrates quite clearly how well the inner of the ZOA has been filled by the HIZOA survey ( and redshifts from top to bottom respectively). The last shell out to the velocity limit of the survey is not plotted here. Due to the low sensitivity in that redshift interval the detection rate is too low (; see also Fig. 14) to add much insight into larger structures; their distribution can be inspected in the redshift slice (Fig. 15).
As before, we will focus on the three areas separately that are dominated by quite different large-scale structures, i.e., Puppis, GA and LV.
7.2.1 The Puppis region
The righthand side of Fig. 15 is quite crowded, particularly at the low velocity range in the Puppis region (). For a better visualisation of these quite nearby structures we show a zoom-in version of the redshift slice in Fig. 17. A nearby group and a slightly more distant small cluster at 700 and 1400 km s-1, respectively, dubbed the Puppis 1 group and the Puppis 2 cluster, stand out. Both were found already in 1992 by Kraan-Korteweg & Huchtmeier through H I follow-up observations of optically visible galaxies in this area of low foreground extinction. Due to their proximity, both of these galaxy concentrations were also identified and described in the shallow survey (Henning et al. 2000) and in the H I Bright Galaxy Catalog (Koribalski et al. 2004). At slightly higher redshifts we note the Puppis filament. There is a third concentration (not marked by a circle) at slightly higher longitudes and redshifts ( km s-1), but it does not stand out as a group in three dimensions. Between 2000 and 3000 km s-1 we see a surprisingly narrow filament (henceforth referred to as the ZOA filament) that can be traced along the full longitude range of the Puppis wedge. It is well separated from other structures apart from where this filament crosses the Puppis filament () and the Hydra Wall (). The Monocerus group (; marked as green oval) was identified in Donley et al. (2005). They suggested that the group might form part of the very narrow ZOA filament (see Fig. 16). A closer look at the Puppis cone presented here (Fig. 17) does, however, not entirely support this because they are distinct in redshift space.
The Puppis filament itself is a highly interesting feature; it is part of a very extended structure and can be traced over most of the southern sky (see top panel of Fig. 16). From far below the Galactic Plane ( km s-1), it extends towards the ZOA around Puppis () crossing at slightly lower redshifts. From there it continues and connects with Antlia ( km s-1). It continues across Antlia towards the Centaurus cluster ( km s-1) and then folds back crossing the Milky Way once more – this second crossing lies just in front of the Great Wall or Norma Wall crossing discussed in the next section. The filament traces a near-perfect sinewave-like structure in this projection, while in an equatorial projection it appears more circular. Its three-dimensional shape seems to be to be a long, straight filament. Interesting though is the length over which the filament is contiguous across the sky (), certainly in comparison to its narrow width. At a mean redshift of km s-1 this translates to about Mpc. Although interspersed with numerous galaxy groups, the filament is only about (Mpc) wide, very different compared to the very broad, foam-like Norma Wall structure.
Various other filaments seem to intersect with the Puppis filament. The most prominent is a filamentary connection emanating from the Hydra cluster ( km s-1) towards Antlia (where it crosses the Puppis filament), from where it moves downwards in Fig. 16, crossing the Plane at about . This continuation to latitudes of about was surmised early on by Kraan-Korteweg (1989) and Kraan-Korteweg et al. (1995) and now is substantiated with the present data set. The signature of the crossing is prominent, too, in Fig. 17. It is conceivable that the Monocerus group () lines up with Antlia as well, but the sparsity of data in the Galactic latitude range between and precludes such a confirmation.
At higher redshifts (Fig. 15) we see a further indication of a possible cluster (Puppis 3) at about ( km s-1). It is very prominent in the middle and bottom panels of the sky distributions, and appears to be embedded in a filamentary structure within the survey area. This overdensity is also picked up by Chamaraux & Masnou (2004) in their analysis of the Puppis Wall. They claim the existence of a large void between the Puppis Wall and this galaxy agglomeration. However, this is not evident from the figures presented here which show numerous galaxies in between these redshift ranges (see Fig.15). Furthermore, the clumping or filament at about 7000 km s-1 seems to be located in the middle of a large underdense region of an extent of nearly .
7.2.2 The Great Attractor region
Overall, the large-scale structures revealed by the H I detections in Fig. 15 are clearly dominated by the GA, also referred to as the Norma Wall or the Norma supercluster (Kraan-Korteweg et al. 1994; Woudt et al. 1999, 2004; Radburn-Smith et al. 2006; Jarrett et al. 2007; Kraan-Korteweg et al. 2011). The Norma Wall is centered on the Norma cluster, ACO 3627 (Abell, Corwin & Olowin 1989), which has been identified as the most massive cluster in the GA region (Kraan-Korteweg et al. 1996; Woudt et al. 2008). However, the Norma cluster itself ( km s-1) lies just outside the boundaries of our HIZOA survey. The Norma Wall crosses the ZOA diagonally – from the Norma Cluster to the CIZA and Cen-Crux clusters on the opposite side of the ZOA (discussed below). The HIZOA survey traces some of its previously partly, or fully, obscured components in more detail, and has uncovered further galaxy concentrations that form part of the Norma supercluster, adding to the general overdensity in this part of the sky. A zoom-in redshift cone of the GA region is presented in Fig. 18.
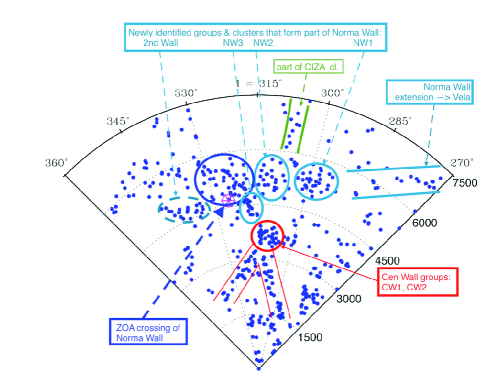
In this plot, the Norma Wall seems to stretch from to , lying always just below the 6000 km s-1 circle. Indeed, Woudt et al. (2004, 2008) have shown that both the Norma cluster and the wall in which it is embedded are well separated in space from other structures. At the lower longitudes a weak extension towards Vela () can be seen – marked as Norma Wall extension. The latter is more pronounced at higher latitudes (see middle panel of Fig. 16).
This Norma Wall is made up of various agglomerations. We will discuss them one by one, from left to right, respectively, high to low longitudes. Note that the galaxies around 6000 km s-1 and longitudes of are not part of the Norma Wall. They might form part of the outer boundary of the LV though. The agglomeration around , denoted as the Wall, is identified for the first time. It is marked with dashed lines because it is unclear whether this galaxy concentration extends above latitudes of , due to the overall high extinction and star density this close to the Galactic Bulge. The on-sky distribution seems to hint at a further wall parallel to the Centaurus Wall but at higher longitudes (see middle panel of Fig.16). The Galactic Bulge extension data, which will provide further H I detections up to higher latitudes around km s-1), might shed further light on this. Nevertheless, this galaxy concentration is a further contributor to the mass overdensity in this part of the sky.
ZOA crossing of the Norma Wall:
The largest clump (marked in dark blue) contains galaxies that start at the outer fringes of the Norma cluster, A3627 at ( km s-1) (Woudt et al. 2008), and extends diagonally across the ZOA (see also middle panel of Fig. 16). A small cluster, marked as NW3, has been identified for the first time within the Norma Wall. NW3 lies deep in the ZOA at ( km s-1). At higher positive latitudes, the Norma Wall then encompasses two further condensations, NW2 and NW1 ( and ), which may be groups (or small clusters). None of these were previously known. Both are located at and quite distinct in Fig. 16 (middle panel). In between these two groups, a short Finger of God is evident at slightly higher redshifts ( km s-1). This is due to galaxies in the outskirts of Centaurus-Crux/CIZA J 1324.75736 cluster, discovered independently by (i) Fairall, Woudt & Kraan-Korteweg (1998), Woudt & Kraan-Korteweg (2001), and Woudt et al. (2004) from deep optical galaxy searches and systematic redshift follow-ups, and (ii) Ebeling et al. (2002; 2005) and Mullis et al. (2005) in their search for X-ray clusters in the Zone of Avoidance. This cluster is the second most massive cluster within the Norma Wall, and has about % of the mass of the Norma cluster (Radburn-Smith et al. 2006). From the CIZA cluster, the Norma Wall continues to higher latitudes and velocities (its lower latitude part is still visible in the wedge) where it connects to the cluster in Vela, Abell S0639 at ( km s-1) (Stein 1997).
Centaurus Wall groups:
Apart from new groups and clusters that form part of the GA overdensity, other significant new structures are identified at lower redshifts. Notable is the cluster CW2 centered at about ( km s-1) which is massive enough to display a small Finger of God. To the right of this (within the same red circle), a possible group of galaxies CW1 is visible at about ( km s-1). They lie in front of the GA Wall and form part of the Centaurus Wall, a much narrower wall that lines up with the Centaurus cluster ( km s-1). The clumps form part of the sine-wave feature (top panel of Fig. 16). Two nearby filaments are also marked. They appear to point to the newly identified groups/clusters (marked by red lines), i.e., the one that approaches the cluster CW2 from the left at lower velocities is part of the sine-wave ZOA crossing visible in the on-sky projection at those longitudes (). The other filament pointing towards the CW1 and CW2 clumps from the right (lower longitudes) is more difficult to discern in the on-sky distribution because it is cut into two parts by redshift division between the top and middle panel.
The PKS 1343601 cluster:
What is not very prominent in the HIZOA detections is the cluster around the strong radio source PKS 1343601, also known as Cen B. Because the presence of a strong radio source often is indicative of a massive cluster, there was previous speculation (Kraan-Korteweg & Woudt 1999) whether a further dominant cluster that forms part of the Norma supercluster could have escaped detection due to its location at very low latitudes (, and high extinction (; Schlafly & Finkbeiner 2011). However, various deep near-infrared studies of the cluster (Nagayama et al. 2004, Schröder et al. 2007), as well as a careful investigation of its X-ray-flux by Ebeling et al. (2005) do not support this hypothesis. The PKS 1343601 cluster seems to be an intermediate size cluster, and forms part of the GA overdensity. We find some galaxies in that general area and velocity, but not many. The strong radio continuum emission of Cen B (79 Jy at 1410 MHz; Wright & Otrupcek 1990) suppresses galaxy detection in its immediate vicinity, but does not explain the absence of galaxies in our survey. It is possible that CW1, at only slightly higher latitude, is connected to or is part of this cluster.
Next to the Norma cluster, and the Centaurus-Crux cluster no further X-ray emission has been found that could point to the existence of a further massive cluster within the Norma Wall. However X-rays are subject to photoelectric absorption by Galactic gas and confusion with Galactic sources, which limits detection close to the Galactic Plane. Nevertheless, apart from the Norma and Centaurus Wall groups and clusters (NW1, NW2, NW3, CW1 and CW2), there is no evidence from the current H I survey, or previous surveys at other wavelengths, for further massive concentrations of galaxies within the Norma Wall.
7.2.3 The Local Void region
The left third of the HIZOA redshift slice (Fig. 15) is dominated by the LV. Both Figs. 15 & 16 indicate that the LV under-density appears to extend in the range of about for radial velocities km s-1, consistent with Tully’s early definition (Tully & Fisher 1987). The left-hand boundary had been uncovered in HIZOA-N (Donley et al. 2005). The on-sky projections suggest that the LV is quite symmetric around the Galactic Plane reaching up to latitudes of about on either side. It is thus quite a formidable structure in the nearby Universe. However, both the wedge and certainly the on-sky projection indicate that the LV is not nearly as empty as the previously available data suggest. The reason is that a large fraction of the LV is located behind the Galactic Bulge (GB) where dust extinction and star confusion reach much higher latitudes and the optical and NIR ZOA are substantially wider. The current HIZOA data alone do not reach high enough Galactic latitudes to bridge the gap. It is for this reason that the above mentioned GB-extension of HIZOA was launched. The GB-extension will improve the knowledge of the borders of the LV and Sagittarius Void ( km s-1; Fairall 1998), as well as the Ophiuchus cluster ( km s-1) studied optically and spectroscopically by Hasegawa et al. (2000), and Wakamatsu et al. (2005).
The galaxies detected in the LV predominantly seem to be low-mass (gas-rich) dwarf galaxies. This was also confirmed in a preliminary analysis of the GB extension (Kraan-Korteweg et al. 2008) which reveals some quite fine filaments, sparsely populated with low-mass galaxies, that permeate the LV. They probably are similar structures to what has been dubbed tendrils by Alpaslan et al. (2014) in the analysis of large-scale structures in GAMA. The LV population will be studied in more detail in a forthcoming paper.
8 Conclusions
We have presented data from a deep H I survey (HIZOA-S) with the multibeam receiver on the Parkes telescope in the southern ‘Zone of Avoidance’. The region covered (; ) includes the highest obscuration for optical/IR observations and, near the Galactic Center, the highest stellar crowding. Of the 883 HIZOA-S galaxies detected, only 8% have existing optical redshifts. Nevertheless, on careful inspection of new and existing images and data sources, 78% of the detections have a counterpart visible in either the optical or the near-IR wavebands. A third of these have not been previously cataloged. The median distance between the H I position and the counterpart is (95% of counterparts have ), while the FWHP beam size is . For detected galaxies with low H I masses which are in areas of high extinction, we have mostly been unable to find counterparts.
The survey (with an average rms of 6 mJy) is 2–3 times deeper than HIPASS (Meyer et al. 2004). To suppress ringing from strong Galactic H I and recombination line emission, spectra have been Hanning-smoothed, so the velocity resolution is 50% poorer (27 km s-1). For the 251 brighter galaxies in common, the derived H I parameters (velocity, width and flux) for HIPASS and HIZOA-S are in excellent agreement.
| Name | Description | |||
|---|---|---|---|---|
| km s-1 | ||||
| Pup 1 group | loose group | |||
| Pup 2 cluster | dense group | |||
| Pup 3 cluster | cluster | |||
| Monoceros group | elongated loose group | |||
| ZOA filament | lengthy filament with small dispersion | |||
| NW1 | NW galaxy concentration | |||
| NW2 | NW galaxy concentration | |||
| NW3 | new NW cluster | |||
| Wall | possible new wall | |||
| CW1 | new CW loose group | |||
| CW2 | new CW cluster |
The completeness as a function of Galactic background, flux and velocity width for the HIZOA-S catalog has been characterised in a manner that is independent of assumptions of homogeneity. This allows HIZOA-S to be used for quantitative study of the ZOA density field. The flux completeness limit for the main survey region (excluding edges) and at Galactic continuum temperatures K, is 2.8 Jy km s-1 at the mean sample velocity width of 160 km s-1. This corresponds to a mean flux density limit of 17 mJy. The flux integral and flux density completeness limits scale as and , respectively; i.e., galaxies with narrow widths can be found at lower flux integrals and higher mean flux densities. There is some incompleteness at higher fluxes, but we also find 9% of HIZOA galaxies are detected at lower fluxes.
Several interesting new objects have been noted in HIZOA data and already published, including the nearby extended objects HIZOA J151452, J153256 and J161655 (Staveley-Smith et al. 1998), the new nearby galaxy HIZSS 003 (Henning et al. 2000, Massey, Henning & Kraan-Korteweg 2003, Begum et al. 2005), the fast rotator J141658 (Juraszek et al. 2000) and the massive J0836
43 galaxy (Donley et al. 2006; Cluver et al. 2008, 2010). Notably no new nearby, massive galaxies similar to Circinus have been discovered, and there is no further room in the ZOA for such an object to be hidden within the areas mapped so far. However, the new catalog does contain a new galaxy, HIZOA J135358, which seems to be a possible companion (and the only candidate found to date) for the Circinus galaxy.
The main new results identified in this paper are the groups and clusters discussed in §7. For clarity, these are summarized in Table 7. The HIZOA survey has clearly proved to be a highly successful approach in uncovering the large-scale structures in the ZOA most of which were previously unknown. This is particularly striking in the redshift cone in Fig. 15, which reveals large-scale structure within the deepest obscuration layer of the Milky Way, reminiscent of the redshift cone of the Coma cluster in the so-called Great Wall (de Lapparent et al. 1986). The main difference is that the main Norma cluster lies just beyond the borders of the HIZOA survey. The combination with known structures adjacent to the ZOA (Fig. 16) shows how many of the in H I-detected features link up. HIZOA has resulted in an improved census of the GA region and an improved understanding of the extent of the Norma supercluster. The diagonal crossing of the supercluster is well traced by the new data and has led to the identification of further galaxy concentrations that form part of the wall-like structure, such as the NW3 cluster deep in the plane, and the NW2 and NW1 complexes that connect to the Cen-Crux clusters that lie just at the border of this survey. Hence, the Norma Wall is now seen to extend from Pavo II to the Norma cluster, the NW3 cluster, the NW2, NW1, and the CIZA clusters to the Vela cluster. Also remarkable are the two nearer clusters that lie within the Centaurus Wall, that have filaments pointing towards them, very similar to the legs and body of the Great Wall ‘stickman’. We have also newly identified a potential second crossing at higher latitudes. Although not part of the Norma supercluster despite its redshift, this galaxy concentration also adds to the overall mass of the GA overdensity.
In the Puppis region, some of the unveiled clusters and groups have been seen in earlier H I-observations. However, what is confirmed is the earlier suspected Hy/Ant Wall, which can now be traced across the ZOA, as well as a full mapping of the Puppis filament, that forms part of the major sine-wave structure seen in the top panel of Fig. 16. A new discovery is the Monoceros group, and a filamentary feature at mostly constant redshift that runs within the ZOA for a longitude range of nearly 80 degrees.
HIZOA has also confirmed the large extent of the Local Void. Nevertheless, quite a few nearby galaxies have been found behind the Galactic Bulge, indicating that the void is not quite as empty as previously suggested.
These results bode well for the future with the forthcoming H I surveys that are planned with the SKA Pathfinders ASKAP (Wallaby) and WSRT/APERTIF. These surveys will together cover the whole sky and provide for the first time a deeper () and well-resolved complete census of the large-scale structures in the sky, inclusive of the Milky Way.
References
- (1)
- Acker et al. (1991) Acker, A., Stenholm, B., & Veron, P. 1991, A&AS, 87, 499
- Abell et al. (1989) Abell, G. O., Corwin, H. G., Jr., & Olowin, R. P. 1989, ApJS, 70, 1
- Alpaslan et al. (2014) Alpaslan, M., Robotham, A. S. G., Obreschkow, D., et al. 2014, MNRAS, 440, L106
- Alves et al. (2015) Alves, M. I. R., Calabretta, M., Davies, R. D., et al. 2015, MNRAS, 450, 2025
- Barnes et al. (2001) Barnes, D. G., Staveley-Smith, L., de Blok, W. J. G., et al. 2001, MNRAS, 322, 486
- Begum et al. (2005) Begum, A., Chengalur, J. N., Karachentsev, I. D., & Sharina, M. E. 2005, MNRAS, 359, L53
- Burenin et al. (2009) Burenin, R. A., Bikmaev, I. F., Revnivtsev, M. G., et al. 2009, Astronomy Letters, 35, 71
- Calabretta et al. (2014) Calabretta, M. R., Staveley-Smith, L., & Barnes, D. G. 2014, PASA, 31, e007
- Chamaraux et al. (1999) Chamaraux, P., Masnou, J.-L., Kazés, I., et al. 1999, MNRAS, 307, 236
- Chamaraux & Masnou (2004) Chamaraux, P., & Masnou, J.-L. 2004, MNRAS, 347, 541
- Cluver et al. (2008) Cluver, M. E., Jarrett, T. H., Appleton, P. N., et al. 2008, ApJ, 686, L17
- Cluver et al. (2010) Cluver, M. E., Jarrett, T. H., Kraan-Korteweg, R. C., et al. 2010, ApJ, 725, 1550
- Corwin et al. (1985) Corwin, H. G., de Vaucouleurs, A., & de Vaucouleurs, G. 1985, University of Texas Monographs in Astronomy, Austin: University of Texas, 1985,
- Courtois et al. (2012) Courtois, H. M., Hoffman, Y., Tully, R. B., & Gottlöber, S. 2012 ApJ, 774, 43
- de Lapparent et al. (1986) de Lapparent, V., Geller, M. J., & Huchra, J. P. 1986, ApJ, 302, L1
- Donley et al. (2005) Donley, J. L. Staveley-Smith, L., Kraan-Korteweg, R. C. et al. 2005, AJ, 129, 220
- Donley et al. (2006) Donley, J. L., Koribalski, B. S., Staveley-Smith, L., et al. 2006, MNRAS, 369, 1741
- Ebeling et al. (2002) Ebeling, H., Mullis, C. R., & Tully, R. B. 2002, ApJ, 580, 774
- Ebeling et al. (2005) Ebeling, H., Kocevski, D., Tully, R. B., & Mullis, C. R. 2005, Nearby Large-Scale Structures and the Zone of Avoidance, 329, 83
- Erdoǧdu et al. (2006) Erdoǧdu, P., Lahav, O., Huchra, J. P., et al. 2006, MNRAS, 373, 45
- Fairall (1980) Fairall, A. P. 1980, MNRAS, 192, 389
- (23) Fairall, A. P 1998, Large-scale structures in the universe (Wiley: Praxis), 1998
- Fairall et al. (1998) Fairall, A. P., Woudt, P. A., & Kraan-Korteweg, R. C. 1998, A&AS, 127, 463
- Gooch (1996) Gooch, R. 1996, Astronomical Data Analysis Software and Systems V, 101, 80
- Hasegawa et al. (2000) Hasegawa, T., Wakamatsu, K.-i., Malkan, M., et al. 2000, MNRAS, 316, 326
- Helou & Walker (1988) Helou, G., & Walker, D. W. 1988, Infrared astronomical satellite (IRAS) catalogs and atlases. Volume 7, p.1-265, 7,
- Henning et al. (2000) Henning, P. A., Staveley-Smith, L., Ekers, R. D., et al. 2000, AJ, 119, 2686 (HIZSS)
- Henning et al. (2005) Henning, P. A., Kraan-Korteweg, R. C., & Staveley-Smith, L. 2005, Nearby Large-Scale Structures and the Zone of Avoidance, 329, 199
- Henning et al. (2010) Henning, P. A., Springob, C. M., Minchin, R. F., et al. 2010, AJ, 139, 2130
- (31) Hoppmann, L., Staveley-Smith, L., Freudling, W., et al. 2015, MNRAS, 452, 3726
- Huchra et al. (2012) Huchra, J. P., Macri, L. M., Masters, K. L., et al. 2012, ApJS, 199, 26
- Huchtmeier et al. (2001) Huchtmeier, W. K., Karachentsev, I. D., & Karachentseva, V. E. 2001, A&A, 377, 801
- Jarrett et al. (2000) Jarrett, T. H., Chester, T., Cutri, R., et al. 2000, AJ, 119, 2498
- Jarrett et al. (2007) Jarrett, T. H., Koribalski, B. S., Kraan-Korteweg, R. C., et al. 2007, AJ, 133, 979
- Jarrett et al. (2011) Jarrett, T. H., Cohen, M., Masci, F., et al. 2011, ApJ, 735, 112
- Johnston et al. (2007) Johnston, S., Bailes, M., Bartel, N., et al. 2007, PASA, 24, 174
- Johnston et al. (2007) Johnston, R., Teodoro, L., & Hendry, M. 2007, MNRAS, 376, 1757
- Juraszek et al. (2000) Juraszek, S. J., Staveley-Smith, L., Kraan-Korteweg, R. C., et al. 2000, AJ, 119, 1627
- Kerr & Henning (1987) Kerr, F. J., & Henning, P. A. 1987, ApJ, 320, L99
- Kerp et al. (2011) Kerp, J., Winkel, B., Ben Bekhti, N., Flöer, L., & Kalberla, P. M. W. 2011, Astronomische Nachrichten, 332, 637
- Kilborn et al. (2002) Kilborn, V. A., Webster, R. L., Staveley-Smith, L., et al. 2002, AJ, 124, 690
- Koribalski et al. (2004) Koribalski, B. S., Staveley-Smith, L., Kilborn, V. A., et al. 2004, AJ, 128, 16
- Koribalski (2012) Koribalski, B. S. 2012, PASA, 29, 359
- Kraan-Korteweg (1989) Kraan-Korteweg, R. C. 1989, Astronomische Gesellschaft Abstract Series, 2, 54
- Kraan-Korteweg & Huchtmeier (1992) Kraan-Korteweg, R. C., & Huchtmeier, W. K. 1992, A&A, 266, 150
- Kraan-Korteweg et al. (1994) Kraan-Korteweg, R. C., Cayette, V., Balkowski, C., Fairall, A. P., & Henning, P. A. 1994, Unveiling Large-Scale Structures Behind the Milky Way, 67, 99
- Kraan-Korteweg & Woudt (1994) Kraan-Korteweg, R. C., & Woudt, P. A. 1994, Unveiling Large-Scale Structures Behind the Milky Way, 67, 89
- Kraan-Korteweg et al. (1995) Kraan-Korteweg, R. C., Fairall, A. P., & Balkowski, C. 1995, A&A, 297, 617
- Kraan-Korteweg et al. (1996) Kraan-Korteweg, R. C., Woudt, P. A., Cayatte, V., et al. 1996, Nature, 379, 519
- Kraan-Korteweg & Woudt (1999) Kraan-Korteweg, R. C., & Woudt, P. A. 1999, PASA, 16, 53
- Kraan-Korteweg (2000) Kraan-Korteweg, R. C. 2000, A&AS, 141, 123
- Kraan-Korteweg & Lahav (2000) Kraan-Korteweg, R. C., & Lahav, O. 2000, A&A Rev., 10, 211
- Kraan-Korteweg et al. (2002) Kraan-Korteweg, R. C., Henning, P. A., & Schröder, A. C. 2002, A&A, 391, 887
- Kraan-Korteweg (2005) Kraan-Korteweg, R. C. 2005, Reviews in Modern Astronomy, 18, 48
- Kraan-Korteweg et al. (2005) Kraan-Korteweg, R. C., Staveley-Smith, L., Donley, J., Koribalski, B., & Henning, P. A. 2005, Maps of the Cosmos, 216, 203
- Kraan-Korteweg et al. (2008) Kraan-Korteweg, R. C., Shafi, N., Koribalski, B. S., et al. 2008, Galaxies in the Local Volume, 13
- Kraan-Korteweg et al. (2011) Kraan-Korteweg, R. C., Riad, I. F., Woudt, P. A., Nagayama, T., & Wakamatsu, K. 2011, Ten Years of IRSF - and the Future, Nagoya University: Nagoya, 98; arXiv:1107.1069
- Lavaux et al. (2010) Lavaux, G., Tully, R. B., Mohayaee, R., & Colombi, S. 2010, ApJ, 709, 483
- Lavaux & Hudson (2011) Lavaux, G., & Hudson, M. J. 2011, MNRAS, 416, 2840
- Loeb & Narayan (2008) Loeb, A. & Narayan, R. 2008, MNRAS, 386, 2221L
- Ma et al. (2012) Ma, Y.-Z., Branchini, E., & Scott, D. 2012, MNRAS, 425, 2880
- Massey et al. (2003) Massey, P., Henning, P. A., & Kraan-Korteweg, R. C. 2003, AJ, 126, 2362
- Matthews & Gallagher (1996) Matthews, L. D., & Gallagher, J. S., III 1996, AJ, 111, 1098
- Matthews et al. (1995) Matthews, L. D., Gallagher, J. S., III, & Littleton, J. E. 1995, AJ, 110, 581
- McIntyre et al. (2015) McIntyre, T. P., Henning, P. A., Minchin, R. F., Momjian, E., and Butcher, Z. 2015, AJ, 150, 28
- Meyer et al. (2004) Meyer, M. J., Zwaan, M. A., Webster, R. L., et al. 2004, MNRAS, 350, 1195
- Mullis et al. (2005) Mullis, C. R., Ebeling, H., Kocevski, D. D., & Tully, R. B. 2005, Nearby Large-Scale Structures and the Zone of Avoidance, 329, 183
- Nagayama et al. (2004) Nagayama, T., Woudt, P. A., Nagashima, C., et al. 2004, MNRAS, 354, 980
- Paturel et al. (2003) Paturel G., Petit C., Prugniel P., Theureau G., Rousseau J., Brouty M., Dubois P., Cambrésy L., 2003, A&A, 412, 45
- Radburn-Smith et al. (2006) Radburn-Smith, D. J., Lucey, J. R., Woudt, P. A., Kraan-Korteweg, R. C., & Watson, F. G. 2006, MNRAS, 369, 1131
- Ramatsoku et al. (2014) Ramatsoku, M., Kraan-Korteweg, R. C, Schröder, A. C., & van Driel, W. 2014, arXiv:1412.5324
- Rauzy (2001) Rauzy, S. 2001, MNRAS, 324, 51
- Ryan-Weber et al. (2002) Ryan-Weber, E., Koribalski, B. S., Staveley-Smith, L., et al. 2002, AJ, 124, 1954
- Said et al. (2015) Said, K., Kraan-Korteweg, R. C., & Jarrett, T. H. 2015, MNRAS, 447, 1618
- Sault et al. (1995) Sault, R. J., Teuben, P. J., & Wright, M. C. H. 1995, Astronomical Data Analysis Software and Systems IV, 77, 433
- Saunders et al. (2000) Saunders, W., Sutherland, W. J., Maddox, S. J., et al. 2000, MNRAS, 317, 55
- Schlafly & Finkbeiner (2011) Schlafly, E. F., & Finkbeiner, D. P. 2011, ApJ, 737, 103
- Schlegel et al. (1998) Schlegel, D. J., Finkbeiner, D. P., & Davis, M. 1998, ApJ, 500, 525
- Schröder et al. (2007) Schröder, A. C., Mamon, G. A., Kraan-Korteweg, R. C., & Woudt, P. A. 2007, A&A, 466, 481
- Schröder et al. (2009) Schröder, A. C., Kraan-Korteweg, R. C., & Henning, P. A. 2009, A&A, 505, 1049
- Shafi (2008) Shafi, N. 2008, A HI Search for Galaxies Hidden by the Galactic Bulge, M.Sc. thesis, University of Cape Town, 2008
- Springob et al. (2014) Springob, C. M., Magoulas, C., Colless, M., et al. 2014, MNRAS, 445, 2677
- Staveley-Smith et al. (1996) Staveley-Smith, L., Wilson, W. E., Bird, T. S., et al. 1996, PASA, 13, 243
- Staveley-Smith (1997) Staveley-Smith, L. 1997, PASA, 14, 111
- Staveley-Smith et al. (1998) Staveley-Smith, L., Juraszek, S., Koribalski, B. S., et al. 1998, AJ, 116, 2717
- Stein (1997) Stein, P. 1997, A&A, 317, 670
- Tully & Fisher (1987) Tully, R. B., & Fisher, J. R. 1987, Cambridge: University Press, 1987,
- Tully et al. (2009) Tully, R. B., Rizzi, L., Shaya, E. J., et al. 2009, AJ, 138, 323
- van Driel et al. (2009) van Driel, W., Schneider, S. E., Kraan-Korteweg, R. C., & Monnier Ragaigne, D. 2009, A&A, 505, 29
- Verheijen et al. (2009) Verheijen, M., Oosterloo, T., Heald, G., & van Cappellen, W. 2009, Panoramic Radio Astronomy: Wide-field 1-2 GHz Research on Galaxy Evolution, 10
- Visvanathan & Yamada (1996) Visvanathan, N., & Yamada, T. 1996, ApJS, 107, 521
- Wakamatsu et al. (2005) Wakamatsu, K., Malkan, M. A., Nishida, M. T., et al. 2005, Nearby Large-Scale Structures and the Zone of Avoidance, 329, 189
- Watkins et al. (2009) Watkins, R., Feldman, H. A., & Hudson, M. J. 2009, MNRAS, 392, 743
- Williams et al. (2014) Williams, W. L., Kraan-Korteweg, R. C., & Woudt, P. A. 2014, MNRAS, 443, 41
- Wong et al. (2006) Wong, O. I., Ryan-Weber, E. V., Garcia-Appadoo, D. A., et al. 2006, MNRAS, 371, 1855
- Woudt et al. (1999) Woudt, P. A., Kraan-Korteweg, R. C., & Fairall, A. P. 1999, A&A, 352, 39
- Woudt & Kraan-Korteweg (2000) Woudt, P. A., & Kraan-Korteweg, R. C. 2000, Mapping the Hidden Universe: The Universe behind the Milky Way - The Universe in HI, 218, 193
- Woudt et al. (2000) Woudt, P. A., Kraan-Korteweg, R. C., & Fairall, A. P. 2000, Mapping the Hidden Universe: The Universe behind the Milky Way - The Universe in HI, 218, 203
- (100) Woudt, P.A., & Kraan-Korteweg, R.C., 2001, A&A 380, 441
- Woudt et al. (2004) Woudt, P. A., Kraan-Korteweg, R. C., Cayatte, V., Balkowski, C., & Felenbok, P. 2004, A&A, 415, 9
- Woudt et al. (2008) Woudt, P. A., Kraan-Korteweg, R. C., Lucey, J., Fairall, A. P., & Moore, S. A. W. 2008, MNRAS, 383, 445
- Wright & Otrupcek (1990) Wright, A., & Otrupcek, R. 1990, PKS Catalog (1990), 0
- Wright et al. (2010) Wright, E. L., Eisenhardt, P. R. M., Mainzer, A. K., et al. 2010, AJ, 140, 1868
- Zwaan et al. (2004) Zwaan, M. A., Meyer, M. J., Webster, R. L., et al. 2004, MNRAS, 350, 1210
Appendix A Notes to individual detections
J063101: The distance between the H I position and the counterpart is rather large (), but the H I detection is located near the corner of the cube (l,b = ) where the sensitivity is lower. On the other hand, the HIPASS position is much closer to the counterpart ().
J064700A: There is a possible galaxy visible in the NIR next to a group of stars at (RA,Dec) = (06:47:06.0, -00:35:27), with a distance of to the H I position.
J065303A, J065303B, and J065304: The spectra of all three detections show emission from the other galaxies as well.
J065705A and J065705B: Both spectra show emission of the other galaxy as well.
J070004: Begum et al. (2005) observed this galaxy with the VLA and found that the H I emission comes from two dwarf galaxies. Both are faintly visible on the deep NIR images.
J070413: Underneath the narrow H I profile there appears to be a broader profile (under the detection threshold) at a more northern declination, as can be made out in the data cube. The obvious cross match for the narrow profile is the nearly face-on galaxy 2MASX J07042532-1346257, while further north (at about equal distance from the fitted H I position) lies a galaxy pair, 2MASX J07041909-1338217 and an unpublished galaxy at (RA,Dec) = (07:04:18.7,-13:37:47), which is likely the counterpart of the broader profile.
J070903: This galaxy is not in NED but was found in Simbad.
J071722B and J071722A: These two detections are close together, and the images show a close galaxy pair that is likely interacting (it is bright in IRAS as well as WISE). There is a (single) optical velocity for the IRAS source ( km s-1, Visvanathan & Yamada 1996) that agrees well with the main H I detection (J071722A). There are also three smaller galaxies in the area, two of which are likely background, but one (2MASX J07174038-2224406) is a possible candidate, too. The H I detection J071722A comes most likely either from the more edge-on component of the galaxy pair (CGMW 2-0730) or from both (the profile is lopsided). The narrow profile J071722B could come from the less inclined component of the galaxy pair (CGMW 2-0731), or it could come from a hidden late-type galaxy (). It is less likely coming from 2MASX J07174038-2224406 which seems nearly edge-on (though at these extinction levels faint outer spiral arms could be invisible).
J071809: There are two LSB galaxies in the field; the closer and more extended one is given as the cross match. It is possible, though, that the other galaxy at (RA,Dec) = (07:18:14.5,-09:03:03) may contribute to the signal (cf. J070004).
J072524A: The profile shows a high-velocity shoulder. A close inspection of the data cube indicates a fainter H I emission at smaller RA with the obvious candidate 2MASX J07245535-2430057.
J073216: This seems to be a star forming region with an H II region and star cluster. There is a 2MASS detection nearby (2MASX J07315300-1658237) which looks like a small, nearly edge-on galaxy. However, the extinction in this area is large and spatially highly variable which means the galaxy could be also be a nearly face-on barred spiral. Due to the large spatial variation of the extinction a hidden galaxy is also possible.
J073328: The profile shows a high-velocity shoulder which seems to be caused by the inclined galaxy at (RA,Dec) = (07:33:23.2,-28:44:01).
073826: A galaxy pair is the obvious match for the H I detection. Both galaxies seem to be of similar (late) type, with CGMW 2-1056 being more edge-on and CGMW 2-1059 being less inclined. It is likely that both have H I and possibly contribute to the H I detection.
J074220A: There are at least five galaxies of similar size visible which could form a group of galaxies. The counterpart is a large spiral that is the most prominent in the -band. It is also the reddest on WISE images.
J074332: There are two 2MASS galaxies in the area but both are of earlier morphological type than the cross-match and hence less likely candidates. Nevertheless, they cannot be fully excluded as candidates.
J074426 and J074425: These two H I detections are only apart. There are five galaxies visible, two of which are possible candidates. 2MASX J07442148-2602486 is the larger candidate and a late-type spiral. It agrees well with the profile of J074426, while the other galaxy, 2MASX J07442386-2600016, seems to be an early-type spiral with a smaller diameter which agrees better with J074425. Paturel et al. (2003) observed 2MASX J07442386-2600016 and found a detection at km s-1 though with a very low SNR of 2.7.
J074518, J074618: Both spectra show emission of the other galaxy as well.
J074721: 2MASX J07471872-2138080 is confirmed through an optical velocity of km s-1 (Visvanathan & Yamada 1996). A nearby early spiral could be a companion.
J074825A and J074825B: These two H I detections are apart (and at different velocities). There are six possible candidates in the area. 2MASXJ07483666-2510211 was detected by Paturel et al. (2003) at km s-1, while Kraan-Korteweg et al. (in prep.) have observed 2MASXJ07483252-2516431 at km s-1. Both used the NRT (Nançay Radio Telescope) and have measured a similar flux ( Jy km s-1and Jy km s-1, respectively), while our detection has a higher flux. We therefore conclude that 2MASXJ07483452-2513191, which is closer to our H I position, is the counterpart of J074825B.
Due to the two NRT observations, we can exclude four of the six galaxies as the candidate for J074825A. 2MASX J07480561-2513459 has an optical velocity of km s-1 (Acker et al. 1991) and is an IRAS galaxy. It is the most likely candidate for J074825A.
J074826, J074926A and J074926B: These three H I detections are close together and the profiles are confused. While J074826 and J074926B have obvious candidates, Miriad failed to fit the position of J074926A and the distance to the cross match could be larger. There are two candidates, ESO 493-G017 and 2MASX J07490476-2611061. ESO 493-G017 is an Sab galaxy and was observed by Chamaraux et al. (1999) with the NRT who find a lower peak flux ( mJy). 2MASX J07490476-2611061 is therefore the more likely counterpart.
J075126: A possible candidate looks small and seems to be a more distant galaxy. However, an LSB halo cannot be excluded (WISE images show considerable (foreground) emission in the W3 and W4 bands and are therefore not conclusive).
J075322: The candidate is a galaxy triple (IRAS source) and, if they are companions, the H I signal could come from more than one of them. Note that the H I detection in the literature is associated with CGMW 2-1471 which is the smallest galaxy in the triplet. There are more galaxies in the area which may indicate a galaxy group.
J075523: At least five candidates are visible in the area. The largest and brightest, 2MASX J07551159-2304175, is an inclined early spiral and a likely candidate for this H I mass (). Two other galaxies, CGMW 2-1571 and a new galaxy at (RA,Dec) = (07:55:34.1,-23:04:33), are also large but bluer and of later morphological type. This is possibly a group of galaxies.
J075626: The profile is confused. The HIPASS profile, with a position further south, extends only to km s-1, while our profile extends to km s-1. Using the HIPASS webpage, the position of our candidate gives a more similar profile to ours. The HIZOA cube shows a peak at (RA,Dec) (07:56:47,-26:16:27) which was not identified as a separate detection during the search. We conclude that the confusing partner is 2MASX J07563846-2615018 far in the south. Huchtmeier et al. (2001) observed this galaxy with the Effelsberg radio telescope at an H I velocity of 241 km s-1. The HIZOA data cube does not show anything at this velocity and with a peak flux of 67 mJy and a width of km s-1.
J075631: There are two equally-sized galaxies close together, possibly a pair. One seems edge-on, the other has a small inclination. The profile is more consistent with the less inclined galaxy.
J080222: The counterpart, ESO 494-G013, was also observed with the Effelsberg radio telescope by Kraan-Korteweg & Huchtmeier (1992), and detected at km s-1. We could not confirm this detection at the given peak flux of Jy.
J080527 and J080627: These two H I detections are close together and the profiles cannot be fully separated, that is, some of the H I parameters are uncertain.
J080725: Kraan-Korteweg & Huchtmeier (1992) detected this galaxy with the Effelsberg radio telescope at km s-1, while our detection is at km s-1. The HIPASS archive151515http://www.atnf.csiro.au/research/multibeam/release/ does not show any (bright) detection at this position and velocity.
J080835: There are two candidates of similar size: 2MASX J08083663-3558328 is of a later spiral type and more inclined than 2MASX J08080066-3558243. The H I detection lies between these two galaxies, and from a closer inspection of the data cube it is likely that both galaxies contribute to the signal. Kraan-Korteweg et al. (in prep.), using the NRT, detected 2MASX J08080066-3558243 without the broader base of our detection (which is therefore likely due to 2MASX J08083663-3558328).
J081627B: A diffuse emission visible in the -band at (RA,Dec) = (08:17:07.0,-27:45:15) at a distance of to the H I position is the likely counterpart if confirmed as a galaxy.
J081727: The H I profile seems to be either disturbed or confused. The counterpart is NGC 2559 which appears also disturbed in the optical (Corwin et al. 1985). There is an LSB dwarf close by, at (RA,Dec) = (08:17:24.4,-27:28:04), which may be a companion. At about 18′ north and south are two other H I detections (J081627A and J081627B) with similar velocities.
J081729A: This cross match is listed in Simbad but not in NED.
J082236: There is a possible galaxy visible in the NIR at (RA,Dec) = (08:22:50.4,-36:36:41), with a distance of to the H I position, which, if real, is a likely counterpart.
J082441: There are two similar looking galaxies, possibly a galaxy pair. 2MASX J08240445-4144221 is more inclined, while 2MASX J08235945-4143111 seems to show a bar and the start of a spiral arm; both match the profile well enough. The profile has a low SNR of 5, and it is not possible to tell whether one or both galaxies contribute to the signal.
J082735: Paturel et al. (2003) have observed IRAS 08254-3512 which is north of our detection. Their detection is similar to ours with a slightly lower peak flux. Nothing is visible at the IRAS position, and the counterpart is more likely an invisible LSB between these two positions (which would agree with the narrow single-peak profile and low H I-mass ().
J082736: There are two galaxies close together, probably a galaxy pair. 2MASX J08271103-3629389 is edge-on and seems to match the profile better; it also has an optical velocity of km s-1 (Visvanathan & Yamada 1996). The pair was detected by IRAS as well.
J083437: The cross match is a nearly face-on spiral galaxy. There is a diffuse LSB galaxy visible in the -band close by, at (RA,Dec) = (08:34:16.9,-37:32:36), which may contribute to the signal.
J085144: There are two possible counterparts visible in the NIR, one edge-on and one a little inclined. The profile seems to match the galaxy with less inclination better.
J085739 and J085839: Both spectra show emission of the other galaxy as well.
J085845A: There are two possible counterparts visible in the NIR, possibly a galaxy pair. 2MASX J08580941-4548126 shows spiral arms, either disturbed or with a companion close by, while 2MASX J08581399-4550547 is a very inclined early-type spiral. The profile matches the former slightly better, and a possible contribution from both galaxies cannot be excluded.
J090253: There is a small edge-on galaxy in the field. Even taking the extinction into account (), the galaxy seems too small for this distance ( km s-1) and H I mass () but cannot be fully excluded.
J091654A and J091654B: Both spectra show emission of the other galaxy as well.
J092748: The high-velocity shoulder in the profile is likely caused by J092948.
J093251: The cross match is an interacting galaxy pair (IRAS source). Both are spirals and it is not possible to decide where the H I comes from.
J093956: There is a possible galaxy visible in the NIR at (RA,Dec) = (09:39:36.3,-56:53:05) with a distance of to the H I position, which, if real, matches the profile well.
J094947A: The cross match (ESO 213-G002) is a peculiar S0 galaxy which seems to have either a companion or a jet to the south. Further south () is RKK 1666 which is likely to contribute: the data cube shows a faint, more narrow profile at (RA,Dec) (09:49:24,-47:59:48).
J094956: The distance between the H I position and the position of the cross match, , is for a SNR of 77 rather large. A closer inspection of the data cube revealed a fainter H I detection close-by () with an approximate position of (RA,Dec) (09:48:18.6,-56:29:49) and km s-1 which appears as a low-velocity shoulder in the profile of J094956. The obvious candidate here is 2MASX J09482319-5627370.
J095049: There are two different optical velocities for this galaxy: km s-1 (Kraan-Korteweg et al. 1995) is uncertain and seems high for a galaxy of this appearance; km s-1 (Saunders et al. 2000) is about from our H I velocity and agrees better with the optical appearance of the galaxy.
J095052: A possible candidate visible at all wavelengths is close to a star which makes it difficult to determine its appearance, but it seems too small for this velocity ( km s-1). The star and the extinction () could hide a larger halo, but a hidden LSB galaxy is a more likely cross match. The galaxy is a possible IRAS source (IRAS 09482-5209; though it could be also the bright star to the north).
J095261: No galaxy is visible at the position of RKK 1733. It is only from the 2MASS position which is not listed by Kraan-Korteweg (2000) though it is clearly visible in the -band. It seems possible that both IDs indicate the same galaxy.
J095255A: The profile is highly lopsided. The cross match is large and diffuse with a small bulge in the NIR. It is not possible to distinguish whether it may be disturbed or may have a small companion.
J095349: There is a large LSB galaxy visible in the -band as well as a smaller inclined galaxy (RKK 1732). The LSB galaxy matches the profile better.
J100058A and J100058B: The two counterparts are only apart and the two profiles cannot be fully separated.
J100458: The profile shows a prominent horn which, according to the data cube, could be caused by two close-by double horn profiles separated in both RA and Dec (10:04:34,-58:31:10 and 10:04:04,-58:39:15, respectively). There are two NIR-bright candidates in these positions, which are likely counterparts. This is supported by that fact that the distances between H I position and the two counterparts ( and ) are large for an SNR of 36, cf. Fig. 4.
J102452: The candidate seems to be a galaxy pair (possibly interacting since it is an IRAS source). 2MASX J10240866-5159040 is slightly rounder and of earlier type than RKK 2457, and it is not quite clear whether only one of them or both contribute to the signal.
J105866: This is a confused profile. the HIPASS detection J105966 lies further south and shows a broad double-horn profile clearly caused by ESO 093-G003 with an optical measurement of km s-1 (Fairall 1980). Our H I detection could not be separated from this because the ESO galaxy lies beyond the edge of the cube and was therefore not properly detected.
J114964: There is a large spiral with a smaller companion visible in the NIR. It is likely that the companion contributes to the profile.
J121458: There are two galaxies in the field, possibly companions. WKK 0788 is edge-on and seems to match the profile slightly better than the later type WKK 0782. There is no indication of confusion.
J122257: Schröder et al. (2009) have detected this galaxy in the OFF beam and associated it with WKK 0969 (which lies to the Southeast of our detection) as the only known galaxy in the area, while at we find a galaxy that is not listed in the literature as the more likely counterpart.
J123461: There are two galaxies visible, possibly a galaxy pair. They have similar appearance except that the galaxy at (RA,Dec) = (12:33:47.8,-61:29:57) appears more face-on. The profile appears to be confused and it is likely that both galaxies are detected.
J130458: The distance of to the cross match is large but the H I detection is near the edge of the cube and the signal-to-noise ratio is low. The galaxy is well visible in the -band. The other candidates in the field do not agree as well with the profile.
J131057: There are two bright galaxies (E and S) in the field and several smaller ones, possibly a group of galaxies.
J131458: This is a strong signal with a lopsided double-horn. There are two galaxies in the field, WKK 2020 is more edge-on and a later spiral than 2MASX J13150989-5856116 which has an optical velocity of km s-1 (Fairall et al. 1998). They are likely to form a pair with both contributing to the signal. This is supported by the fact that the distance to each of the galaxies ( and , respectively) is unusually high for the SNR of 96 of the H I detection: the median SNR of cross-matches with distances between and is 9.8 with a sigma of 7.2, hence this is a deviation. In addition, the H I position lies just between these two galaxies.
J132961: There is a possible galaxy visible in the NIR at (RA,Dec) = (13:30:01.0,-61:51:44) with a distance of to the H I position, which matches the profile well.
J133758B: There are three spiral galaxies in the field, two of which are of similar size and possibly form a pair. 2MASX J13372458-5852216 is fairly edge-on and of earlier morphological type than 2MASX J13373282-5854136 which has an optical velocity of km s-1 (Visvanathan & Yamada 1996). It seems likely that both galaxies contribute to the profile (cf. the profile given in Schröder et al. (2009) for WKK 2390 = 2MASX J13372458-5852216).
J134465: The counterpart, WKK 2503, was also observed and detected by Schröder et al. (2009). Their profile, with a higher velocity resolution, is clearly confused, that is, the peak at km s-1 seems to belong to second galaxy which is neither visible in the optical nor in the NIR.
J135358: This H I detection seems to be a companion of the Circinus galaxy (J141365). We have adopted the same distance to calculate the H I mass.
J140565: There are two LSB galaxies in the field. The fainter and rounder seems to fit the profile better. The cube shows a possible faint H I detection under the detection limit at km s-1 and with a larger linewidth which could be the other, more edge-on, galaxy in the field (WKK 2924). WKK 2924 was also observed by Schröder et al. 2009 where both detections were noted. While the detection at was attributed to WKK 2924 (as we do), the detection at km s-1 was attributed to WKK 2938 which lies to the south at . However, the position and flux of our H I detection rule out WKK 2938 as a counterpart.
J140657: There is a galaxy pair in the field. Their morphological types seem to be similar, and 2MASX J14061018-5752098 is edge-on while 2MASX J14062739-5751425 is less inclined. It is likely that both contribute to the profile (the data cube seems to support a separation in RA).
J141365: This is the well-known Circinus galaxy. It is resolved with respect to the Parkes beam.
J141658: This galaxy has the largest linewidth: km s-1(and km s-1). The NIR images show a perfect edge-on galaxy with a clear bulge.
J142460: There is a possible galaxy visible in the NIR at (RA,Dec) = (14:25:10.3,-60:05:49) with a distance of to the H I position which matches the profile well. However, due to the high extinction and faintness of the object we cannot say for certain that this is a galaxy.
J143561: There are several galaxies visible on the VISTA image. Due to the high extinction () only the bulges are clearly visible and it is not possible to compare sizes and morphological types. We have chosen the largest as the most likely counterpart which is also red on WISE.
J144854: The H I detection is a near-by dwarf galaxy ( Mpc). The candidate appears very small but with an extinction of a large LSB halo is possible.
J145256: The cross match is a very edge-on late-type spiral galaxy. It seems to have a companion to the North which is less inclined but of similar morphological type. According to the data cube it is likely that both contribute to the profile.
J150157: There is a galaxy pair in the field, both very similar-looking inclined medium-type spirals. The profile, however, implies a galaxy with little inclination. A closer inspection of the data cube reveals a broader profile under the detection limit, similar to J100458. On the other hand, the extinction in this region is fairly high () and varies across the field (which is most prominent in the -band). Therefore, either the cross match is an invisible face-on / late-type galaxy or we have detected a lopsided horn of one of the galaxies in the pair (note that the baseline is very variable here).
J150455: There is a possible galaxy visible in the NIR at (RA,Dec) = (15:04:24.3,-55:29:09) with a distance of to the H I position. It lies between stars and this cannot be unambiguously identified as a galaxy.
J150952: This H I detection is resolved with respect to the Parkes beam.
J151354: This is a close galaxy pair, possibly interacting (IRAS source). The larger component is listed here.
J151452: This H I detection is resolved with respect to the Parkes beam.
J153054: There is a possible galaxy visible in the NIR at (RA,Dec) = (15:31:00.5,-54:03:37) with a distance of to the H I position, which matches the profile well.
J153059: The cross match is a close galaxy pair, possibly interacting (IRAS source). It is not possible to tell whether one or both contribute to the profile.
J153256: This galaxy is extended and has been observed with the Australia Telescope Compact Array by Staveley-Smith et al. (1998) with a positional accuracy of 15 arcsec (NED). At an extinction of nothing is visible at this position.
J154960: There are three galaxies in the field. The counterpart seems slightly larger in the -band as well as with WISE than WKK 5337 and the third galaxy at (RA,Dec) = (15:49:39.6,-60:15:24).
J155058: Schröder et al. (2009) observed WKK 5366 (at ) with almost the same flux. We have excluded WKK 5366 as a counterpart since it has an optical velocity of km s-1 (Woudt et al. 2004), and the distance is fairly large for such a bright detection.
J155350: Despite the high extinction () several small galaxies of similar appearance can be seen, possibly forming a group. We have chosen the largest with obvious bulge and disk as the probable counterpart.
J155349 and J155450: This is an area of complex emission which cannot easily be disentangled. The data cube shows also some fainter emission below our detection limit. While the cross match for J155450 is a nearly edge-on galaxy with no other galaxy visible within a 5-arcminute radius, for J155349 there are four galaxies visible in the NIR (two of which are unknown). The largest, 2MASX J15534458-5000182, seems to be an early type galaxy and is an unlikely candidate. The galaxy at (RA,Dec) = (15:54:01.1,-49:54:06) shows a diffuse halo and a small bulge and seems to be the most likely candidate. It is also bright in the WISE bands W3 and W4. A candidate for possible confusion could be 2MASX J15534427-5002132 at from the H I position.
J155361: Schröder et al. (2009) observed WKK 5430 which is to the North of our position. Their detection is lopsided and has less flux than ours which rules out WKK 5430 as the counterpart. In addition, the HIPASS position (RA,Dec) = (15:53:43.5,-61:13:34) favours WKK 5447.
J155750A and J155750B: These two H I detections are apart, and the two profiles are slightly confused. The extinction is fairly high () and a hidden galaxy cannot be excluded.
J160349: There are two candidates, both nearly edge-on. They are of similar size, possibly a galaxy pair. The candidate at (RA,Dec) = (16:03:34.6,-49:51:16) is slightly larger with a larger bulge (it is also brighter on WISE).
J161256: The detection of WKK 6219 by Schröder et al. (2009) seems to be the low-velocity horn of J161256.
J161648A and J161648B: These two H I detections are apart and the profiles are confused.
J161655: There are ATCA observations on this H I detection (Staveley-Smith et al. 1998) which shows that the H I is extended and has two bright components about apart. There is no counterpart visible in the optical or NIR despite a moderate extinction () indicating that the counterpart is likely to have a low surface brightness. Due to its extent, the coordinates given in previous publications, Henning et al. (2000) and Juraszek et al. (2000), are and east of our position, while the exact position given in Staveley-Smith et al. (1998) is only (west) from our position.
J162244A: There is a possible galaxy visible in the NIR at (RA,Dec) = (16:22:05.2,-44:22:36) with a distance of to the H I position, which matches the profile well. It lies next to a bright star which makes the identification uncertain.
J162542: The spectrum also shows J162442 at the lower velocities. It appears that the profiles overlap and the linewidths and flux measurement are uncertain.
J162555: The cross match is a galaxy pair: 2MASX J16253644-5533498 is bright and nearly edge-on (wide profile) while WKK 6819 is a late-type spiral (narrow profile).
J163344: There are two similar looking small galaxies visible in the NIR, possibly a galaxy pair. The H I detection is too faint to tell whether one or both galaxies contribute to the profile.
J164849: The H I cross match seems to be a galaxy pair of similar appearance where both are likely to contribute.
J165140: There is a possible galaxy visible in the NIR at (RA,Dec) = (16:51:53.2,-40:48:03) with a distance of to the H I position. WISE shows also a faint reddish patch, though there is a possibility that it is Galactic.
J165344: This galaxy is only visible with WISE and could be also a background galaxy.
J165348: There is a possible galaxy visible in the NIR at (RA,Dec) = (16:53:21.1,-48:01:53) with a distance of to the H I position, which matches the profile well.
J170540: WISE shows a bright red extended emission at (RA,Dec) = (17:05:04.8,-40:58:08) with a distance of to the H I position. According to the WISE colors it could be either a star burst galaxy or an H II region (Jarrett et al. 2011).
J171642: The only visible candidate seems too small for this distance, though a larger LSB halo cannot be excluded.
J171635: There are two galaxies visible in the NIR. The edge-on galaxy at (RA,Dec) = (17:16:35.5,-35:57:26) does not match the profile as well as the less inclined galaxy at (17:16:51.8,-35:55:48).
J171937: This galaxy is only visible with WISE and could also be a background galaxy.
J181121 and J181221: Both spectra show emission of the other galaxy as well.
J182106: The only candidate appears too small for a velocity of km s-1 and even taking the extinction of into account, but a very LSB halo cannot be excluded.
J182420: This galaxy was found on WISE images and is faintly visible on the IRSF images.
J182507: There are four galaxies visible in the NIR, two of which are NVSS sources and one is an AGN with an optical velocity of km s-1 (Burenin et al. 2009). We assume the crossmatch to be the most inclined. It is possible that all galaxies belong to a group or cluster.
J184607B and J184607A: These two H I detections are only apart but well separated in velocity. There are two candidates visible in the NIR: both are very inclined, and the larger is assumed to be the cross match for J184607A, while the cross match for J184607B is smaller and seems to be of later morphological type.
J1847+04: This galaxy lies at a Galactic latitude of and belongs technically to the Northern Extension HIZOA (Donley et al. 2005).
J185503B: There is a possible galaxy faintly visible in the NIR at (RA,Dec) = (18:56:00.5,-03:12:21) with a distance of to the H I position. It is large and diffuse and, if real, matches the profile well.
J1858+00: The profile could be confused or come from a disturbed H I distribution. The extinction is high () and only one candidate could be found on the images. No halo is visible, and a hidden galaxy cannot be excluded.
Appendix B Tables and figures available in electronic form only
Table 2: H I and derived parameters
Table 3: Crossmatches of the H I detections
Figure 1: H I spectra of the newly detected galaxies in the HIZOA-S survey. Low order baselines (indicated by the solid line) are fitted, excluding the detections themselves (which are bracketed by the dash-dot vertical lines) and excluding the low and high-velocity edges to the left and right of the dashed vertical lines, respectively. 20% and 50% profile markers are visible.