Are the hosts of VLBI selected radio-AGN different to those of radio-loud AGN?
Abstract
Recent studies have found that radio-AGN selected by radio-loudness show little difference in terms of their host galaxy properties when compared to non-AGN galaxies of similar stellar mass and redshift. Using new 1.4 GHz VLBI observations of the COSMOS field we find that approximately 49% of high-mass (M 1010.5 M⊙), high luminosity (L1.4 1024 W Hz-1) radio-AGN possess a VLBI detected counterpart. These objects show no discernible bias towards specific stellar masses, redshifts or host properties other than what is shown by the radio-AGN population in general. Radio-AGN that are detected in VLBI observations are not special, but form a representative sample of the radio-loud AGN population.
keywords:
galaxies: evolution, galaxies: high-redshift, galaxies: active, radio continuum: galaxies, infrared: galaxies, galaxies: stellar-content1 Introduction
Very Long Baseline Interferometry (VLBI) achieves angular resolutions at the milli-arcsecond level and as such traces only the most compact and intense sources of radio emission. On extra-galactic scales such compact emission can be attributed to either Active Galactic Nuclei (AGN), extreme clusters of Supernovae (SNe) or Supernova Remnants (SNRs). It is only in the local Universe and in the most active of star-forming galaxies however that SNe and SNRs can reach sufficient brightness to be detected by VLBI (Kewley et al., 2000; Norris et al., 2007). Indeed, even the deepest VLBI observations (RMS 10 Jy) struggle to detect SNe and SNRs at high redshifts (z 0.1). Above this, objects detected in such high sensitivity VLBI observations correspond to brightness temperatures of over 3 105K and are thus inconsistent with radio emission from star-formation (Condon et al., 1991). Above z 0.1, VLBI-detected sources also possess radio luminosities several times brighter than can be generated by reasonable SNR and SNe rates (Kewley et al., 2000) or even by multiple simultaneous occurrences of the brightest supernovae currently known (Parra et al., 2010). As a result, VLBI observations offer an unambiguous way of identifying radio-AGN.
Many techniques for identifying radio-AGN focus on selecting objects with extreme radio luminosities or excesses emission in the radio-band when compared to other wavelengths. Radio-AGN identified in this way trace large scale jets and diffuse radio lobes associated with much larger temporal and physical scales than those selected by VLBI. Because of this it is possible that these two distinct methods of selecting radio-AGN may result in very different samples. Indeed VLBI observations tend to detect only 10-50% of radio-loud AGN (Middelberg et al., 2011, 2013; Chi et al., 2013; Deller et al., 2014, Herrera-Ruiz et al., in prep). Is this because these are the earliest phases of the radio-AGN life-cycle or are they perhaps special in some other way?
To test VLBI selected AGN against radio-loud AGN we can either study the properties of the AGN itself or investigate the impact it has on its host galaxy. In Rees et al. (2016) we found that the likelihood of a galaxy hosting a radio-loud selected AGN increases strongly with increasing mass. At a given mass, ellipticals and star-forming galaxies are equally likely to be radio-loud, and the optical/IR properties of radio-loud galaxies are indistinguishable from those of radio-quiet galaxies in the redshift range 0.25 z 2.25. So do VLBI-detected radio-AGN hosts follow the same evolutionary trends as their radio-loud counterparts?
In this paper we analyse the host galaxy properties of VLBI-detected and radio-loud selected AGN in the COSMOS (Cosmological Evolution Survey) field and compare the resulting samples across a broad redshift range in terms of their host star-formation rate, color, infrared-AGN detection rate, stellar mass, dust content and radio-loudness.
2 Data
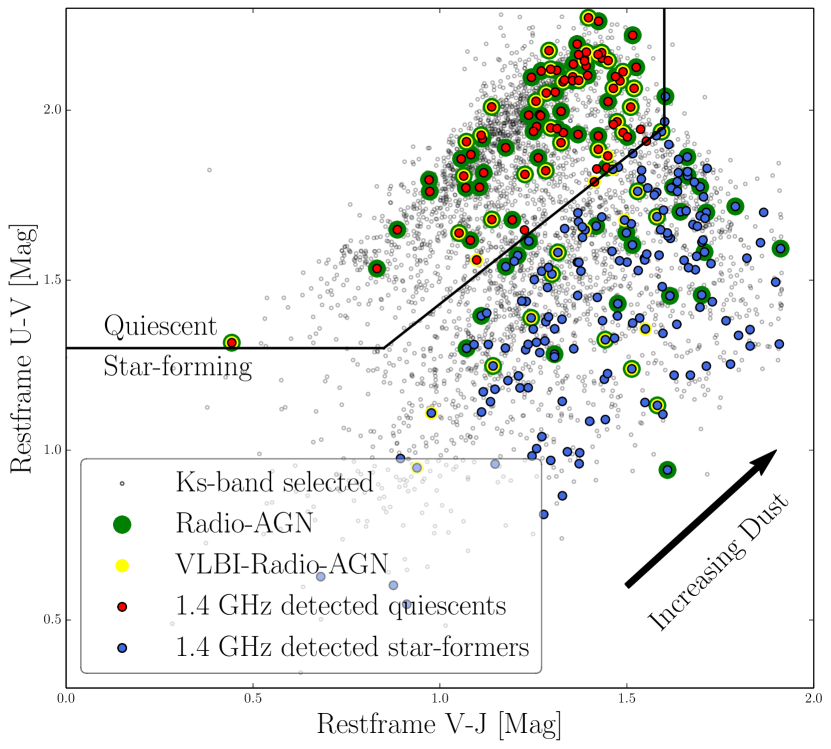
Our primary infrared data set is the Newfirm Medium Band Survey (NMBS, Whitaker et al. 2011) COSMOS field (Giacconi et al., 2001; Schinnerer et al., 2004), which covers an area of 27.6 27.6 down to a 5-sigma total magnitude of 23.5 in K–band. Using these observations along with a large amount of ancillary data, NMBS produces high quality photometric redshifts (z 1-2%), stellar-age, stellar-mass, dust-content, star-formation rates for approximately 24,000 galaxies in the COSMOS Deep field. Using Figure 1 we split this sample into Quiescent or Star-forming hosts using the classifications of Wuyts et al. (2007).
Low resolution radio data for the field is taken from the 1.4 GHz Very Large Array (VLA) Cosmos Deep Project (Schinnerer et al., 2010) which has a central RMS of 10 Jy per beam. The COSMOS Deep Project covers the all of the NMBS Ks/K-band observations with an angular resolution of 2.5 2.5 .
Our high resolution 1.4 GHz radio data consists of deep targeted milli-arcsecond VLBI observations of each of the 2865 radio sources in the COSMOS field (Herrera-Ruiz et al., in prep). These observations were carried out on the Very Long Baseline Array and were designed to match both the maximum depth of the of the VLA Cosmos Deep Project (10 Jy per beam) and the variation in this parameter across the field. The radio-IR identifications, in the area of overlap between the VLBI and NMBS data, are taken from Rees et al. (2016). The resulting sample contains 385 VLA sources with NMBS counterparts and of these 64 have VLBI-detected emission.
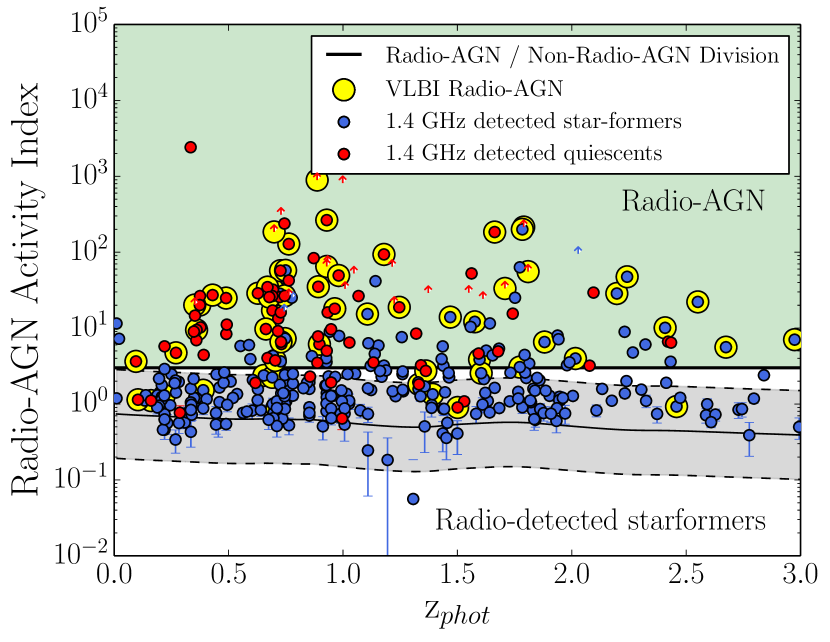
We further categorise all our radio sources into either radio-loud AGN or radio detected star-forming galaxies based upon their radio based star-formation rate (radio-SFR) versus a combined ultraviolet and bolometric infrared star-formation rate (UV+IR-SFR) (Figure 2).
3 Analysis
The result of this process is a large sample of galaxies with information on mass, SFR, dust content, redshifts and host type which can be flagged to select radio-AGN by either radio-loudness or by VLBI detection.
3.1 Defining the analysis samples
To compare the VLBI and radio-loudness selection techniques we create several different sub-samples. Our “Sensitivity Limited sample” is limited to sources with VLA fluxes 50Jy to achieve uniform sensitivity across the field.
Combining the requirements of the “Sensitivity Limited” sample with further limits on stellar mass (M 1010.5 M⊙), redshift (0.25 z 2.25) and VLA radio luminosity (L1.4 21024 WHz-1) in order to have a complete sample of radio objects within our redshift range, produces our “High-Mass/High-Luminosity” (HM/HL) sample of radio-AGN.
We also produce a “Mass-limited” sample of non-AGN which are simply those in NMBS above 1010.5 M⊙ and note that this is above the 90% NMBS mass completeness limit out to z=2.20 (Wake et al., 2011).
Finally we build the “mass similar” control sample by randomly sampling NMBS detected galaxies of similar redshift (same bin) and mass (0.1 M⊙) for each VLBI-detected radio-AGN. The median value of the control samples properties is then measured. This process is repeated 1000 times to probe the range of values seen in the control sample and the median of these runs is then plotted with the standard deviation between the 1000 runs shown as the associated error. A full description of this process can be found in Rees et al. (2016).
3.2 Are VLBI selected radio-AGN special?
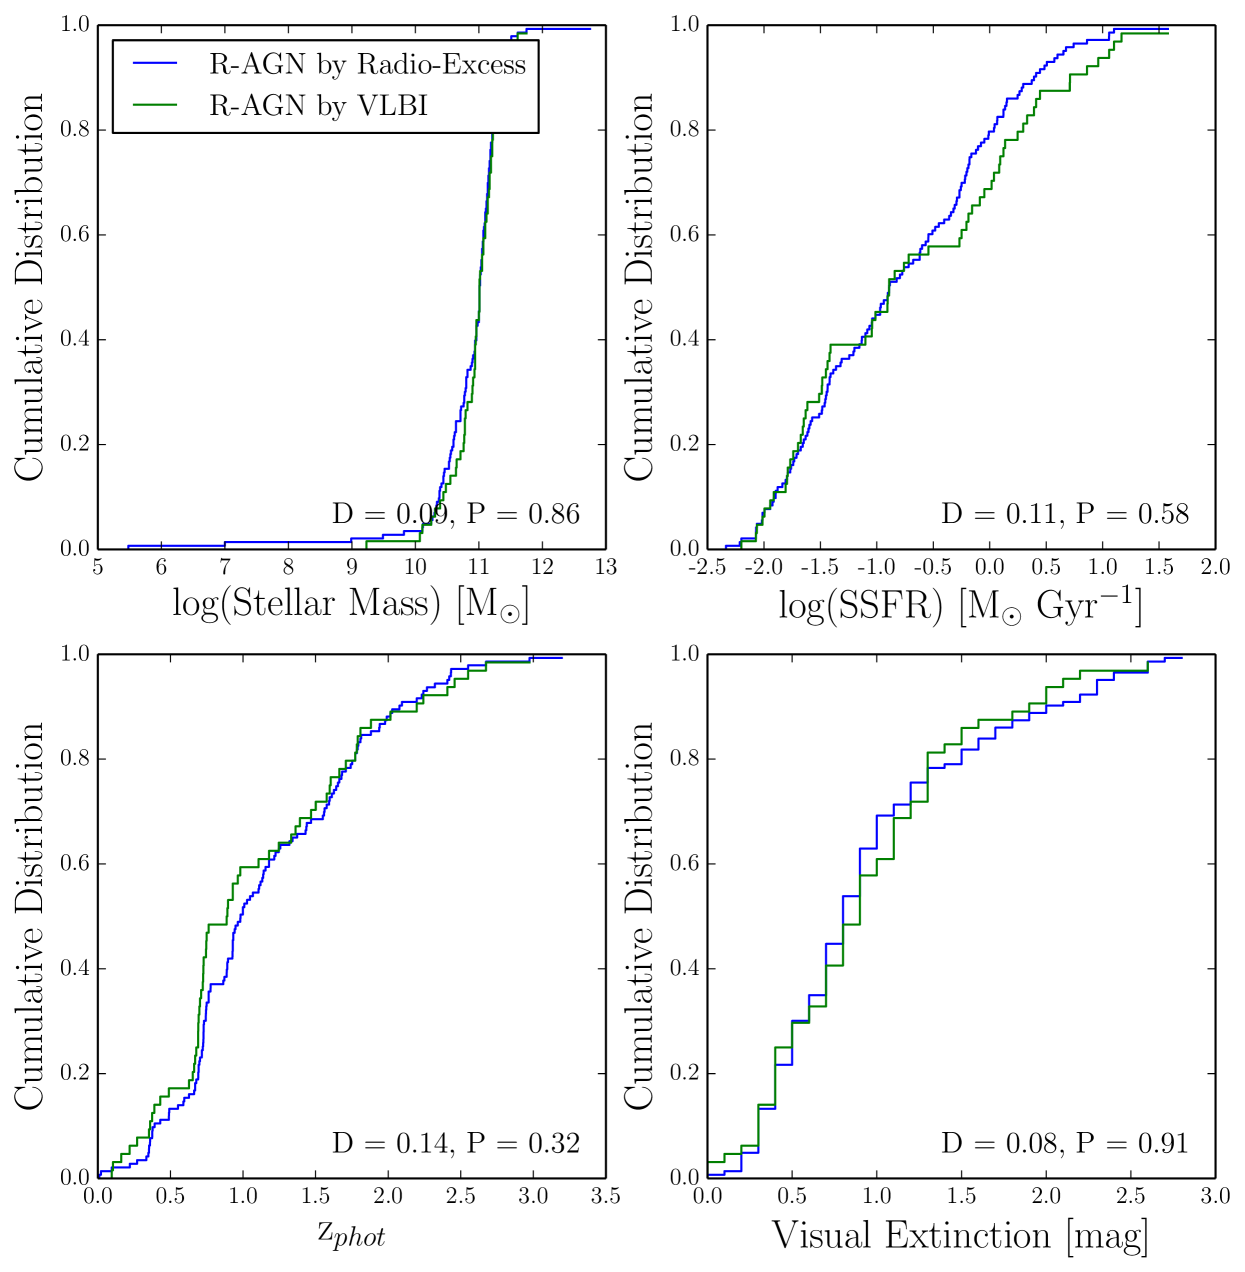
Figure 3 shows the Cumulative Distribution Functions for our VLBI selected and radio-loud selected sensitivity limited samples in terms of stellar mass, specific star-formation rate (SSFR), redshift and dust content (as visual extinction). KS-testing these two populations shows no significant differences between them with P values ranging from P = 0.32 and up (Table 1). Table 1 also shows the KS test statistics when comparing the HM/HL VLBI sample to both HM/HL radio-loud AGN and the mass-similar sample. Even in this mass and radio luminosity complete regime we see little difference between VLBI selected radio-AGN and the radio-loud AGN or mass-similar samples.
| Table 1. | |||
|---|---|---|---|
| All: VLBI vs Radio-Loud | HM/HL: VLBI vs Radio-Loud | HM/HL VLBI vs Mass-similar | |
| P Value (Mass, SSFR, Z, Av) | 0.86, 0.58, 0.32, 0.91 | 0.99, 0.86, 1.00, 0.77 | 0.98 0.20 0.98 0.36 |
| D Value (Mass, SSFR, Z, Av) | 0.09, 0.11, 0.14, 0.08 | 0.10, 0.16, 0.10, 0.17 | 0.13 0.30 0.13 0.26 |
| Numbers (VLBI, Radio-Loud) | 64, 143 | 21, 37 | 21, 1217 |
Overall we find that VLBI detections are present for 51/143 (364%) 111All percentage and fraction errors in this letter are 1-sigma values calculated using the beta confidence interval as described by Cameron (2011). of our sensitivity limited radio-loud AGN population and 18/37 (498%) of the HM/HL radio-loud AGN population. Combining this with the result above suggests that VLBI selects a representative sample of radio-loud AGN and that studies using either selection method should be largely comparable.
It is also possible to study where the radio-loud selection techniques fail. In Figure 2 we can see that for the sensitivity limited sample, 13/64 VLBI-detected radio-AGN are missed by the radio-loudness identifier. Limiting to the high-mass, high-luminosity sample we find that this radio-quiet fraction is considerably lower with only (3/21) VLBI sources failing the radio-loudness criteria. This is in good agreement with the predicted incompleteness of the same sample in Rees et al. (2016) who estimated that 12% of their radio-loud AGN to appear radio-quiet due to simultaneous infrared emission from the AGN which causes an artificial increase in the UV+IR SFR.
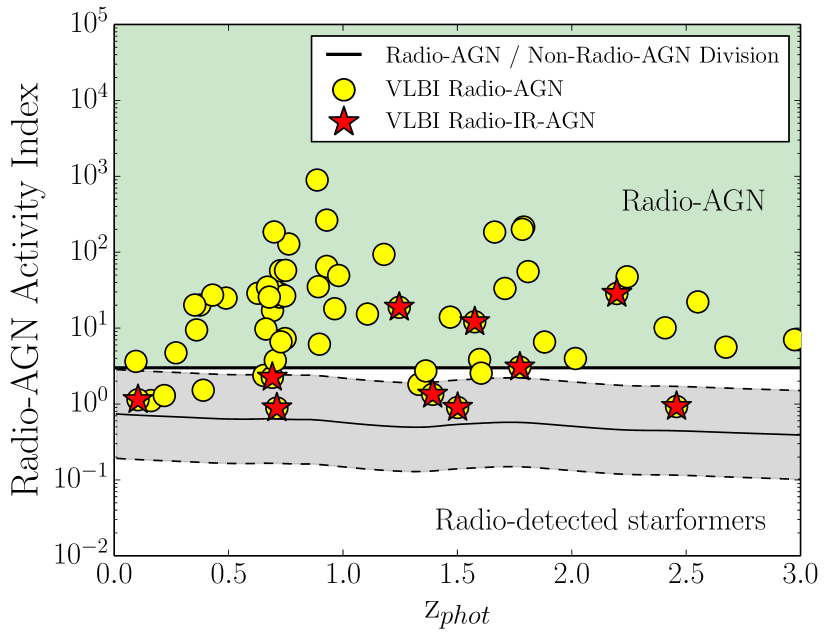
So how many of our radio-quiet VLBI sources contain IR-AGN? Using the Donley wedge (Donley et al., 2012) to identify AGN by infrared color we find that 6/13 (46%) of the sensitivity limited radio-quiet VLBI sources are identified as IR-AGN. Correspondingly in the high-mass, high luminosity sample, this value increases to 2/3 or 66%. For both of these samples the median ratio of VLBI to VLA flux is 548%. This supports the idea that near and far infrared emission from AGN activity can result in a significant number of radio-loud AGN being mis-classified as radio-quiet or radio star-forming galaxies.
3.3 Comparing VLBI-detected radio-AGN, radio-loud AGN and the mass similar sample
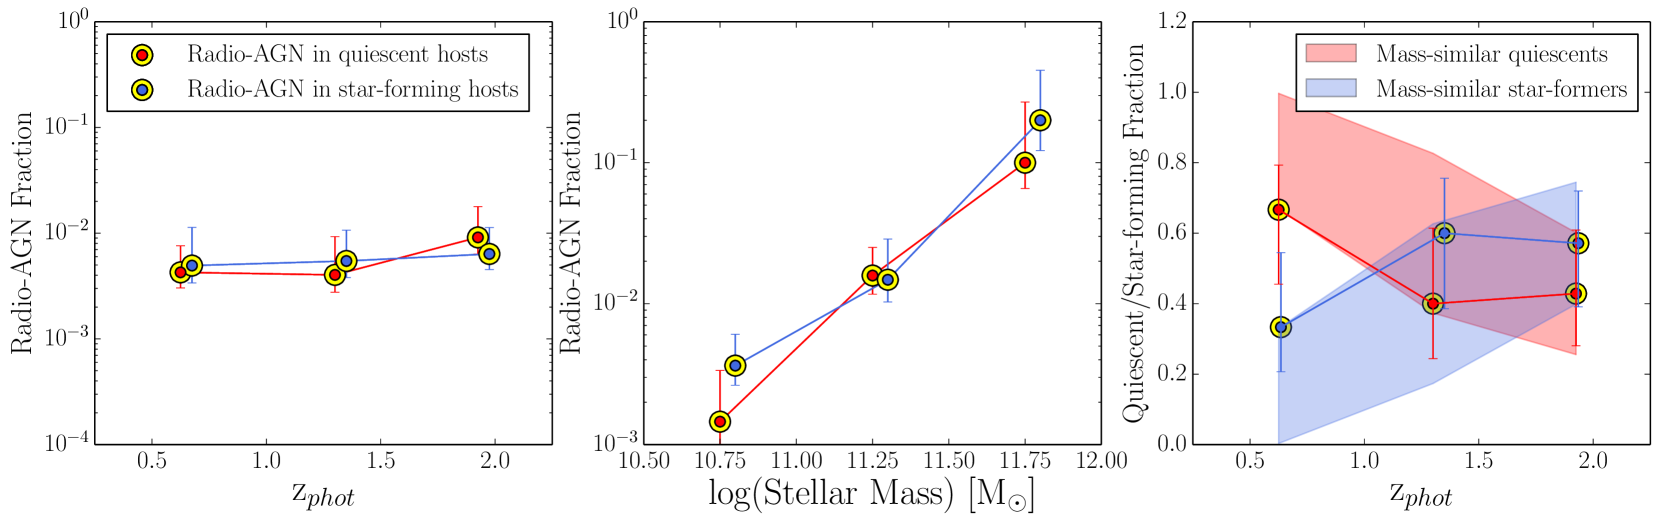
Our HM/HL VLBI selected AGN samples are shown in Figure 4. This is simply the number of HM/HL VLBI-detected sources divided by the number of mass-limited objects, as a function of redshift (left panel) and stellar-mass (center panel). We see no evolution in terms of redshift for the range provided and a correlation with stellar-mass, both trends are in good agreement with the those seen previous work on the radio-loud AGN population (Best et al., 2005; Simpson et al., 2013; Rees et al., 2016). Lastly, evolution of VLBI radio-AGN host types (Quiescent or Star-Forming as defined in Figure 1) are shown to be in reasonable agreement with the evolution of their mass and redshift similar control sample (right panel).
4 Discussion
The idea that VLBI selected sources and radio-loud sources are highly similar is interesting as we might reasonably expect to identify some differences between the samples. Radio-AGN selected by radio-loudness preferentially picks out objects with relatively high radio emission for their IR emission. VLBI on the other hand selects samples with high surface brightness emission from compact sources. Despite this, we see no indication that the host galaxies of VLBI scale radio-AGN (F1.4 50Jy, 1 mas) form a special subset of radio-loud AGN.
One obvious way to explain this result is the idea, proposed by Hickox et al. (2014), that each active period of AGN activity is too short to directly correlate with changes in their host properties. Under this scenario, radio-AGN move periodically from active to inactive states far more rapidly than they can impact their host. As such, our sample of VLBI-detected radio-AGN are simply a random sub-sample of radio-loud AGN and hence would show little difference in their host galaxy properties.
Finally, we find that 10% of VLBI-detected sources are classified as radio-quiet despite having on average more than 50% of their radio flux being emitted on VLBI scales. This implies that even though we might expect star-formation to provide the majority of radio emission in radio-quiet AGN below 100 Jy (Padovani et al., 2011; Bonzini et al., 2013), a significant fraction of the radio emission from radio-quiet AGN above 50 Jy is in fact from the AGN core. Furthermore, a high fraction of these VLBI-detected radio-quiet AGN show strong signs of AGN-based emission in the infrared, acting as a mask for their strong radio-emission.
5 Conclusions
We find that:
-
1.
VLBI selected sources account for 364% of radio-loud AGN detected above 50Jy. For our complete sample comprised of high mass, high radio luminosity sources, this fraction increases to 498%.
-
2.
Importantly while VLBI-detected radio-loud AGN only account for a moderate proportion of the overall radio-loud AGN sample their hosts are statistically representative of the whole radio-loud population.
-
3.
Specifically VLBI selected radio-loud AGN hosts possess stellar-masses, SSFRs, redshifts and dust contents indistinguishable from the hosts of radio-loud AGN.
-
4.
This means that studies conducted using VLBI-selected samples should be in good agreement with those performed on radio-loud selected samples.
-
5.
Finally we find that 20% of VLBI-detected sources are radio-quiet (14% for the high mass, high radio luminosity VLBI-detected sample). This implies that the radio luminosity from some radio-quiet AGN can not be attributed primarily to star-formation activity.
This work made use of data taken on the National Radio Astronomy Observatory’s Karl G. Jansky Very Large Array. The NRAO is a facility of the National Science Foundation, operated under cooperative agreement by Associated Universities, Inc
References
- Bell (2003) Bell E. F., 2003, The Astrophysical Journal, 586, 794
- Bell et al. (2005) Bell E. F. et al., 2005, The Astrophysical Journal, 625, 23
- Best et al. (2005) Best P. N., Kauffmann G., Heckman T. M., Brinchmann J., Charlot S., Ivezić Ž., White S. D. M., 2005, Monthly Notices of the Royal Astronomical Society, 362, 25
- Bonzini et al. (2013) Bonzini M., Padovani P., Mainieri V., Kellermann K. I., Miller N., Rosati P., Tozzi P., Vattakunnel S., 2013, Monthly Notices of the Royal Astronomical Society, 436, 3759
- Cameron (2011) Cameron E., 2011, Publications of the Astronomical Society of Australia, 28, 128
- Chabrier (2003) Chabrier G., 2003, Publications of the Astronomical Society of the Pacific, 115, 763
- Chi et al. (2013) Chi S., Barthel P. D., Garrett M. A., 2013, Astronomy & Astrophysics, 550, A68
- Condon et al. (1991) Condon J. J., Huang Z.-P., Yin Q. F., Thuan T. X., 1991, The Astrophysical Journal, 378, 65
- Deller et al. (2014) Deller A. T., Middelberg E., 2014, The Astronomical Journal, 147, 14
- Donley et al. (2012) Donley J. L. et al., 2012, The Astrophysical Journal, 748, 142
- Giacconi et al. (2001) Giacconi R. et al., 2001, The Astrophysical Journal, 551, 624
- Hickox et al. (2014) Hickox R. C., Mullaney J. R., Alexander D. M., Chen C.-T. J., Civano F. M., Goulding A. D., Hainline K. N., 2014, The Astrophysical Journal, 782, 9
- Karim et al. (2011) Karim A. et al., 2011, The Astrophysical Journal, 730, 61
- Kennicutt, Jr. (1998) Kennicutt, Jr. R. C., 1998, The Astrophysical Journal, 498, 541
- Kewley et al. (2000) Kewley L. J., Heisler C. A., Dopita M. A., Sutherland R., Norris R. P., Reynolds J., Lumsden S., 2000, The Astrophysical Journal, 530, 704
- Middelberg et al. (2011) Middelberg E. et al., 2011, Astronomy & Astrophysics, 526, A74
- Middelberg et al. (2013) Middelberg E. et al., 2013, Astronomy & Astrophysics, 551, A97
- Norris et al. (2007) Norris R. P., Tingay S., Phillips C., Middelberg E., Deller A., Appleton P. N., 2007, Monthly Notices of the Royal Astronomical Society, 378, 1434
- Padovani et al. (2011) Padovani P., Miller N., Kellermann K. I., Mainieri V., Rosati P., Tozzi P., 2011, The Astrophysical Journal, 740, 20
- Parra et al. (2010) Parra R., Conway J. E., Aalto S., Appleton P. N., Norris R. P., Pihlström Y. M., Kewley L. J., 2010, The Astrophysical Journal, 720, 555
- Rees et al. (2016) Rees G. A. et al., 2016, Monthly Notices of the Royal Astronomical Society, 455, 2731
- Schinnerer et al. (2004) Schinnerer E. et al., 2004, The Astronomical Journal, 128, 1974
- Schinnerer et al. (2010) Schinnerer E. et al., 2010, The Astrophysical Journal Supplement Series, 188, 384
- Simpson et al. (2013) Simpson C., Westoby P., Arumugam V., Ivison R., Hartley W., Almaini O., 2013, Monthly Notices of the Royal Astronomical Society, 433, 2647
- Wake et al. (2011) Wake D. A. et al., 2011, The Astrophysical Journal, 728, 46
- Whitaker et al. (2011) Whitaker K. E. et al., 2011, The Astrophysical Journal, 735, 86
- Wuyts et al. (2011) Wuyts S. et al., 2011, The Astrophysical Journal, 738, 106
- Wuyts et al. (2007) Wuyts S. et al., 2007, The Astrophysical Journal, 655, 51