A Baryonic Effect on the Merger Timescale of Galaxy Clusters
Abstract
Accurate estimation of the merger timescale of galaxy clusters is important to understand the cluster merger process and further the formation and evolution of the large-scale structure of the universe. In this paper, we explore a baryonic effect on the merger timescale of galaxy clusters by using hydrodynamical simulations. We find that the baryons play an important role in accelerating the merger process. The merger timescale decreases with increasing the gas fraction of galaxy clusters. For example, the merger timescale is shortened by a factor of up to 3 for merging clusters with gas fractions , compared with the timescale obtained with zero gas fractions. The baryonic effect is significant for a wide range of merger parameters and especially more significant for nearly head-on mergers and high merging velocities. The baryonic effect on the merger timescale of galaxy clusters is expected to have impacts on the structure formation in the universe, such as the cluster mass function and massive substructures in galaxy clusters, and a bias of “no-gas” may exist in the results obtained from the dark matter-only cosmological simulations.
Subject headings:
galaxies: clusters: general - large-scale structure of universe - methods: numerical1. Introduction
Groups and clusters of galaxies are assembled by mergers and accretion of small structures (e.g., dark matter halos and galaxies) in the Cold Dark Matter (CDM) cosmology (e.g., Kravtsov & Borgani, 2012). Mergers play a central role in the structure formation processes and have been extensively studied through numerical simulations (Lacey & Cole 1994; Navarro et al. 1995; Jenkins et al. 2001; Fakhouri et al. 2010; Genel et al. 2008; for analytical models and observations, see Lacey & Cole 1993; Okabe & Umetsu 2008). Most of the simulations that address the statistical properties of the mergers (e.g., the merger rate, the cluster mass function, and substructures of groups and clusters) are dark matter-only simulations and the gastrophysics of baryonic materials is ignored. Ignoring the gastrophysics is at least due to the following reasons: (1) dark matter (DM) dominates the gravitational field; and (2) it is computationally difficult for hydrodynamical simulations to reach sufficiently high spatial resolutions and statistical precisions simultaneously. However, the negligibility of the baryonic effects, particularly on the scale of galaxy clusters (), is not always self-evident (Stanek et al., 2009; Cui et al., 2012). In some simulations, gastrophysics has been implemented to understand the behaviors of baryonic materials in the mergers (e.g., Poole et al., 2006; ZuHone, 2011).
In this work, we show that the baryonic materials111In this paper, the baryonic materials mainly refer to the hot gas in the DM halos of galaxy clusters, and stars and cold gas in galaxies are not taken into account due to their low mass fractions ( of the total matter; see Dai et al. 2010; Laganá et al. 2011; Wu et al. 2015) in the galaxy clusters. play an important role in the merger of two clusters and help to accelerate the merging process, which suggests that a bias of “no-gas” exists in the current DM-only cosmological simulations (hereafter denoted as the “no-gas” bias). Note that in the numerical studies on the merger timescale of galaxies by Jiang et al. (2008, 2010) and Boylan-Kolchin et al. (2008), dynamical friction among the collisionless (i.e., DM or stars) particles plays the dominant role in the energy and angular momentum dissipation during the merger. The hot gas in the DM halo of those merging galaxies has hardly any effect due to its little amount (see the observational baryon fractions in systems with different scales in Dai et al. 2010 and references therein). However, the fraction of baryonic matters to the total mass in clusters can be significantly larger, approaching to the cosmic mean value (; see Battaglia et al. 2013; Mantz et al. 2014). The effect of the dissipative motion of baryons (unlike that of the collisionless DM particles) on the merger timescale of galaxy clusters, is still poorly studied. In this work, we perform a series of hydrodynamical (and DM-only) simulations of mergers of galaxy clusters to single out the baryonic effect on the merger processes. We find that the merger processes are significantly accelerated in the hydrodynamical simulations and the merger timescale can be shortened by a factor of up to 3, compared with those obtained from the DM-only simulations.
This paper is organized as follows. In Section 2, we describe our numerical simulations of mergers of two galaxy clusters and the method to estimate their merger timescales. In Section 3, we present our simulation results of the baryonic effect on the merger timescale and its dependence on the physical parameters of the mergers. We also develop a toy model to quantitatively interpret those results obtained from the simulations. In Section 4, we discuss some possible implications of the shortening of the merger timescales caused by the baryonic effect. Finally, conclusions are summarized in Section 5.
2. Method
2.1. The Numerical Simulations
We perform numerical simulations for the mergers between two galaxy clusters, by using the smoothed particle hydrodynamics (SPH) code, GADGET-2 (Springel et al., 2001; Springel, 2005). The galaxy clusters in the simulations are simplified as the spherical halos consisting of collisionless DM particles and collisional gas particles. The gas mass fraction of galaxy clusters is defined by the ratio of the gas mass to the total mass within the virial radius. The initial gas density profile is assumed to follow the Burkert profile (Burkert, 1995), and is normalized according to the assumed gas fraction. The similar runs are described in Zhang et al. (2014, 2015) (see detailed settings of the initial conditions therein). The gas is assumed to be adiabatic in the simulations, i.e., neither radiative cooling nor energetic feedback is involved. The masses of the gas and the DM particles are and , respectively. We have chosen other different mass resolutions (e.g., two times lower or five times higher than the above settings) to examine the convergence of our simulation results and found that all the results related to the purpose of this work are converged.
The settings of the initial merger parameters, i.e., the masses of the primary and the secondary clusters and (), their mass ratio , gas fraction , initial relative velocity , and the impact parameter , are summarized in Table 1. For each parameter set (), we choose several different gas fractions to explore the dependence of the merger timescales on the gas fraction.
| 2 | 0.0, 0.15 | 500 | 0 | |
| 1, 2, 4 | 0.0, 0.05, 0.1, 0.15 | 250, 500, 750, 1000 | 0 | |
| 1, 2 | 0.0, 0.05, 0.1, 0.15 | 500, 1000 | 100, 200, 500, 1000 | |
| 1, 2, 4 | 0.0, 0.15 | 500, 1000 | 0 |
2.2. The Merger Timescales
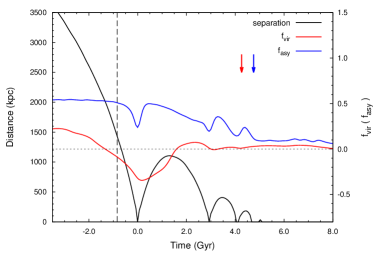
The merger timescale, denoted by , can be estimated from the snapshots of the simulations, which is defined as the time duration between the moment when the center of the secondary cluster first crosses the virial radius of the primary one () and the moment when the system finally reaches the relaxation state (; see Eq. 4 below), i.e.,
| (1) |
The relaxation time can be identified in the following approaches based on either the time evolution of virial factor or the asymmetry index, which reveals the evolution of the dynamical state or the morphology of the merger system.
-
1.
The virial factor () is defined by
(2) where and are the kinetic and the potential energy of the merger system, respectively, and is a surface pressure term (Equations (5.126)–(5.129) in Mo et al. 2010; see also Poole et al. 2006; Ricker 1998). Poole et al. (2006) show that the virial factors for the gas and for the DM track similar trends, although the oscillating evolution of the gas virial factor damps faster than that of the DM virial factor. In this work, the virial factor is calculated from the DM particles located within the radius (where is defined as the virial radius of the galaxy cluster with mass )222We have checked that the virial factor is not sensitive to the value of the selected radius if it is in the range of .. The moment for the “completion” of the virialization process () is defined as the time point after which the system maintains and the variance of has been smaller than continuously for more than .
-
2.
The asymmetry index of the merger system () is defined by
(3) where is the mass surface density distribution of the original merger system, and is the merger system transformed by rotating the original one with around the position of the maximum of the surface mass density. The summation includes all the pixels of the 2-dimensional surface density image (see Conselice et al. 2000, where a similar variable is used to quantify galaxy morphologies). The virialization moment () is defined as the time point when the system starts to maintain .
Finally, we define the relaxation moment of the merger system in this study as
| (4) |
As an example, Figure 1 shows the evolution of the separation between two merging clusters and the corresponding evolutions of the virial factor and the asymmetry index of the merging system. We find that in most of our simulations, the relaxation moment is close to the moment of the third or fourth pericentric passages, which can be seen from the example case illustrated in Figure 1.
3. Results
3.1. The Baryonic Effect on the Merger Timescales
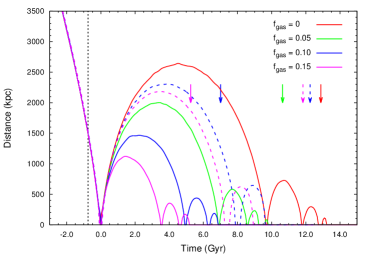
Figure 2 shows the evolution of the separation between the mass centers of the two merging clusters, for mergers with different gas fractions. The solid lines represent those mergers of which both the gas fractions of the two progenitor clusters are 0 (red), 0.05 (green), 0.10 (blue), and 0.15 (magenta), respectively. As seen from the solid lines, the first apocenter distance decreases with increasing . The first apocenter distance for the case with is smaller than that for the case with by a factor of , and correspondingly the time duration between the primary and the secondary pericentric passages is smaller by about a similar factor. The arrows in the figure indicate the relaxation moments of the mergers. For the DM-only case (), the merger timescale can be as long as , close to the age of the universe. However, for the case with , the timescale is about , approximately half of the DM-only one. Thus, the higher gas fraction produces a shorter merger timescale. The figure suggests that the baryons have a remarkable effect on the merger processes and they help to accelerate the virialization of the merging system.
The baryonic effect on the merger timescale can be understood in the following way. The collisionless DM halos pass through each other after the pericentric passage; however, the collisional gas does not. The gas pressure impedes the gas from moving with its DM hosts and leaves the gas to be around the mass center of the entire system. The gas contributes an additional gravitational force from the center, which drags the runaway DM particles to fall back more quickly and makes them experience more dynamical friction at the relatively early stage. Though the gas mass is only around one tenth of the total cluster mass, the distance between the gas mass center and the DM halo is approximately half of the distance between the DM haloes. Since the gravity is inversely proportional to the square of the distance, the gravitational force contributed by the gas mass can be significant compared with that contributed by the DM halo mass.
We run two additional simulations (shown as the dashed lines in Figure 2) to support the above scenario. These two simulations have the same initial merger parameters as the others shown in Figure 2, but the gas fraction of the second cluster is zero and that of the primary cluster is 0.15 (blue dashed line) or 0.225 (magenta dashed line). The gas fractions of the entire merger systems for the above two simulations are and , the same as those two shown by the solid blue and the solid magenta lines, respectively. However, there is no collision of two gas halos in those two simulations. As seen from Figure 2, the mergers in which the gas halos collide have much shorter merger timescales than those without gas halo collisions, which implies that the additional gravitational potential contributed by the gas left around the center of mass of the entire system after the pericentric passage plays the dominant role in the baryonic effect on the merger timescale. Hereafter in this work the two merging clusters are assumed to have a same gas fraction.
A toy model is developed in Section 3.3 below to describe the above scenario quantitatively.
3.2. Dependence of the Merger Timescales on the Physical Parameters of the Merger Systems
Figure 3 shows the dependence of the merger timescale on the physical parameters of the merger systems. The points represent the timescales measured from the numerical simulations, and the solid lines represent the estimates obtained from the toy model (described in Section 3.3 below). Panels (a) and (c) of the figure show the merger timescale as a function of mass ratios for those mergers with initial relative velocities and , respectively. Panels (b) and (d) show the merger timescale as a function of the impact parameter and the mass of the primary cluster with different gas fractions, respectively. As seen from the figure, the merger timescales for the mergers with are always shorter than those with , given the same other parameters. The figure suggests that the merger process is accelerated due to the presence of the gas component for a wide range of physical parameters.
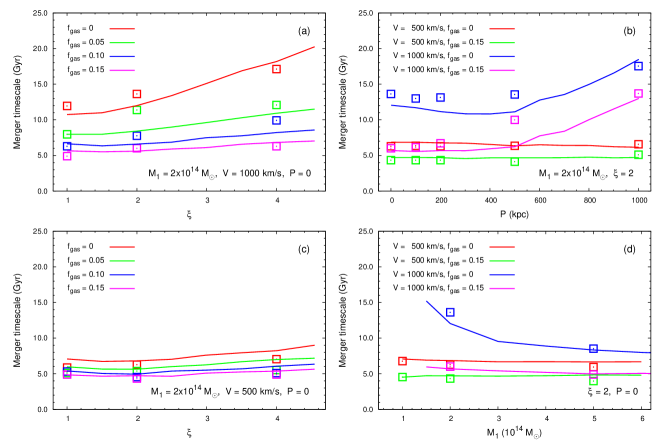
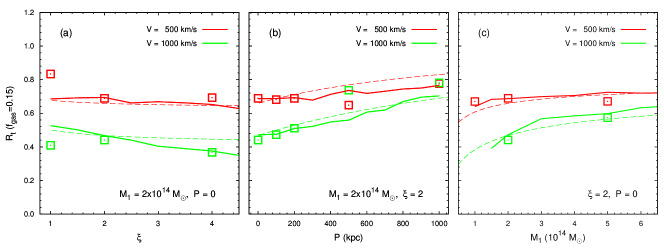
We use the ratio of the merger timescale () estimated from the run with to that with (i.e., DM-only simulations) to quantify the baryonic effect revealed in Figure 3. Figure 4(a)–(c) present the merger timescale ratios as a function of mass ratios, impact parameters, and the mass of the primary cluster, respectively. For each panels, we show the results for both and . From the figure, we find the following main points.
-
1.
The merger timescale ratios are smaller than 1, which indicates the baryonic effect revealed in Figure 3 above.
-
2.
The merger timescale ratios obtained with are smaller than those with (except for the mergers with large impact parameters, e.g., ), which suggests that the baryonic effect becomes more significant for those stronger collisions with high relative velocities. This dependence on can be understood as follows. The strength of the dynamical friction drops significantly when the separation between the two clusters gets larger, because the mass density is low at the cluster outskirts (see Eq. A2). For a relatively high initial relative velocity, the additional gravitational drag contributed by the baryons plays a more remarkable role in enhancing the efficiency of the dynamical friction by shortening the apocenter distance and the orbital period, particularly at the early merger stage.
-
3.
The timescale ratio does not significantly correlate with the mass ratio or the mass of the primary cluster for both the low and the high relative velocity mergers (i.e., ; panels a and c). The baryonic effect on the merger timescale only mildly depends on the merger parameters and . For the high relative velocity mergers, the timescale ratio shows a slightly decreasing trend when . Because the circular velocity of the cluster with mass at the virial radius is , the role of the baryons is more significant when , compared with that in the low-velocity mergers (due to the similar argument in the above item).
-
4.
The dependence on the impact parameter (panel b) shows different behavior for different . The timescale ratio increases with increasing impact parameter for mergers with . However, for the low-velocity mergers (i.e., ), the timescale ratio is roughly constant () for mergers with a large range of impact parameters from to . These results can be understood in the scenario proposed in Section 3.1 as follows. The significance of the baryonic effect on the merger timescale depends on the strength of the collision between the gas halos and decreases with increasing primary pericenter distances of the merger. For the low-velocity mergers, the primary pericenter distances are not sensitive to the impact parameter. For example, for the mergers with ), the pericenter distances range from 0 to , when is from 0 to . However, when and (with fixing the rest parameters), the pericenter distance is up to . 333These primary pericenter distances estimated from the simulations are generally consistent with those analytically calculated from the two-body interacting systems (see Equations (3)–(6) in Khochfar & Burkert 2006). This explains the almost independence of the timescale ratio on the impact parameter for the low-velocity mergers shown in Figure 4(b).
According to the dependence behavior of the ratios of the merger timescales and the gas fraction smaller than , we fit our simulation results to the following form (shown as the dashed lines in Figure 4),
| (5) |
where .
Note that we mainly investigate the major mergers between galaxy clusters () in this study. For minor mergers (e.g., ), the baryonic effect is not so significant, because (1) the tidal force and the ram pressure is more effective in removing gas from the secondary cluster in minor mergers; and (2) the gas fractions in galaxy groups are significantly smaller than those in galaxy clusters (Sun, 2012).
3.3. The Toy Model
We construct a simple toy model to quantitatively understand the scenario proposed in Section 3.1. In the model, the two clusters are approximated as two point masses (or particles) during the merger. The motion of each point mass is controlled by the following three types of forces: the gravitational attraction from the DM-halo of the other cluster (; excluding the gas component, if any); the dynamical friction () due to the motion of one cluster in the gravitational field of the other cluster; and the additional gravitational force contributed by the baryons () dragged around the mass center of the system after the primary pericentric passage. The total force acting on each of the two particles (represented by the subscripts ) can be written as
| (6) |
The baryonic effect discussed in Sections 3.1 and 3.2 is included by the third term , which is the main driver accelerating the merging process. The orbits of each particle can be solved from the Newtonian equations of motion. In this section, we summarize the main results obtained from the toy model and compare them with those from the numerical simulations. The detailed implementation of the toy model and the calculation method are described in Appendix A.
The merger timescales estimated from the toy model are shown as the solid lines in Figure 3, where the model adopts the same parameters used in the corresponding simulations. As seen from Figure 3, the toy model reproduces the merger timescales measured from the numerical simulations for most of the mergers and also the dependence of the merger timescale on the physical parameters of the mergers. This consistence not only indicates the robustness of the toy model, but also implies the feasibility of the model to provide a simple and fast way to estimate the merger timescale of galaxy clusters. From this toy model, we draw the following conclusions.
- •
-
•
The additional gravitational drag contributed by the baryons () is responsible for the acceleration of the virialization process for mergers with significant amount of gas. Without the gas drag term in Equation (6), the toy model444Here, we adopt the gravitational force between the two clusters, instead of the force between the two DM halos in Equation (6) (i.e., in Eqs. A1 and A2). cannot reproduce the dependence of the merger timescale on gas fractions shown in Figure 3.
4. Discussion
We have demonstrated that the dissipative baryonic material can play an important role in accelerating the merger processes of galaxy clusters in Section 3. The baryonic effect is relatively more significant for high relative velocity mergers, compared with low relative velocity ones, as shown in Figures 3 and 4. Note that the pairwise velocity distribution of DM halos () in cosmological simulations shows its peak at (Thompson & Nagamine, 2012; Bouillot et al., 2014), and the fraction of the cluster mergers with high relative velocity can be up to . Thus we expect that the baryonic effect is important in the formation and evolution of massive clusters. However, in most of the current cosmological simulations (with comoving box size larger than a few hundreds of Mpc), the dissipative nature of the gas component is not considered, which may lead to the “no-gas” bias in those DM-only simulations. In this section, we discuss the possible impacts of the baryonic effect on the mass function of galaxy clusters at the high-mass end and the distribution of the massive sub-structures in galaxy clusters as follows.
-
•
First, the baryonic effect may have impacts on the cluster mass function at the high-mass end. Since the major merger is an important channel for the growth of galaxy clusters (Fakhouri & Ma, 2008), a massive cluster may be formed earlier in a simulation including the baryonic effect, compared with that formed in a simulation without including the baryonic effect. As a consequence, the high-mass end of the cluster mass function at a given redshift might be higher than the expectation from the DM-only simulations. Stanek et al. (2009) made a comparison between the cluster mass function resulting from DM-only (or gravity-only) simulations and that from simulations involving complex gas physics and found some difference (; see also Cui et al. 2012, 2014; Cusworth et al. 2014; Martizzi et al. 2014; Bocquet et al. 2015). To extract a realistic cluster mass function from simulations, we note that the following points need to be taken into consideration. (1) The halo finding algorithm used in simulations does not consider the dynamical state of halos, which may weaken the baryonic effect revealed in this paper. And (2) the box size of the simulations in Stanek et al. (2009), Cusworth et al. (2014) (i.e., ), and Cui et al. (2012, 2014) (i.e., ) may also limit the statistical precision at the high-mass end of the mass function. A larger cosmological volume of hydrodynamical simulations and more sophisticated mass function calibration are required to investigate the possible “no-gas” bias in the cluster mass function.
-
•
The baryonic effect may have impacts on the spatial and mass distribution of the massive substructures in galaxy clusters. The survival time for the subclusters is suppressed by a factor of up to 3 in the mergers with , compared with the DM-only mergers (see the example in Figure 2). The subhalo mass function of the galaxy clusters at the massive end (, where and are the subhalo mass and the host halo mass, respectively; see van den Bosch & Jiang 2014) might be overestimated in the DM-only simulations. Thus the abundance of the massive subhalos in galaxy clusters estimated from the simulations is expected to be closer to the expectations from the analytical model in van den Bosch & Jiang (2014) (see figs. 4 and 5 therein), after the baryonic effect is considered.
Note that the baryonic effect revealed in this paper is obtained under a simplified model of the galaxy cluster structure and an assumption of adiabatic gas dynamics. According to the results of the current cosmological simulations, the effects of some other non-gravitational processes (e.g., radiative cooling, energetic feedback) implemented in the simulations (Gnedin et al., 2004, 2011; Teyssier et al., 2011; Planelles et al., 2013) could be significant on the gas fraction profile, but mild on the total gas fraction. For example, active galactic nuclei (AGN) heating may expel the gas out from the cluster center (Battaglia et al., 2013), which might weaken the baryonic effect on the merger timescale of galaxy clusters discussed in this paper. To further quantitatively understand the degree in affecting the acceleration of the cluster mergers caused by the non-gravitational processes in realistic structure formation, further analysis and simulations will be needed in the future.
5. Conclusion
In this paper, we present a baryonic effect on the merger timescale for the mergers between galaxy clusters. A series of numerical simulations are performed for mergers between two galaxy clusters with different settings of the parameters (). The baryons are found to play an important role in accelerating the merger process. Our findings are summarized as follows.
-
•
The merger timescale of galaxy clusters strongly depends on their gas fractions. The merger timescales decreases with increasing the gas fraction. We explore the parameter space for the mergers and find that the baryonic effect is significant for a wide range of merger parameters. As an example, the merger timescale is shortened by a factor of up to 3 for mergers with gas fraction 0.15, compared with that with zero gas fraction (DM-only mergers; see Figure 4). That baryonic effect can be understood as follows. While the DM halos of the two clusters in the merger pass through each other after the primary pericentric passage, their gas is however impeded at and around the mass center of the entire merger system. As a result, the central gas provides an additional gravitational drag to the DM halos and the DM halos experience more dynamical friction when passing through each other, which accelerates the merger process.
-
•
We explore the dependence of the baryonic effect on the merger parameters (). We find the following points. (1) The above baryonic effect (i.e., the dependence of the merger timescale on the gas fraction) depends on the initial relative velocity; and generally, the effect is more remarkable if the relative velocity is higher. As an example, the merger timescales for mergers with can be 2–3 times shorter than those DM-only mergers when . However, for the same mergers but with , the merger timescales for are only 1–2 times smaller than those of the DM-only cases. (2) The baryonic effect does not significantly depend on the mass of the primary cluster and the mass ratio. (3) The baryonic effect on the merger timescale is weakened in the case with a large impact parameter (e.g., ), even if the initial relative velocity is high (i.e., ).
The baryonic effect on the merger timescale of galaxy clusters may have impacts on the structure formation in the universe, especially the cluster mass function and massive substructures in galaxy clusters, which may result in the “no-gas” bias in the current DM-only cosmological simulations. It is important to understand the “no-gas” bias and its implications in the future studies.
This research was supported in part by the National Natural Science Foundation of China under nos. 11273004, 11373031, and the Strategic Priority Research Program “The Emergence of Cosmological Structures” of the Chinese Academy of Sciences, Grant No. XDB09000000.
Appendix A The toy model
We construct a toy model to quantitatively examine the scenario proposed in Section 3.1 for the baryonic effect on accelerating the merger process of two galaxy clusters (see Section 3.3). In this toy model, the merger between two galaxy clusters is modeled by the motion of two point masses, each representing one of the two progenitor galaxy clusters. Each particle is exerted by three different forces, i.e., the gravitational force due to the other particle (or the corresponding DM halo), the dynamical friction due to its relative motion in the other DM halo, and the additional gravitational drag contributed by the baryons (see Eq. 6). The specific implementation of each term in the calculation is given as follows.
-
•
The acceleration of the particle given by the gravitational attraction from the DM halo mass of the other particle ) is,
(A1) where , is the distance between the two particles, and represent the position and the velocity vectors of the particle , respectively, and is the gravitational constant.
-
•
The dynamical friction is given by the Chandrasekhar formula (see Equation (8.7) in Binney & Tremaine 2008) and the deceleration due to this dynamical friction is given by
(A2) where is approximately the mass fraction of the particle traveling through the other cluster , is the error function, and , , and are the relative velocity of the two clusters and the velocity dispersion of the cluster , respectively. The Coulomb logarithm in Equation (A2) is set as (Springel et al., 2001; Kang et al., 2005; Boylan-Kolchin et al., 2008). The mass density of the DM halo is assumed to follow the truncated NFW profile (Navarro et al., 1997),
(A3) where are the scale density, the scale radius, the concentration parameter, and the virial radius of the cluster , respectively. The truncation scale is defined as in this work. We introduce a free parameter to regulate the strength of the dynamical friction, which is calibrated by the DM-only simulations. We find that gives a good match between the model and the simulations (see Figure 6 as an example).
-
•
The additional gas drag is assumed to be the gravitational force from the gas left around the center of mass of the system () after the primary pericentric passage of the two merging clusters. In the toy model, the force from the left gas halo is switched on at the primary pericentric passage, when the center of the gas halo is assumed to be located at the center of mass of the system and have the same velocity as the mass center. The acceleration of the particle contributed by this drag can be written as,
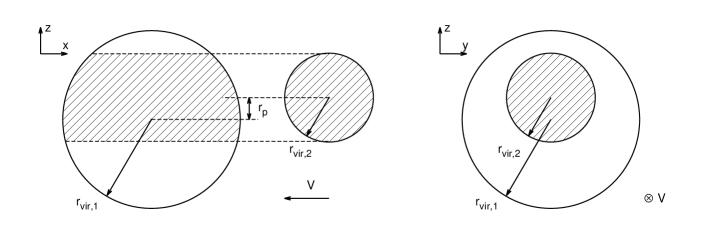
(A4) where , is the distance between the position of the particle and the center of the gas halo, and represents the gas mass within the radius . The gas density distribution is assumed to follow the Hernquist model truncated at the radius ,
where and is the scale density and scale radius, respectively. The distribution is normalized by the gas halo mass within , i.e.,
(A5) where is a geometric factor as a function of the pericenter distance . We estimate analytically from the Keplerian motion of the two-body system by using Equations (3)–(6) in Khochfar & Burkert (2006). Figure 5 shows the schematic diagram for the definition of the geometric factor , which is the ratio of the shaded volume to the total volume of the two clusters. The factor is assumed to be the fraction of the gas mass impeded in the center of the merger system after the primary pericentric passage. The free parameter gives a good match between the model and the simulations (see Figure 3).
We solve Equation (6) by the fourth-order Runge-Kutta method. We also use the Kustaanheimo-Stiefel regularization to avoid the singularity in the numerical calculations (see chap. 2 in Stiefel & Scheifele 1975 for more details). The relaxation moment of the merger in the toy model is defined as the moment of the th pericentric passage, if the time duration between the th and the th pericentric passages is smaller than of the time duration between the primary and the secondary pericentric passages. We find ranges between 3–6 in most of the models, roughly consistent with the results from the numerical simulations.
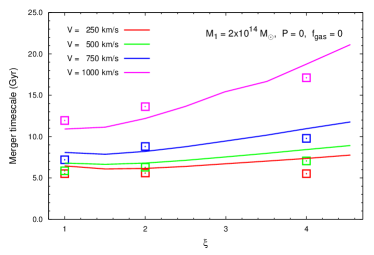
Figure 6 shows the merger timescales obtained from both the toy model and the DM-only numerical simulations for mergers with different mass ratios and initial relative velocities. As seen from this figure, the merger timescales resulting from the toy model are well consistent with those obtained from the numerical simulations. The gravity between the clusters and the dynamical friction (i.e., the first two terms in Eq. 6) could model the merger timescale well for the DM-only mergers without baryons, but not the dependence of the merger timescale on gas fractions for mergers with baryons. This implies the importance of the additional gas drag (i.e., the third term in Eq. 6) in modeling the baryonic effect on the merger timescale for the galaxy clusters.
References
- Battaglia et al. (2013) Battaglia, N., Bond, J. R., Pfrommer, C., & Sievers, J. L. 2013, ApJ, 777, 123
- Binney & Tremaine (2008) Binney, J., & Tremaine, S. 2008, Galactic Dynamics (2nd ed.; Princeton, NJ: Princeton Univ. Press)
- Bocquet et al. (2015) Bocquet, S., Saro, A., Dolag, K., & Mohr, J. J. 2015, arXiv:1502.07357
- Bouillot et al. (2014) Bouillot, V. R., Alimi, J.-M., Corasaniti, P.-S., & Rasera, Y. 2014, arXiv:1405.6679
- Boylan-Kolchin et al. (2008) Boylan-Kolchin, M., Ma, C.-P., & Quataert, E. 2008, MNRAS, 383, 93
- Burkert (1995) Burkert, A. 1995, ApJ, 447, L25
- Conselice et al. (2000) Conselice, C. J., Bershady, M. A., & Jangren, A. 2000, ApJ, 529, 886
- Cui et al. (2012) Cui, W., Borgani, S., Dolag, K., Murante, G., & Tornatore, L. 2012, MNRAS, 423, 2279
- Cui et al. (2014) Cui, W., Borgani, S., & Murante, G. 2014, MNRAS, 441, 1769
- Cusworth et al. (2014) Cusworth, S. J., Kay, S. T., Battye, R. A., & Thomas, P. A. 2014, MNRAS, 439, 2485
- Dai et al. (2010) Dai, X., Bregman, J. N., Kochanek, C. S., & Rasia, E. 2010, ApJ, 719, 119
- Fakhouri & Ma (2008) Fakhouri, O., & Ma, C.-P. 2008, MNRAS, 386, 577
- Fakhouri et al. (2010) Fakhouri, O., Ma, C.-P., & Boylan-Kolchin, M. 2010, MNRAS, 406, 2267
- Genel et al. (2008) Genel, S., Genzel, R., Bouché, N., et al. 2008, ApJ, 688, 789
- Gnedin et al. (2004) Gnedin, O. Y., Kravtsov, A. V., Klypin, A. A., & Nagai, D. 2004, ApJ, 616, 16
- Gnedin et al. (2011) Gnedin, O. Y., Ceverino, D., Gnedin, N. Y., Klypin, A. A., Kravtsov, A. V., Levine, R., Nagai, D., Yepes, G. 2011, arXiv:1108.5736
- Jenkins et al. (2001) Jenkins, A., Frenk, C. S., White, S. D. M., et al. 2001, MNRAS, 321, 372
- Jiang et al. (2008) Jiang, C. Y., Jing, Y. P., Faltenbacher, A., Lin, W. P., & Li, C. 2008, ApJ, 675, 1095
- Jiang et al. (2010) Jiang, C. Y., Jing, Y. P., & Lin, W. P. 2010, A&A, 510, AA60
- Kang et al. (2005) Kang, X., Jing, Y. P., Mo, H. J., Börner, G. 2005, ApJ, 631, 21
- Khochfar & Burkert (2006) Khochfar, S., & Burkert, A. 2006, A&A, 445, 403
- Kravtsov & Borgani (2012) Kravtsov, A. V., & Borgani, S. 2012, ARA&A, 50, 353
- Lacey & Cole (1993) Lacey, C., & Cole, S. 1993, MNRAS, 262, 627
- Lacey & Cole (1994) Lacey, C., & Cole, S. 1994, MNRAS, 271, 676
- Laganá et al. (2011) Laganá, T. F., Zhang, Y.-Y., Reiprich, T. H., & Schneider, P. 2011, ApJ, 743, 13
- Mantz et al. (2014) Mantz, A. B., Allen, S. W., Morris, R. G., et al. 2014, MNRAS, 440, 2077
- Martizzi et al. (2014) Martizzi, D., Mohammed, I., Teyssier, R., & Moore, B. 2014, MNRAS, 440, 2290
- Mo et al. (2010) Mo, H., van den Bosch, F. C., & White, S. 2010, Galaxy Formation and Evolution, Cambridge, UK: Cambridge University Press
- Navarro et al. (1995) Navarro, J. F., Frenk, C. S., & White, S. D. M. 1995, MNRAS, 275, 56
- Navarro et al. (1997) Navarro, J. F., Frenk, C. S., & White, S. D. M. 1997, ApJ, 490, 493
- Okabe & Umetsu (2008) Okabe, N., & Umetsu, K. 2008, PASJ, 60, 345
- Planelles et al. (2013) Planelles, S., Borgani, S., Dolag, K., et al. 2013, MNRAS, 431, 1487
- Poole et al. (2006) Poole, G. B., Fardal, M. A., Babul, A., et al. 2006, MNRAS, 373, 881
- Ricker (1998) Ricker, P. M. 1998, ApJ, 496, 670
- Springel et al. (2001) Springel, V., Yoshida, N., & White, S. D. M. 2001, NewA, 6, 79
- Springel et al. (2001) Springel, V., White, S. D. M., Tormen, G., & Kauffmann, G. 2001, MNRAS, 328, 726
- Springel (2005) Springel, V. 2005, MNRAS, 364, 1105
- Stanek et al. (2009) Stanek, R., Rudd, D., & Evrard, A. E. 2009, MNRAS, 394, L11
- Stiefel & Scheifele (1975) Stiefel, E. L., & Scheifele, G. 1975, Linear and regular celestial mechanics. Perturbed two-body motion. Numerical methods. Canonical theory., Translated from the English edition, Moskva: Nauka, 303 p.
- Sun (2012) Sun, M. 2012, New Journal of Physics, 14, 045004
- Teyssier et al. (2011) Teyssier, R., Moore, B., Martizzi, D., Dubois, Y., & Mayer, L. 2011, MNRAS, 414, 195
- Thompson & Nagamine (2012) Thompson, R., & Nagamine, K. 2012, MNRAS, 419, 3560
- van den Bosch & Jiang (2014) van den Bosch, F. C., & Jiang, F. 2014, arXiv:1403.6835
- Wu et al. (2015) Wu, H.-Y., Evrard, A. E., Hahn, O., et al. 2015, MNRAS, 452, 1982
- Zhang et al. (2014) Zhang, C., Yu, Q., & Lu, Y. 2014, ApJ, 796, 138
- Zhang et al. (2015) Zhang, C., Yu, Q., & Lu, Y. 2015, ApJ, 813, 129
- ZuHone (2011) ZuHone, J. A. 2011, ApJ, 728, 54