Vortex matter freezing in Bi2Sr2CaCu2O8 samples with a very dense distribution of columnar defects
Abstract
We show that the dynamical freezing of vortex structures nucleated at diluted densities in Bi2Sr2CaCu2O8 samples with a dense distribution of columnar defects, with kG, results in configurations with liquid-like correlations. We propose a freezing model considering a relaxation dynamics dominated by double-kink excitations driven by the local stresses obtained directly from experimental images. With this model we estimate the relaxation barrier and the freezing temperature. We argue that the low-field frozen vortex structures nucleated in a dense distribution of columnar defects thus correspond to an out-of-equilibrium non-entangled liquid with strongly reduced mobility rather than to a snapshot of a metastable state with divergent activation barriers as for instance expected for the Bose-glass phase at equilibrium.
pacs:
74.25.Uv,74.25.Ha,74.25.DwI Introduction
Vortices nucleated in high-temperature superconducting samples Blatter are paradigmatic systems to study the phases frozen in substrates with strong disorder since the relevant energies are easily tuned by changing temperature and magnetic field. Direct imaging techniques Fasano2005 ; Petrovic2009 allow a quantitative analysis of the impact of disorder on the otherwise perfect equilibrium Abrikosov lattice. Magnetic decoration studies Fasano1999 ; Fasano2003 of quenched vortex structures unveiling a large number of vortices has become a promising avenue to perform these studies. Demirdis2011 ; Demirdis2012 ; Demirdis2013 ; Yang2012 ; vanderbeek2012 ; vanderbeek2013 This technique provides a two-dimensional top view at the sample surface of the three-dimensional vortex lattice frozen at . In order to move forward on the quantification of the impact of disorder introduced by defects in the vortex structure, better understanding or modelling of the vortex dynamics during the cooling process is necessary. In this work we address this issue by using vortex-defect interaction force magnitudes obtained from magnetic decoration results as input to a theoretical freezing model considering strongly localized vortices.
In field-cooling magnetic decorations, a high-temperature vortex state is driven into a frozen configuration at , an intermediate temperature between the initial state and the lower temperatures at which experiments are performed. Fasano1999 ; Fasano2003 Having a general quantitative understanding of this freezing process is difficult due to the non-equilibrium and non-stationary nature of the three-dimensional thermally-activated vortex dynamics over pinning barriers. In order to undergo this study is then desirable to find a convenient experimental situation in which the vortex dynamics modelling could be simplified. Therefore we have chosen to study the case of a dense distribution of strong pinning centers such as columnar defects (CD), known to prevail over any other type of cristalline disorder. Civale1990 ; Konczykowski1991 ; Keeshabilitation Vortices are then expected to become individually localized at CD where their thermally-activated motion can be modelled in terms of simple excitations, which drive the system into the putative equilibrium Bose-glass phase. Nelson1993 Although experimental evidence for the Bose-glass dynamics was reported, the equilibration time and whether the frozen structures observed by magnetic decoration can reveal aspects of this phase for a dense distribution of CD remain as important open questions.
In this work we study via magnetic decoration the structural properties of vortex matter nucleated in Bi2Sr2CaCu2O8 samples with a large ratio of CD to vortices, , with kG the matching field. Although transport and magnetic relaxation experiments were performed for the same system vanderbeek1995 ; vanderbeek1995b ; Soret2000 , the structural properties were previously studied only for smaller doses of CD. A complete destruction of the positional and orientational order of the vortex structure is reported. Leghissa1993 ; Dai1994 ; Menghini2003 ; Banerjee2003 ; Menghini2004 ; Banerjee2004 ; Fasano2004 ; Menghini2005 However, for very low CD densities of tens of Gauss, the short-range order of the vortex structure is recovered Dai1994 and a polycristalline structure is observed in magnetic decoration snapshots Menghini2003 ; Banerjee2003 ; Menghini2004 ; Banerjee2004 ; Fasano2004 ; Menghini2005 indicating inter-vortex repulsion remains important even in the presence of such strong pins. As mentioned, the vortex configurations imaged by field-cooling decorations correspond to the state frozen at at which vortex mobility is strongly reduced by the effect of pinning. Pardo1997 ; Fasano2005 Here we show that the quenched structures can be well described with a freezing model that considers that the relaxation dynamics of vortices in a dense CD potential is mainly dominated by double-kink excitations. We estimate the value of the relaxation energy barriers from data of the maximum vortex-defect interaction force obtained from magnetic decoration experiments. This allows us to argue that the imaged vortex structures correspond to a experimental-time resolution limited frozen non-entangled liquid rather than to a snapshot of the Bose-glass phase characterized by metastable states separated by divergent barriers.
II Experimental
The single-crystal of optimally-doped Bi2Sr2CaCu2O8 studied here was grown by the travelling-floating-zone method Li1994 and irradiated by 6 GeV Pb-ions at GANIL. The irradiation dose was chosen in order to obtain a density of CD per square centimeter corresponding to a matching field of kG. Every single ion impact creates an amorphous columnar track with a radius nm, roughly parallel to the c-axis through the entire sample thickness. This gives a bare-pinning energy per unit length per CD at zero temperature of erg/cm.
The studied crystal was characterized by means of differential magneto-optics, Dorosinskii1992 ; Demirdis2011 local Hall-probe magnetometry, Konczykowski1991b and magnetic decoration Fasano2008 techniques. The sample has a critical temperature K, in-plane dimensions of m2, and thickness of some tens of microns. Magneto-optical imaging shows rather homogeneous flux penetration into the crystals and does not reveal any noticeable large-scale surface or bulk defect.
The - phase diagram of Bi2Sr2CaCu2O8 vortex matter with such a dense distribution of CD was obtained by means of local Hall-probe magnetometry up to G, see Fig. 1. These measurements were done using microfabricated 2D-electron-gas Hall-magnetometers that locally probe the sample stray field. Konczykowski1991b Magnetic transmittivity measurements were performed by applying an ac excitation field parallel to a dc field . The Hall data presented here were obtained with an excitation field of Oe rms and 11 Hz. A digital-signal-processing lock-in technique is used to simultaneously measure the in- and out-of-phase components of the fundamental and the third-harmonic signals of the Hall voltage. The fundamental signal was used to obtain the thermodynamic first-order transition line, Pastoriza1994 ; Zeldov1995 , from transmittivity measurements. Konczykowski2006 The third-harmonic signal yields information on the onset of irreversible magnetic behavior at .Konczykowski2006
The structural properties of vortex matter nucleated on the same crystal were directly imaged by means of magnetic decoration experiments. Fasano2008 This study was limited to magnetic fields below 80 Oe since for this sample the technique looses single-vortex resolution at larger vortex densities. The sample was field-cooled from down to 4.2 K in roughly 15 min and magnetic decorations were performed at this base temperature. The structural properties, at the lengthscales of the lattice parameter, correspond to those frozen at . By using quantitative information obtained from magnetic decoration images we will estimate according to the freezing dynamics model presented in Section IV.
III Experimental results
III.1 Vortex phase diagram
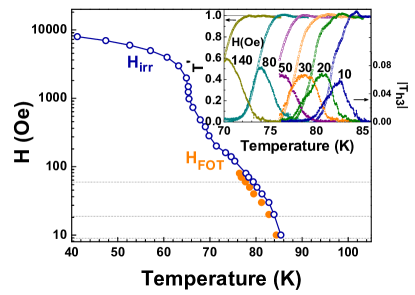
Figure 1 shows the vortex phase diagram of Bi2Sr2CaCu2O8 vortex matter nucleated in samples with a CD density of kG. The first-order, , and irreversibility, , lines are obtained from measuring the sample magnetic response by means of ac Hall magnetometry. Konczykowski2006 The insert shows the temperature evolution of normalized first and third-harmonic signals in the low-field range. The transmittivity is obtained from the in-phase component of the first-harmonic signal, Gilchrist1993 and is highly-sensitive to discontinuities in the local induction, as for example the one entailed at the transition. Pastoriza1994 ; Zeldov1995 The normalized modulus of the third-harmonic signal, , Gilchrist1993 becomes non-negligible at the onset of non-linear response arising from irreversible magnetic properties.
The high-temperature transition is detected in ac transmittivity measurements as a frequency-independent so-called paramagnetic peak that develops in at the same as the jump in local induction detected in dc hysteresis loops. Morozov1996 ; Konczykowski2006 The paramagnetic peak is equivalently observed in versus temperature curves, see Fig. 1. For the studied sample the paramagnetic peak is clearly observed in curves up to 80 Oe. The irreversibility line is identified from the frequency-dependent onset of on cooling. Dolz2014 In the range , monotonically shifts towards lower temperatures on increasing field, whereas for becomes almost field-independent. At larger fields, a monotonous increase of with reducing field is again observed. This field-evolution of the irreversibility line is common to Bi2Sr2CaCu2O8 samples with high-densities of CD and has origin in the three different regimes for the occupation of columnar defects with vortices discussed in Refs. vanderBeek2000, ; vanderbeek2001, .
Figure 1 also indicate with dotted lines the - paths followed during the field-cooling magnetic decoration experiments. For all the imaged vortex structures the system undergoes the melting transition at . This shifting between both lines, although of lesser intensity, was also reported in pristine samples. Dolz2014
III.2 Structural properties of the frozen vortex matter
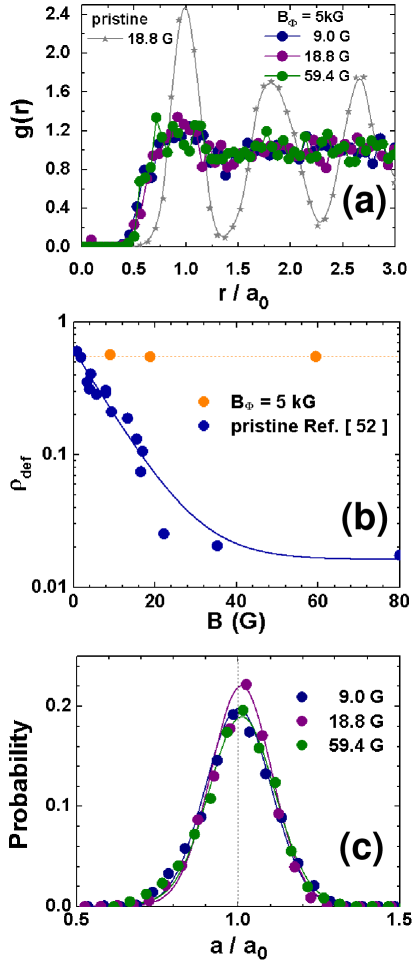
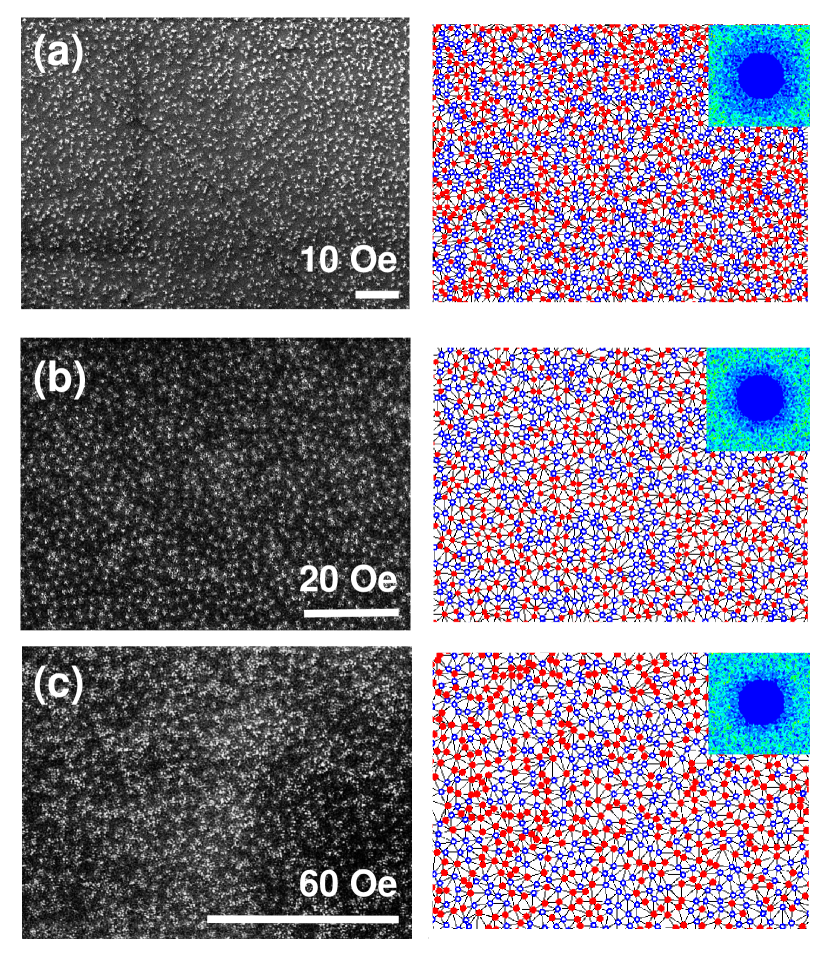
Figure 2 shows snapshots of the vortex structure obtained in field-cooling magnetic decoration experiments at applied fields of 10, 20 and 60 Oe. Due to the finite magnetization of these samples with pinning enhanced by CD, the local induction measured from the vortex density is smaller than the applied field, , 18.8, and 59.4 G, respectively. In this field range vortices are extremely diluted with respect to the random distribution of CD, every vortex unit cell spanning a spatial region having between 80 (60 Oe) and 500 (10 Oe) defects. In this limit, one can expect that the vortex structure presents similar topological order than in the case of pristine samples. Strikingly, the observed vortex structures are amorphous, irrespective of the vortex density within the studied range. These results follow the same trend than magnetic decoration data on samples with a less-dense distribution of CD ( kG) were a complete destruction of translational order was reported. Leghissa1993
The Delaunay triangulations of the right panels of Fig. 2, indicating the first-neighbors for each vortex, reveal that the structures have the non-sixfold coordination typical of an amorphous. The ring-like patterns of the Fourier transform of vortex positions shown in the insert confirm the lack of short-range positional and orientational orders. Indeed, the pair correlation functions of Fig. 3(a) show only one distinguishable peak at the first-neighbors distance, irrespective of significantly increasing the inter-vortex interaction. This contrasts with the obtained for pristine samples that present peaks up to several lattice spacings (see the curve with stars in Fig. 3 (a)). The sixfold coordinated vortices (blue) form very small crystallites containing at best 10 vortices. The density of these vortices is always below 40 % and does not vary significantly on increasing field, see Fig. 3 (b). Quantitatively similar results are obtained for samples with a much more diluted distribution of CD when . Menghini2004 Figure 3 (b) also shows that the density of vortices belonging to topological defects, , is significantly larger in samples with a dense distribution of CD than in the case of vortex matter nucleated in pristine Bi2Sr2CaCu2O8 samples. Fasano2005 However, since magnetic decoration images are snapshots of the vortex structure, distinguishing between an amorphous glassy and a liquid vortex phase is not possible with this technique.
Similar amorphous structures were recently reported for the strongly-pinned vortex matter in pnictide BaFeAs1-xP and Ba(Fe1-xCox)2As2 samples, Demirdis2011 ; Demirdis2013 presenting significant vortex-density fluctuations, more pronounced in the Co-doped system. The disorder of the vortex structure was quantitatively ascribed to the strong inhomogeneous disorder present in the samples. Demirdis2011 On the contrary, in the Bi2Sr2CaCu2O8 samples studied here, vortex density fluctuations are not very strong, as observed in the histograms of shown in Fig. 3 (c). These histograms are well fitted by a symmetric Gaussian distribution with full-width at half-maximum ranging 23-20 %. The data are normalized by the lattice parameter , with obtained from the vortex density measured in magnetic decoration images.
In the field-cooling magnetic decoration experiments performed here, vortex matter is nucleated in the high-temperature liquid phase and vortices have a high mobility since the decoupled pancakes present a low shear viscosity. On cooling, vortex mobility gets reduced at by the effect of the CD pinning potential and the vortex structure gets frozen, at lengthscales of the lattice parameter , in one of the many available metastable states. On further cooling to lower temperatures, vortices accommodate in order to profit from the pinning potential in all their length at lengthscales of the order of coherence length, , a lengthscale that can not be resolved by means of magnetic decoration. As a consequence, the structural properties of vortex matter revealed by magnetic decorations at 4.2 K correspond to those of the structure frozen at . Therefore this is the temperature that has to be considered in order to evaluate elastic and electromagnetic properties of vortex matter observed by means of magnetic decoration. As usually considered in the literature Fasano2005 ; Pardo1997 , it is reasonable to assume since at this temperature pinning becomes dominant over the other energy scales. However, there can be a shift between these two temperatures: The model presented in Section IV will allow us to discuss on the validity of this assumption and its implications.
III.3 Vortex-defect force distributions
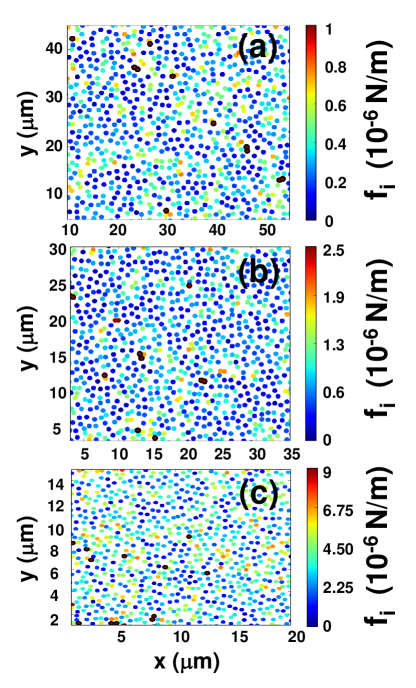
In spite of the absence of important fluctuations in vortex density, the pinning potential generated by a dense distribution of CD produces a strong impact in the lattice structural properties, particularly evident in the spatially inhomogeneous inter-vortex interaction energy and vortex-defect force. We will focus our study in the last magnitude since from its probability distribution we will get the experimental information considered as input to evaluate the typical energy barriers considered in the freezing dynamics model we propose in Section IV. The vortex-defect force is related to the inter-vortex repulsive force, . Figure 4 shows maps of the magnitude of this force per unit length for each vortex , , computed as the modulus of
| (1) |
is the first-order modified Bessel function, the in-plane penetration depth and the vortex line-tension. The sum is performed up to a cut-off radius since does not change significantly when including terms at larger distances. For every magnetic field, is calculated considering the value of the penetration depth at the temperature at which the vortex structure is frozen that we approximate by . We have considered the evolution reported in Ref. Keeshabilitation, for pristine Bi2Sr2CaCu2O8 samples and calculated from the data of the vortex phase diagram shown in Fig. 1; for samples with a density of CD of kG is within 1% this value. vanderBeek2000
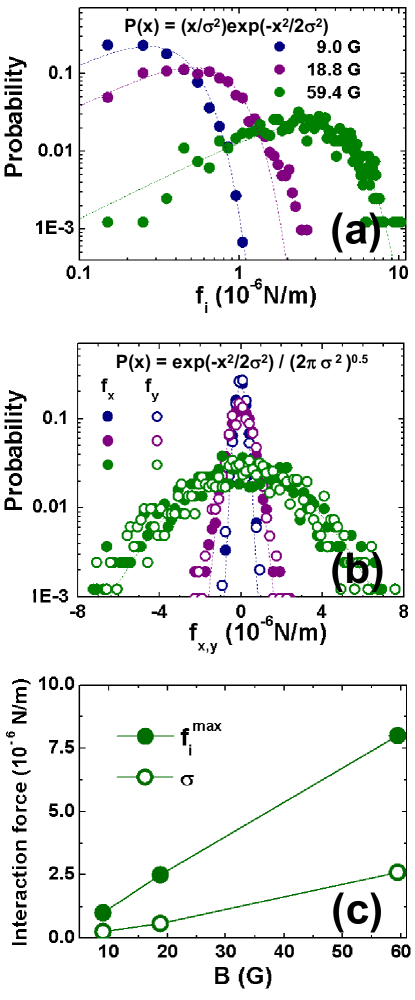
Since the vortex structures frozen during field-cooling processes are close to metastable equilibrium at , non-zero values of can only be ascribed to the force exerted by the CD pinning potential to individual vortices. Therefore the maps are an accurate estimation of the minimum vortex-defect force at the local scale. These maps are highly inhomogeneous and present clusters with larger inter-vortex force magnitude. The histograms of Fig. 5 (a) show that the mode value monotonically enhances with increasing vortex density. In addition, the distributions are not symmetric and have a larger weight in the high-force part. On increasing , the distributions broaden significantly and get more asymmetric.
Figure 5 (b) shows the histograms of the and components of the interaction force, and . In contrast to the distributions, the force-components distributions are symmetric with respect to zero and their width increases with field. The and distributions are properly fitted with Gaussian functions (see dotted lines), implying that the individual components of the force varies at random. Therefore, a Rayleigh functionality should be expected for the distribution of the modulus of the force. The fits shown with dotted lines in Fig. 5 (a) (see the mathematical expression on the top) indicate that the distributions of follow reasonably well this functionality. Therefore the increasing asymmetry of the distributions with comes from the increment of the standard deviation of the Gaussian distributions that follow the components of the force.
Finally, Fig. 5 (c) shows that the dispersion obtained from the Rayleigh fits to the distributions, , as well as the maximum value of the defect-vortex pinning force, , increase monotonically with field. Considering that the CD pinning force is finite and has a maximum value of , extrapolating to higher fields the data shown in Fig. 5 (c) yields at around 4000 G. This suggests a crossover towards vortex configurations with “instersticial vortices”, i.e. not located on a CD, at fields .
Assuming that localized vortices relax the local excess stress by simple single-vortex excitations, linear extrapolation of also allows the estimation of the field at which half-loop excitations are exhausted in favor of double-kink excitations Nelson1993 . This occurs when . Hence, for we predict the extinction of half-loops at very short times. Comparing with the maximum field we analyze, , we can argue that relaxation will be dominated by double-kinks first and by superkinks only in the long-time limit. This kind of arguments, combined with the magnitude obtained from the vortex structures frozen during field-cooling magnetic decoration experiments allowed us to estimate the typical energy barriers and relaxation times considered in the freezing dynamics model presented in the next section.
IV Freezing dynamics model
In this section we discuss the experimental results in terms of a simple model for the dynamics of freezing of the vortex structure during field-cooling in the presence of the strong disorder associated to a dense distribution of CD. This model allows us to estimate the lifetime of the observed metastable vortex configurations and from characteristic parameters of the system and considering information obtained from magnetic decoration images taken at low fields and 4.2 K (see Fig. 2). We will assume that columnar disorder is strong and dense () such that, for temperatures of the order of , well defined vortex lines remain most of the time individually pinned in a single columnar defect. Namely, in this model we neglect the effect of point disorder.
During the freezing process, pinned vortices form metastable configurations characterized by the set of occupation numbers of each CD, , where if the -th CD is occupied by a vortex, and otherwise. In each metastable state the interaction force must balance in average the defect-vortex force on vortex . During the lifetime of the metastable state, controlled by thermal activation, vortices are bound to their columnar defects, only performing small futile fluctuations. Near freezing, the lifetime of metastable states are expected to be comparable to experimental times, and their typical configurations similar to the ones observed by magnetic decoration. We are thus considering that cooling down to 4.2 K for magnetic decoration has only the effect of further stabilizing the metastable configuration frozen at . We will use this criterion for inferring information about the dynamics near the freezing of the observed vortex structures and ultimately unveil the relevant excitations that will allow us to discern on the nature of the frozen vortex structure.
In order to model the non-stationary dynamics connecting different metastable states after a temperature quench, we will assume that the relaxation process is mainly dominated by single vortex hopping between the randomly-distributed CD. We are thus neglecting multiple vortex hopping, which might be important at higher vortex densities. For simplicity, we will consider identical CD, the so-called non-dispersive case. Blatter Under this assumption, the contribution of super-kink excitations is not relevant and thus the optimal thermal excitations of an individual vortex line are either half-loops or double kinks (DK). Blatter These excitations allow a vortex to escape from one columnar defect, and to be then retrapped by a nearby defect located at a typical distance . Since we also have , the vortex-defect force on vortex is practically the same for consecutive metastable states. If we denote the metastable state at a given time by a supraindex , the relaxation process connecting different metastable states can thus be effectively viewed as a non-steady transport process driven by the heterogeneous set of average local forces associated to the metastable state, . The dependence of with allow us to include the non-steady variation of vortex-vortex interactions during the relaxation and its magnetic field dependence.
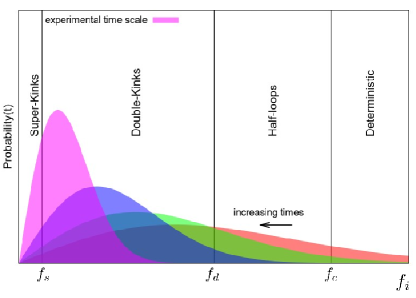
Half-loops excitations are expected to be relevant for pinned vortices such that , where is the force at which a half-loop involves a displacement of the order of the average separation between defects, , and is the critical depinning force from a single defect. As we show below, half-loops drive the relaxation at very short time-scales; for larger times most local forces drop below and half-loop excitations are exhausted. Figure 6 shows a schematic representation of the relevant excitations at each time-scale. Therefore, at large time-scales relaxation is mainly driven by DK excitations since most of vortices feel an interaction force from the other vortices. Optimal DK have a longitudinal length and cost an energy . The line tension is normalized by the anisotropy of the vortex system , and corresponds to the limit of short-wavelength distortions in the direction involved in the kink formation. The proliferation of optimal DK excitations allows a vortex localized at a defect to hop to a neighbor one at a distance of the order of . Provided that the energy barrier for such excitation, , is larger than , the typical time to escape from the defect is given by the Arrhenius law , yielding
| (2) |
where is a characteristic time, or inverse of the attempt frequency. The last formula is an estimate for the escape time of a vortex feeling the interaction force with all the other vortices on a given metastable state .
We can define the lifetime of a given metastable configuration as the minimum single-vortex escape-time among all vortices, as one vortex hop changes a pair of CD occupation numbers, producing a new metastable state . Such a minimal escape time corresponds to the minimal escape barrier . Therefore, it corresponds to the escape time of the least bounded vortex, feeling the maximum force in the metastable configuration . Remembering that , we finally get the escape time for a given metastable configuration
| (3) |
where we have defined the effective energy barrier associated with a given pinned configuration ,
| (4) |
as a function of the characteristic lengths , , and . The dimensionless force , is defined as
| (5) |
obtained from the data shown in Fig. 5 (c). Therefore corresponds to the metastable state frozen during the field-cooling decoration experiment. The DK energy-cost can be written in terms of the characteristic lengths , , and as
| (6) |
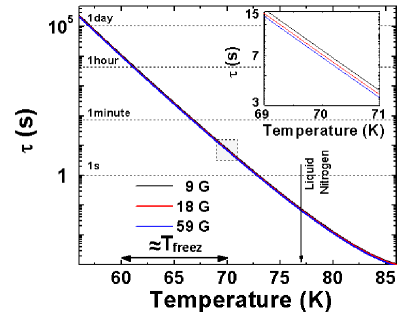
Within this model, the field-dependence of the lifetime comes from the field-dependence of the maximum value of the defect-vortex force distribution for the given frozen configuration. The insert to Fig. 7 shows that the lifetime weakly decrease with increasing the magnetic field. Extrapolation of the behaviour of Fig.5(c) to larger fields suggests that this trend continues, and that should therefore also decrease with increasing magnetic field, following qualitatively the behaviour of in Fig.1.
| [G] | |||||
|---|---|---|---|---|---|
| 9 | 0.69 | 85.3 | 0.6 | 26 | 0.0013 |
| 18.8 | 0.59 | 83.9 | 0.97 | 41 | 0.0016 |
| 59.4 | 0.39 | 79.6 | 0.87 | 142 | 0.0059 |
Let us first start estimating the lifetime of the decorated metastable vortex configurations —we will drop the supraindex when referring to the frozen metastable state— by making again the reasonable assumption that they were frozen at, or very near to, the irreversibility line, namely . From expressions of equations (3), (4), (5), and (6), we get the results for the escape time shown in Table 1, using as input the dimensionless force evaluated from the experimental data and the sample characteristics indicated in the caption of the table. In all cases we verified that so that half-loop excitations are not relevant. The estimated lifetimes of Table 1, of the order of s, are much smaller than the typical time-scales of decoration experiments, namely , with of the order of seconds or minutes. Therefore, we should necessarily have since the freezing temperature should correspond to . Forcing such a condition, from equations (3), (4), (5), and (6) we can estimate the value of . In order to do this realistically, we need to know the temperature-dependence of at . Here, we will simply assume the dependence with nm. This dependence yields a reasonable analytical approximation for the values reported at Keeshabilitation and shown in Table 1 for for the studied here.
Recalculating and as a function of using this approximation for , and setting , with ranging from seconds to hours, we get freezing temperatures in the range K as shown in Fig. 7. The insert to this figure shows that the field-dependence of the lifetime, and thus of , is very weak. Indeed the experimentally-detected change in almost one order of magnitude in on increasing field only impacts in changing % the escape time at , a magnitude that is even smaller at lower temperatures due to the decrease of . It is also interesting to note that at the liquid nitrogen temperature , at which the sample spends some minutes during the magnetic decoration cooling protocol down to 4.2 K, the dynamics is relatively fast, with lifetimes of roughly milliseconds. This means that the frozen configuration has a memory of a temperature , indicated in Fig. 7.
We conclude our theoretical analysis discussing the validity of some of the main assumptions of our model. We have assumed that CD are perfectly parallel to the applied magnetic field, so vortices individually localize in a single defect before a thermally activated event drives it to a neighbor, more favorable pin. However, in the experiments there might exist a misalignment between the applied field and the CD direction of less than 5 degrees. At low temperatures, below the irreversibility line, pinned vortices aligned with a single CD are stable only below the characteristic tilting “locking angle” , between the applied field and the defects. For misalignements larger than vortices can still feel the effect of CD but develop a kinked structure (staircase like) connecting more than one defect. Only above a larger characteristic “trapping angle” , vortices are not locked by CD and the response to a tilt becomes linear. Nelson1993 For Bi2Sr2CaCu2O8 irradiated with a kG dose, for and , our experimental conditions, a trapping angle degrees was experimentally determined in Refs. vanderbeek1995, ; Seow1996, . Being CD efficient to pin and deform the vortices even for such large angles, their effect for misalignments one order of magnitude smaller should be much stronger. Up to our knowledge the locking angle (below which perfect alignment is expected as it is assumed in our model), has not been experimentally determined for the irradiation dose of our sample. However, it can be theoretically estimated as . Blatter Using the reported experimental value degrees, and the line tension corresponding to our material, we get degrees for the three fields we have studied. It is worth noting that these values are in accordance with the experimental value degrees measured for YBa2Cu3O7 with the same dose, at fields and temperature similar to ours Silhanek2003 , if we take into account explicitly the anisotropy ratio of both systems. Since degrees is of the order or larger than our experimental uncertainty of degrees, we conclude that the perfect alignment assumption of our model is fairly acceptable. Indeed, even for tilting angles the typical distance between these kinks is expected to diverge as as we approach . Nelson1993 Therefore, perfect alignment is then possible even for due to a finite size effect, when the distance between kinks become of the order of the sample width, in our case m.
In our model we have neglected the contribution of half-loop excitations. As argued in the previous section this is justified from the fact that these excitations are important for forces smaller than and larger than at , which is larger than the adimensional forces of Table 1 for the range of magnetic fields analyzed. Half-loops would thus drive the relaxation only at very short times after the quench. We have also neglected the dispersion in the CD pinning energy. This dispersion is produced both by the on-site dispersion, (typically arising from the unavoidable dispersion in the ions tracks diameters), or by the inter-site dispersion (arising from the dispersion in the nearest neighbor distance between tracks, which is indeed expected to be Poisson-distributed). According to Ref. Soret2000, , the main source of energy dispersion comes from the diameter dispersion, which for 5.8 GeV Pb ions was estimated to be of the order of . This implies an energy dispersion at zero temperature. The crossover force from double-kink to superkink excitations is thus of the order of . Since for our case , we get the adimensional force . From these estimates we first note that the characteristic force extracted from magnetic decoration images is (see table 1). Since , the typical hopping distance in the variable-range-hopping on netoregime Blatter becomes . We thus conclude that the dominance of DK excitations between columnar tracks separated by a typical distance in the direction of the local force is a fair approximation for the most common elementary excitations driving the relaxation near .
Finally, we have also neglected the possible thermal renormalization of the pinning potential expected to become important above a characteristic temperature Nelson1993 . Using parameters for Bi2Sr2CaCu2O8, , , nm and nm we get K, which is of the order of the for the range of magnetic fields analyzed but larger than our estimated . Therefore, thermal renormalization of the pinning energies is expected to be weak, justifying our approximation.
V Discussion
The predictions from the model discussed in the previous section, based on quantitative information obtained from decoration experiments at 4.2 K, suggest that the decorated structures were dynamically frozen at a much larger temperature by the strong decrease of vortex mobility with temperature induced by the CD dense pinning potential. Within the model, this mobility is dominated by Arrhenius activation through the temperature-dependent finite barriers associated with DK excitations, as barriers for half-loops can be overcame in typical times of the order of milliseconds while the larger barriers expected for super-kinks were disregarded on the basis that DK alone are able to yield metastable states with macroscopic lifetimes. Within this scenario, it is worth mentioning that previous works studying samples with kG from the same batch than ours reported that the low-field regime presented non-divergent activation barriers varying linearly with the ac driving current. vanderbeek1995 This is in contrast to the divergent barriers found at higher fields, consistent with half-loop excitations. On the other hand, it was proposed that for a high density of CD the change in pinning energies when increasing field are negligible compared to the change in interaction energy, giving place to a “discrete superconductor” picture. vanderbeek2001 These two findings are consistent with our model assumption that the relevant excitations driving the non-steady relaxation are just DK, and that the role of super-kink excitations is not important for the time-scales typical of our magnetic decoration experiments.
Note that this is in contrast with the barriers expected for instance for the Bose glass phase, which tend to diverge near equilibrium, a signature of the strong localization of vortex lines at very long times with a broad variable range hopping. The amorphous order observed in the decorations can then be interpreted as a snapshot of a non-entangled liquid-like structure metastable at , a temperature located below the first-order transition line. This non-entangled highly viscous and far from equilibrium liquid-like structure contrasts with the quasi-long-range positionally-ordered vortex structures observed in pristine samples of the same compound at . Cejas2015 Experiments with significantly larger cooling times would allow to ascertain whether a more ordered vortex structure is stable for a very dense distribution of CD.
Figure 6 shows a schematic picture for the relaxation dynamics of the defect-vortex forces. Within our model, the dynamics at is mainly controlled by DK excitations since most of the defect-vortex forces satisfy , with the force below which super-kink excitations dominates. The parameter is the dispersion in pinning energies coming from the differences between columnar defects and from the disorder in their spatial distribution. In our model we have assumed that is negligible compared to , so is very small and super-kink dynamics would become relevant only at very large time-scales. If is not small, then the non-steady relaxation may be dominated by variable range hops with DK becoming inefficient to irreversibly drive the vortices to a lower energy state.
A previous work vanderbeek2001 proposes that the low-field vortex state nucleated in the case of a sample with a dense distribution of CD would not differ fundamentally from that observed in pristine samples. This is based in the finding that the energy difference between two metastable states in the former case is dominated by the vortex-vortex interaction energy rather than by the differences in pinning energy. Within this view, each vortex line is however confined and pinned to a CD. This proposal is similar to the one stating that the conventional Bose glass phase may have a crossover to a putative “Bragg-Bose glass phase”. Giamarchi The later is a glassy phase with quasi-long-range order but confined in CD, and thus individual vortex lines are macroscopically flat, in sharp contrast to the rough vortex lines of the Bragg-glass phase expected for weak point-disorder. Interestingly, our analysis suggests that the truly glassy relaxation dynamics in our samples, such as the super-kink or variable range hopping dynamics, or collective creep dynamics made of correlated hops (corresponding to one of the possible equilibrium phases), would become dominant only in the limit of very long relaxation times, much larger than the one probed during the magnetic decoration quenching process. These experiments, as they are currently done, can not give any information about the subjacent equilibrium phase expected at very long-times. This will critically depend on the degree of dispersion of the pinning energies, . Blatter
Therefore, it would be interesting to implement glass-annealing techniques in order to reach configurations with a narrower distribution of vortex-defect forces and thus with less memory of the liquid phase and less accumulated stress. Observing the changes in the translational order of the decorated lattice as a function of the quenching time, for instance, may tell us which phase is more plausible, as the corresponding equilibrium correlation length slowly grows with time. In particular, if a topologically ordered equilibrium phase exists at low fields in the presence of a high density of CD or a “discrete superconductor” picture is valid, then the density of dislocations in the vortex structure should display a decrease with time. This effect might be seen, for instance, by comparing the number of detected in magnetic decoration experiments performed at significantly different cooling rates.
VI Conclusions
We have analyzed, through magnetic decoration images, dynamically frozen vortex configurations in heavy-ion irradiated Bi2Sr2CaCu2O8 samples with a very dense distribution of columnar defects. For low vortex densities compared with the CD density, we find an amorphous phase with liquid-like correlations, and an approximately Gaussian defect-vortex force distribution indicating a randomly-oriented pinning scenario. By assuming vortices individually trapped at identical CD, we show that the observed translational order is fairly consistent with a relaxation dynamics dominated by DK excitations near the freezing temperature . Using a simple model and input from the experimental data obtained from magnetic decoration images, we predict a freezing temperature of the same order but smaller than the irreversibility temperature. We argue that magnetically-decorated structures hence correspond to a typical configuration of a non-entangled vortex-liquid state with strongly reduced mobility, rather than to a metastable state of an equilibrium glassy phase with divergent relaxation barriers associated to the localization of vortices in CD even at very long times. Experiments with significantly larger cooling times or glass-annealing techniques are mandatory in order to dilucidate if, as naïvely expected, the equilibrium vortex phase nucleated in a very dense distribution of strong pins is a more ordered one.
VII Acknowledgments
This work was made possible thanks to the support of the ECOS-Sud-MinCyT France-Argentina bilateral program, Grant No. A09E03. Work done at Bariloche was partially founded by PICT-PRH 2008-294 and University of Cuyo Reserch Grant No. 06-C381. A.B.K, D.D. and Y.F. also acknowledge support from ANPCyT-PICT-2011-1537.
References
- (1) G. Blatter, M. V. Feigel’man, V. B. Geshkenbein, A. I. Larkin, and V. M. Vinokur, Rev. Mod. Phys. 66 1125 (1994).
- (2) Y. Fasano, M. De Seta, M. Menghini, H. Pastoriza, and F. de la Cruz, Proceed. Nat. Acad. Sciences 102, 3898 (2005), and references therein.
- (3) A. P. Petrovic, Y. Fasano, R. Lortz, C. Senatore, A. Demuer, A.B. Antunes, A. Paré, D. Salloum, P. Gougeon, M. Potel, Ø. Fischer, Phys. Rev. Lett. 103 257001 (2009).
- (4) Y. Fasano, J. Herbsommer, and F. de la Cruz, Phys. Stat. Sol. (b) 215 563 (1999).
- (5) Y. Fasano, M. De Seta, M. Menghini, H. Pastoriza, and F. De la Cruz, Solid State Comm.128 51 (2003).
- (6) S. Demirdis, C. J. van der Beek, Y. Fasano, N. R. Cejas Bolecek, H. Pastoriza, D. Colson, and F. Rullier-Albenque, Phys. Rev. B 84, 094517 (2011).
- (7) C.J. van Der Beek, S. Demirdis, M. Konczykowski, Y. Fasano, N. R. Cejas Bolecek, H. Pastoriza, D. Colson, and F. Rullier-Albenque, Phys. B: Condensed Matter 407 1746 (2012).
- (8) S. Demirdis, Y. Fasano, S. Kasahara, T. Terashima, T. Shibauchi, Y. Matsuda, M. Konczykowski, H. Pastoriza, C.J. van der Beek, Phys. Rev. B 87 094506 (2013).
- (9) H. Yang, B. Shen, Z. Wang, L. Shan, C. Ren, and H.-H. Wen, Phys. Rev. B 85, 014524 (2012).
- (10) C.J. van der Beek, S. Demirdis, M. Konczykowski, Y. Fasano, N.R. Cejas Bolecek, H. Pastoriza, D. Colson, F. Rullier-Albenque, Phys. B 407, 1746 (2012).
- (11) C. J. van Der Beek, S. Demirdis, D. Colson, F. Rullier-Albenque, Y. Fasano, T. Shibauchi, Y. Matsuda, S. Kasahara, P. Gierlowski, M. Konczykowski, J. Phys. Conf. Series 449, 012023 (2013).
- (12) L. Civale, A.D. Marwick, M.W. McElfresh, T.K. Worthington, A. P. Malozemoff, F. H. Holtzberg, J. R. Thompson, and M. A. Kirk, Phys.Rev.Lett. 65 , 1164 (1990).
- (13) M. Konczykowski, F. Rullier-Albenque, E. R. Yacoby, A. Shaulov, Y. Yeshurun, and P. Lejay, Phys. Rev. B 44 , 7167 (1991).
- (14) C. J. van der Beek, Thermodynamique des vortex dans les supraconducteurs desordonnes, Südwestdeutscher Verlag für Hochschulschriften AG & Co. KG, Sarrebruck, Germany (2010).
- (15) D. R. Nelson, and V. M. Vinokur Phys. Rev. B 48 13060 (1993).
- (16) C. J. van der Beek, M. Konczykowski, V. M. Vinokur, T. W. Li, P. H. Kes, and G. W. Crabtree Phys. Rev. Lett. 74, 1214 (1995).
- (17) C. J. van der Beek, M. Konczykowski, V. M. Vinokur, G. W. Crabtree, T. W. Li, and P. H. Kes Phys. Rev. B 51, 15492 (1995); M. Konczykowski, and N. Chukimoto, and V. M. Vinokur, and M. V. Feigelman Phys. Rev. B 51, 3957 (1995).
- (18) J. C. Soret, V. Ta Phuoc, L. Ammor, A. Ruyter, R. De Sousa, E. Olive, G. Villard, A. Wahl, and Ch. Simon, Phys. Rev. B 61, 9800 (2000).
- (19) M. Leghissa, L. A. Gurevich, M. Kraus, G. Saemann-Ischenko, L. Ya. Vinnikov, Phys. Rev. B 48, 1341 (1993).
- (20) H. Dai, S. Yoon, J. Liu, R. C. Budhani, Ch. M. Lieber, Science 265, 1552 (1994)
- (21) M. Menghini, Yanina Fasano, F. de la Cruz, S. S. Banerjee, Y. Myasoedov, E. Zeldov, C. J. van der Beek, M. Konczykowski and T. Tamegai, Phys. Rev. Lett. 90 , 147001 (2003).
- (22) S. S. Banerjee, A. Soibel, Y. Myasoedov, M. Rappaport, E. Zeldov, M. Menghini, Yanina Fasano, F. de la Cruz, C. J. van der Beek, M. Konczykowski and T. Tamegai, Phys. Rev. Lett. 90 , 087004 (2003).
- (23) M. Menghini, Yanina Fasano, F. de la Cruz, S.S. Banerjee, Y. Myasoedov, E. Zeldov, C. J. van der Beek, M. Konczykowski and T. Tamegai, J. Low Temp. Phys. 135 , 139 (2004).
- (24) S. S. Banerjee, A. Soibel, Y. Myasoedov, M. Rappaport, E. Zeldov, M. Menghini, Yanina Fasano, F. de la Cruz, C. J. van der Beek, M. Konczykowski and T. Tamegai, Phys. C 408-410 , 495 (2004).
- (25) Yanina Fasano, M. De Seta, M. Menghini, H. Pastoriza and F. de la Cruz, Phys. C 408-410 , 520 (2004).
- (26) M. Menghini, Yanina Fasano, F. de la Cruz, S. S. Banerjee, Y. Myasoedov, E. Zeldov, C. J. van der Beek, M. Konczykowski and T. Tamegai, on Perspectives on Superconductivity Research, edited by P.S. Lewis , Nova Publishers (2005).
- (27) F. Pardo, A. P. Mackenzie, F. de la Cruz, and J. Guimpel, Phys. Rev. B 55, 14610 (1997).
- (28) T. W. Li et al., J. Cryst. Growth 135, 481 (1994).
- (29) A. Dorosinskii, M. V. Indenbom, V. I. Nikitenko, Yu A. Ossip’yan, A. A. Polyanskii, and V. K. Vlasko-Vlasov, Physica C 203, 149 (1992).
- (30) M. Konczykowski, F. Holtzberg, and P. Lejay, Supercond. Sci. Technol. 4, S331 (1991).
- (31) Y. Fasano, and M. Menghini, Supercond. Sc. and Tech. 21, 023001 (2008).
- (32) H. Pastoriza, M. F. Goffman, A. Arribere, and F. de la Cruz, Phys. Rev. Lett. 72, 2951 (1994).
- (33) E. Zeldov, D. Majer, M. Konczykowski, V. B. Geshkenbein, V. M. Vinokur, and H. Shtrikman, Nature 375, 373 (1995).
- (34) M. Konczykowski, C. J. van der Beek, A. E. Koshelev, V. Mosser, M. Dogson, and P. H. Kes, Phys. Rev. Lett. 97, 237005 (2006).
- (35) J. Gilchrist, and M. Konczykowski, Phys. C 212, 43 (1993).
- (36) N. Morozov, E. Zeldov, D. Majer, and M. Konczykowski, Phys. Rev. B 54, R3784 (1996).
- (37) M. I. Dolz, Y. Fasano, H. Pastoriza, V. Mosser, M. Li, M. Konczykowski, Phys. Rev. B, 90 144507 (2014).
- (38) C. J. van der Beek, M. Konczykowski, R. J. Drost, P. H. Kes, N. Chikumoto, and S. Bouffard, Phys. Rev. B 61, 4259 (2000).
- (39) C. J. van der Beek, M. Konczykowski, A. V. Samoilov, N. Chikumoto, S. Bouffard, and M. V. Feigel’man, Phys. Rev. Lett. 86, 5136 (2001).
- (40) N. R. Cejas Bolecek, M. I. Dolz, A. Kolton, H. Pastoriza, C. J. van der Beek, M. Konczykowski, M. Menghini, G. Nieva, Y. Fasano, J. Low Temp. Phys. 179 35 (2015).
- (41) W. S. Seow and R. A. Doyle and A. M. Campbell and G. Balakrishnan and D. McK. Paul and K. Kadowaki and G. Wirth Phys. Rev. B 53, 14611 (1996).
- (42) A. Silhanek, L. Civale, S. Candia, G. Nieva, G. Pasquini, and H. Lanza, Phys. Rev. B 59, 13620 (1999).
- (43) T. Giamarchi and P. Le Doussal, Phys. Rev. B 55, 6577 (1997).