Is the corporate elite disintegrating?
Interlock boards and the Mizruchi hypothesis
Abstract
This paper proposes an approach for comparing interlocked board networks over time to test for statistically significant change. In addition to contributing to the conversation about whether the Mizruchi hypothesis (that a disintegration of power is occurring within the corporate elite) holds or not, we propose novel methods to handle a longitudinal investigation of a series of social networks where the nodes undergo a few modifications at each time point. Methodologically, our contribution is two-fold: we extend a Bayesian model hereto applied to compare two time periods to a longer time period, and we define and employ the concept of a hull of a sequence of social networks, which makes it possible to circumvent the problem of changing nodes over time.
Index Terms:
interlock boards; longitudinal social networks; Mizruchi hypothesis; hull of a sequence of social networks; Bayesian analysisI Introduction
In The Fracturing of the American Corporate Elite [1], Mizruchi makes the claim that a disintegration of power is occurring within the corporate elite. He asserts that since World War II the voice of the American corporate elite has diminished to the point where it is now ineffectual. This shift in the role of the corporate elite has had an impact not only on the corporations it oversees but on the entire business system [2, 3].
We argue that if this is occurring then there should be evidence of such change in the power networks of members of the corporate elite. One way in which to identify the corporate elite is to look at corporate boards of directors. Building on the work of Mills [4], extensive research about the power elite has been conducted, including investigations of the influence of board members on issues related to executive compensation and firm performance. Wong et al. [5] show that the level of board interlocking contributes to the level of executive pay.
In this paper, we focus on interlocked boards - boards that share at least one director. A premise to our study is to consider the density of an interlock network as a proxy for cohesive power within the corporate elite.
Employing a Bayesian analysis in which we test for significance in network change over time, we show that there is little evidence that degradation in the cohesiveness of the network is occurring within the elite of the elite. We use the Dow Jones 30 (DOW 30) group of corporations to represent the “elite of the elite” and our period of study is 2001-2010 (Section III). This result suggests that the Dow Jones 30 forms a very robust core which is rather impervious to degradation from outside forces.
We thus demonstrate how to apply a Bayesian model to better understand changes over time in an interlocked corporate board network. This work builds on the Bayesian version of the model introduced by Wong [6], extended by Gill and Swartz [7], and applied by Adams et al. [8] to changes in the density of collaborative networks over two periods of time. This extended p1 model includes random effects allowing for some network internal dependency (see also Goldenberg et al. [9] for a useful review paper).
In this paper, we report on successive pairwise comparisons of the networks (Section IV) and then propose in Section V a method to perform a full longitudinal analysis.
II Literature and background
In The Power Elite, C. Wright Mills [4] discusses the structural changes occurring within the United States in the 1930’s and 1940’s that gave rise to the power elite. He identifies three changes that make this rise in power possible: 1. the increasing dominance of corporations, 2. the expansion of the federal government, and 3. the emergence of a large military body following World War II. However, Mizruchi, in many articles but most visibly in [1], argues that while the corporate elite was prominent in helping to direct the public agenda through World War II, its voice has since that time become fragmented and has lost its power.
Researchers often use interlocked board membership as the identifying characteristic to represent the corporate elite. It has been argued that members of interlocked boards are able to move in and out of not only board rooms but also of civic arenas to spread their beliefs. Their board prominence also gives them the recognition to be seen as senior statesmen in their communities.
This “inner circle” thus possesses a higher level of political influence and social cohesion [3]. This implication has led to the realization that corporations do not exist in isolation, but instead are part of a societal power establishment through individuals including interlocked board members [10].
Another interesting question is of whether a core corporate group such as the Dow Jones constitutes a “rich club” in the sense described for example in [11]. This would imply that corporations within the Dow Jones interlock with each other more than with corporations outside the Dow Jones.
The similarities of powers obtained by the corporate elite are not the only similarities. Others [12, 13] have shown that demographic similarities can be observed within these members as well. They found that, when considering education and social characteristics, interlocked members have become more similar over time. One might therefore expect that these elite members will express similar opinions regarding societal directions, in turn helping to contribute to the singular voice of the elite.
In the United States, the most important initiative undertaken to limit interlocks is the Clayton Act of 1914 which prohibits U.S. firms that compete with one another from sharing board members.
Board member turnover is low, with the average board member tenure being approximately 12 years [14]. Because of this we don’t expect to see significant change in the interlocked network on a year-by-year basis. However, we would not be surprised if events related to the Clayton Act, as described above, could result in periods of disruption in the interlock network.
In this paper, we investigate interlock networks under the lens of Social Network Analysis (SNA). A link occurs between corporations when they share a board member, or between directors where they serve on the same board. Such a network is often referred to as a bipartite network.
III Data and proposed model
III-A Data Preparation
ver the 128-year history of the Dow Jones Industrial Average the companies that make up the index have changed 53 times. The index started in 1884 with 12 companies. This list expanded to 20 companies in 1916 and expanded again in 1928 to include a total of 30 companies, where it stands today. Our period of interest is from 2001 through 2010 which included 43 total companies, due to additions and subtractions over this period. We will return in Section V to a discussion of this group, which we will refer to as the hull of the DOW 30.
Having identified these 43 companies, our next step was to filter the list of directors down to just those directors who served on the boards of these companies. This allowed us to condense all of the directors of interest into a single file.
The data were obtained from the BoardEX database, which provides a row for each director who overlapped with another director in the same firm for some period of time (the overlap period). A new row would be created if either director changed positions within the firm, or changed director roles. The overlap period was difficult to work with, and had to be segmented into a start and end date. Eventually we were able to get the file down to a unique list of directors for each firm during only the period of interest.
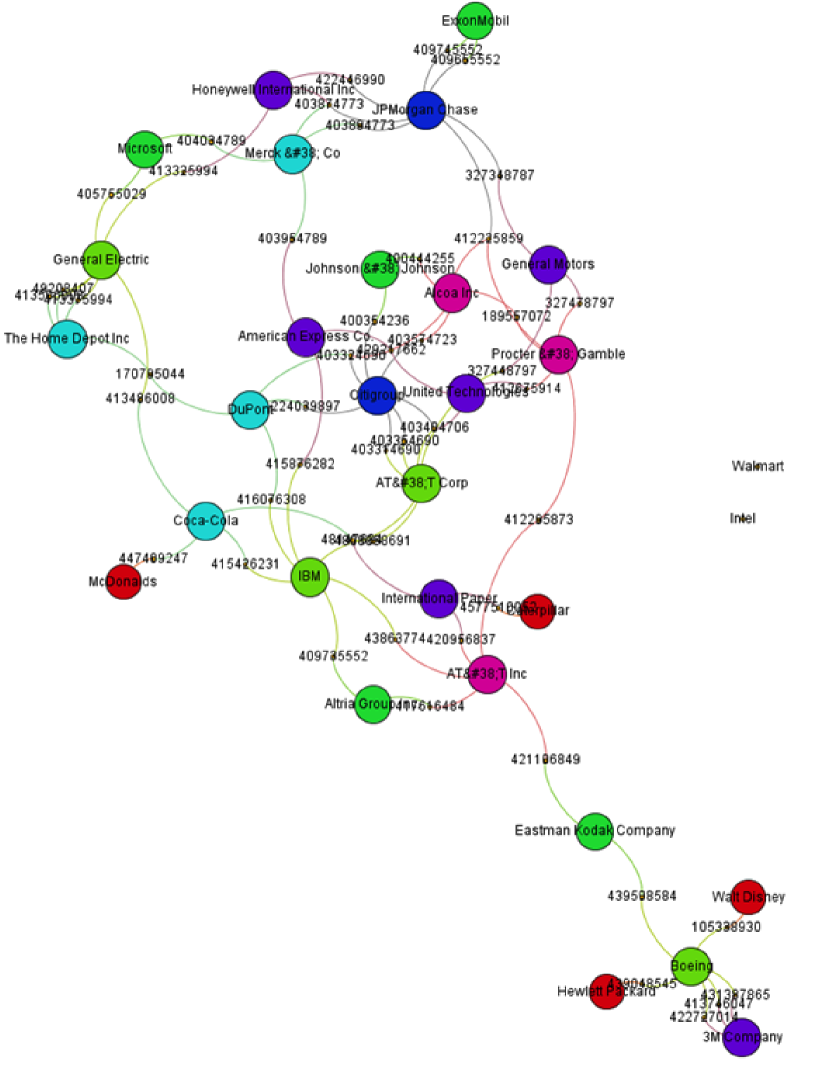
From this list we were able to create our nodes and edges. We started by creating nodes for both the companies as well as the directors and creating the edges between them. This allowed us to see demographics on specific directors (age, gender, tenure, role, etc.) which opened the way for us to manually spot check our data using director lists found in the annual reports of these companies. We had to rely on these demographics instead of board member names due to the lack of names in the BoardEX database. Our network, at this stage, can be seen for 2001 in Figure 1, with the nodes sized on the basis on their degree centrality (note that we have displayed all 30 companies regardless of whether they had a shared board member, but we have filtered out board members that were not considered interlocked to keep the graph as easy to read as possible). We recall that the graph in Figure 1 is a bipartite, or 2-mode, graph since it contains two types of nodes, companies and directors.
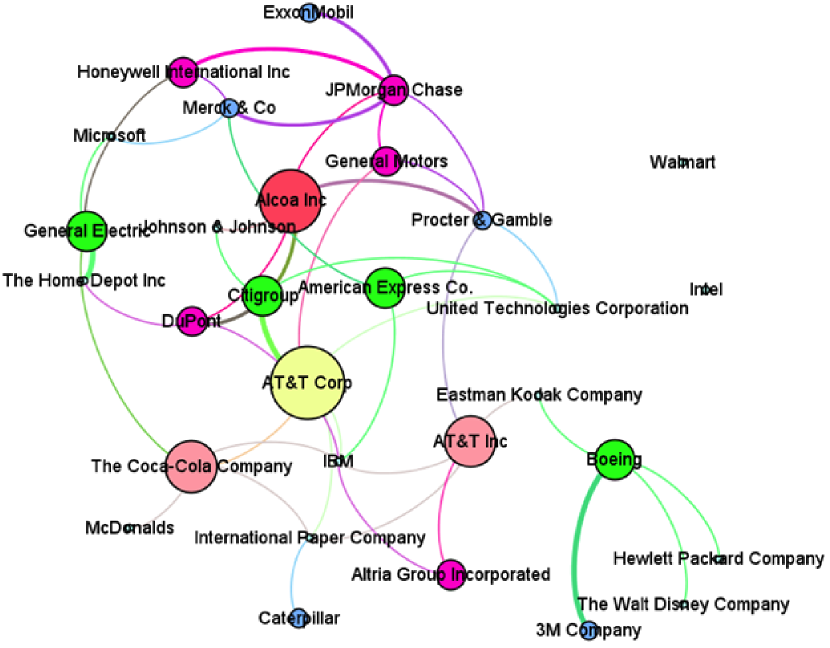
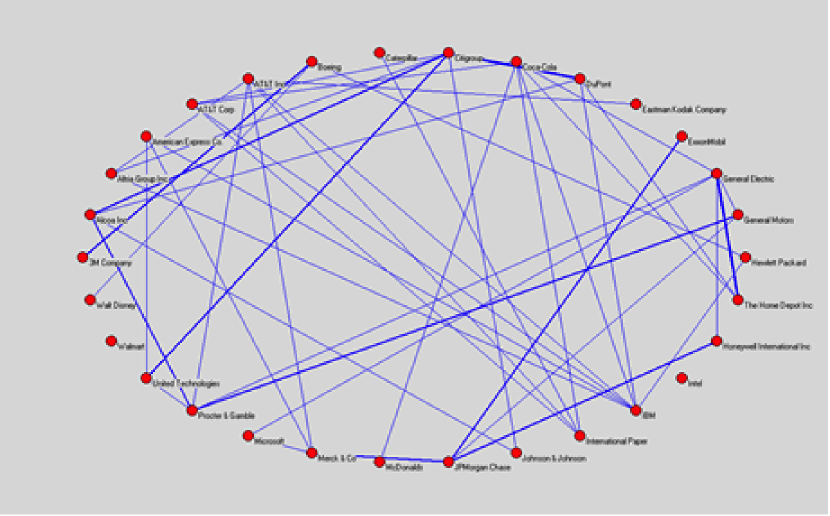
Next, in Figure 2, we have stripped out the individual board members and have replaced them with weighted connections between the two companies, which converts our 2-mode network into a 1-mode network. So, as can be seen in Figure 2, General Electric (GE) and Microsoft have one common board member so an edge with a weight of 1 was created between GE and Microsoft, while GE and Home Depot share two board members which resulted in an edge with a weight of 2 between GE and Home Depot. The 2001 network for the DOW 30 companies can be seen in Figure 2.
III-B Proposed model
Following a model suggested by Wong [6] and Gill and Swartz [7], we employ a Bayesian methodology in a search for statistical significance in the changes in density of social networks over time. Testing for statistical significance over time has been of interest to the social network research community due to the complexities faced, including link dependency. In addition to link dependency, snapshots of the network over time are typically also dependent and, therefore, traditional means that require independent observations cannot be employed. The model can be described as follows: and , if and are connected, and and , if and are not connected, with
and
The index denotes the time period and indices and refer to two corporations. Because each pair of corporations can either share or not share a board member, the matrix is a simple opposite of the matrix in the sense that can be obtained from by replacing zeros with ones and ones with zeros. The matrix is often referred to as the sociomatrix, with its ones indicating where a link occurs. The probability represents the probability of an interlock link occurring between corporations and , at time ,and represents the probability that no such link exists. The parameter represents the overall propensity for links to occur in the network at time , and the parameters represent the propensity for corporation to share board members with other corporations in the network. Prior distributions are defined on each parameter, making the model Bayesian.
The advantage of this approach to modelling links in a sequence of networks is that it allows for links to not be independent (via the random effects ) at a given point in time and also allows, via suitable priors, for parameters to exhibit a timewise correlation: for example, it is quite likely that the and the are correlated over time. We will return to this point in Section V.
In Adams et al. [8] this approach was used successfully to examine changes in network parameters over two time periods. In this paper we explain how to extend this approach to more than two time periods, with a more complicated time correlation structure, such as autoregressive, for example. We have implemented the Bayesian model for the two time periods 2001 and 2002, and for each successive pair-wise comparison (2002-2003, 2003-2004, etc.) as well as 2001-2010 (Section IV) and conducted a preliminary time series analysis in Section V.
Our DOW 30 components change over time, which presents a unique challenge to modeling the network. We have several years of stability where the same 30 companies are present, but in other years some companies are replaced with others. Over the 10 year period under study the following changes occurred:
-
1.
In 2004 AT&T Corporation, Eastman Kodak, and International Paper were all removed while American International Group Inc, Pfizer, and Verizon were added.
-
2.
In 2008 Altria, American International Group, and Honeywell were replaced with Bank of America, Chevron, and Kraft Foods.
-
3.
In 2009 Citigroup and General Motors were replaced with Cisco Systems and Travelers.
It follows that we can compare years within each group 2001-2003, 2004-2007, and 2009-2010, but comparisons across these time periods may present a challenge.
| 2001 | 2002 | 2003 | 2004 | 2005 | 2006 | 2007 | 2008 | 2009 | 2010 | |
| # Nodes | 30 | 30 | 30 | 30 | 30 | 30 | 30 | 30 | 30 | 30 |
| # Edges | 46 | 46 | 48 | 51 | 47 | 46 | 48 | 44 | 40 | 50 |
| Avg Degree | 3.067 | 3.067 | 3.2 | 3.4 | 3.133 | 3.067 | 3.2 | 2.933 | 2.667 | 3.333 |
| Avg Weighted Degree | 3.933 | 3.867 | 3.867 | 4.067 | 3.533 | 3.533 | 3.467 | 3.2 | 2.8 | 3.667 |
| Network Diameter | 7 | 7 | 5 | 5 | 5 | 6 | 5 | 6 | 7 | 5 |
| Graph Density | 0.106 | 0.106 | 0.11 | 0.117 | 0.108 | 0.106 | 0.11 | 0.101 | 0.092 | 0.115 |
| Modularity | 0.497 | 0.478 | 0.437 | 0.441 | 0.402 | 0.454 | 0.433 | 0.529 | 0.465 | 0.447 |
| Connected Components | 3 | 3 | 4 | 3 | 3 | 2 | 2 | 1 | 3 | 3 |
| Avg Clustering Coefficient | 0.226 | 0.169 | 0.324 | 0.336 | 0.168 | 0.212 | 0.197 | 0.292 | 0.263 | 0.235 |
| Avg Path Length | 3.071 | 2.934 | 2.584 | 2.495 | 2.54 | 2.845 | 2.645 | 3.062 | 3.114 | 2.514 |
IV Analysis and results
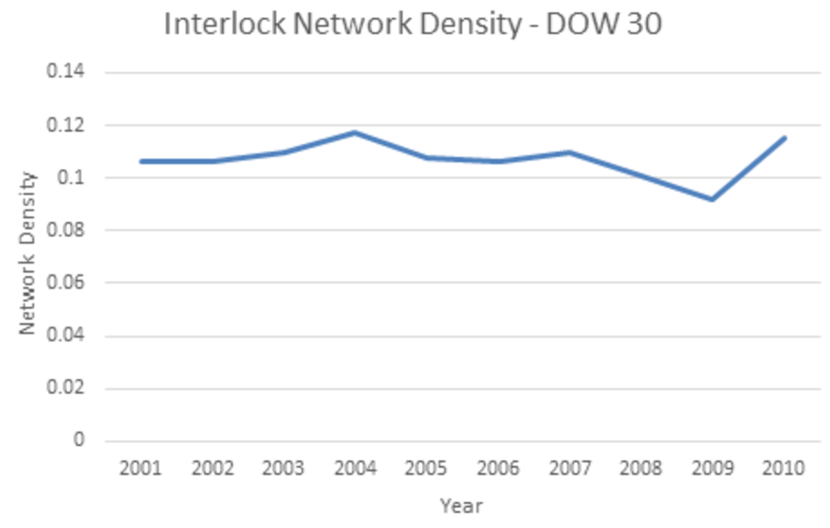
Table I provides key network level measures for 2001-2010 and Figure 3 graphically displays the evolution of the density of the networks. It is clear that observed network measures at first sight remain essentially stable over the period of interest. One might note a slight disintegration effect in 2008 and 2009, near the time of highest intensity of the recent financial crisis.
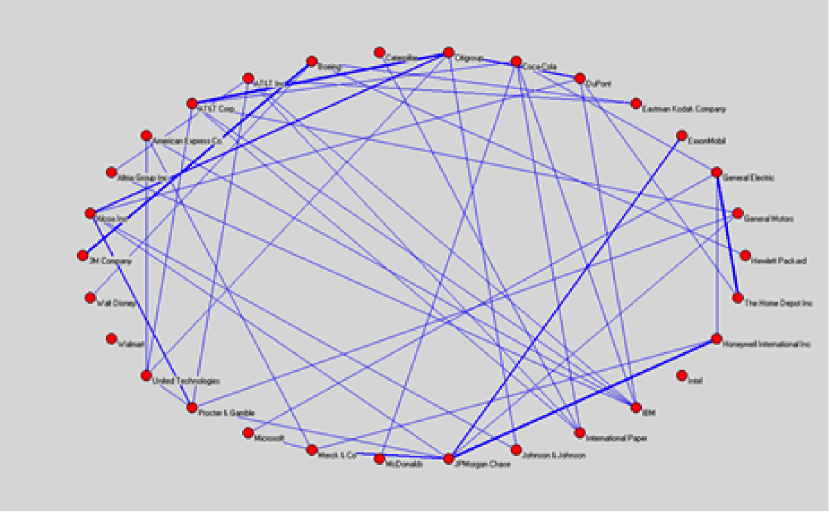
Focusing, for example, on the pair comparison between 2001 and 2002, we can visually observe few differences between the two network graphs for 2001 and 2002 in Figures 4 and 5.
We next employ our Bayesian model to investigate whether our visual observations are confirmed by an examination of the posterior distribution of the difference in cohesiveness between 2001 and 2002, and then between all other successive pairs of years, ending in 2009-2010.
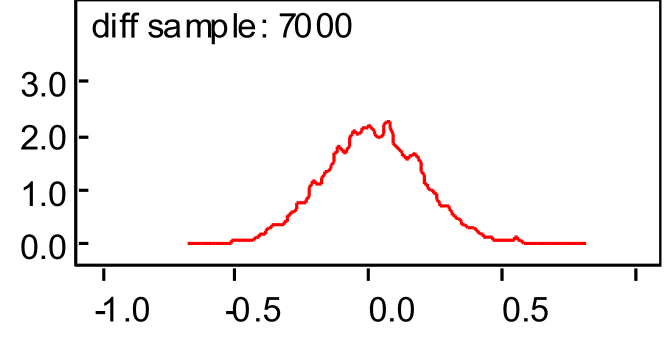
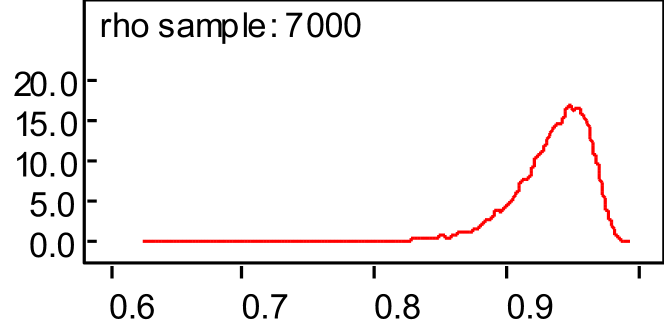
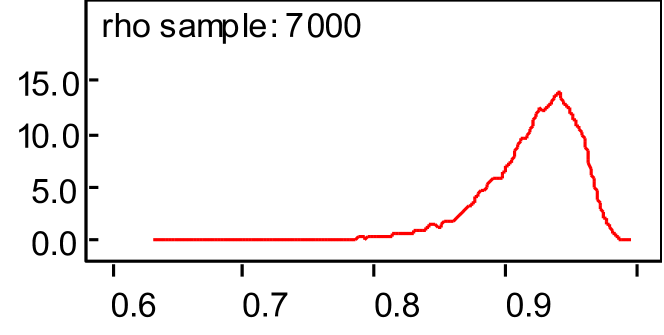
Figure 6 displays graphs of the kernel posterior densities for the difference in the propensity to form links (cohesiveness, playing here is the role of density) in the networks for 2001 and 2002, and for the correlation of the network parameters between 2001 and 2002. Since the value of zero is in the middle of the posterior distribution for the difference, that would imply no significant change between the cohesiveness of the 2001 and 2002 networks. It also appears, as expected, that the correlation is high, with a posterior distribution centered tightly above .9.
The posterior mean of the difference between 2001 and 2002 is .01548, with a 2.5% - 97.5% credible interval of (-0.3584, 0.3923) encompassing zero. The positive value of the posterior mean of the difference indicates a decrease in the cohesiveness of the network between 2001 and 2002, but this difference is a posteriori essentially as likely to be positive as to be negative. A more pronounced difference would have its posterior density shifted away from zero.
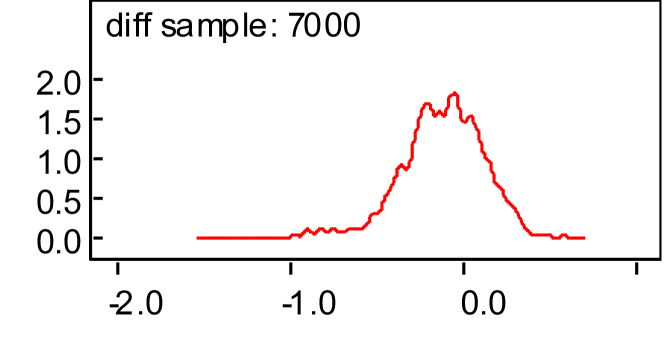
The posterior mean of the difference between 2002 and 2003 of -.1224 indicates an increase in the cohesiveness of the network between 2001 and 2002, but with a 2.5% - 97.5% credible interval of (-0.7454, 0.3104) again encompassing zero.
A similar situation emerges among the remaining pairwise comparisons, including the comparison of 2001 with 2010 (beginning and end of studied period). The posterior densities vary a bit in how central zero is to the distribution, but overall, one does not detect any changes that might be referred to as significant in a statistical sense.
On the basis of our analysis to date we see no trend away from interlocked networks over the time period studied. So while we do not find support for Mizruchi’s claim, we feel the time period needs to be expanded to get a true sense of the network changes over decades.
V Extended dow jones and longitudinal interlock network
As discussed earlier, one complication in longitudinal investigations of the DOW 30 network is that corporations leave and enter this network as years pass.
We therefore propose to employ a DOW 30 hull which includes all corporations that have appeared at least once in DOW 30 during the period of study (43 corporations for the period 2001-2010). We construct a network on this hull consisting of all links connecting corporations in the hull who at any stage shared a director. All directors, serving at any stage on boards of corporations featured in the hull, are nodes in the bipartite network. We suggest that this is an appropriate way to identify a corporate “elite of elite” which is somewhat more robust than the DOW 30 strictly defined.
This makes it possible to build longitudinal models of networks with a fixed set of nodes, and to compare and extend existing techniques. As a first foray into the temporal behavior of the series of networks, we extract the estimated differences (posterior means) from each of the pairs 2001-2002, 2003-2004, … 2009-2010 and fit a simple AR(2) (Auto-Regressive of order 2) model to the time series of the 9 differences. The fit of this preliminarily model is displayed in Figure 8. It is interesting to note that observation 8 is the pair 2008-2009 when the financial crisis was probably at its most severe level.
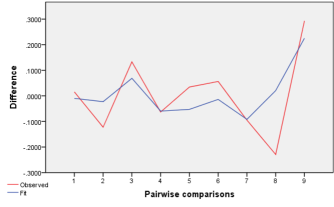
The AR(2) model does a fairly good job of explaining correlations across the years (the root mean square error RMSE is of .115 and BIC of -3.59 for the AR(2) model, compared to a RMSE of .135 and a BIC of -3.51 for an AR(1) model), but we believe that more sophisticated models constructed on the DOW 30 hull will reveal more aspects of the evolution of the core interlock network over time. We are also aware that our current study period is limited, and expect to extend this period to a much longer time span; from World War II to the present.
Using the hull of the sequence of DOW 30 interlock networks, we also expect to be able to take into account in our model the weights of the links (related to the number of shared board members).
VI In conclusion
This paper has proposed an approach that can be employed to compare interlocked board networks over time to test for statistical significant change. Our preliminary findings suggest that change within the network does not usually occur rapidly enough to be detected in a year-over-year comparison. This is not surprising given the size of the network (number of nodes) and the frequency with which directors for any company change in a year over year basis. This does not mean that no shocks have caused changes over the years, but we have just not yet detected them in our analysis to date.
While we were not surprised to not find significant change on a year to year basis, we were surprised that even our 10 year analysis (2001 versus 2010) also displayed no significant change. This suggests that the entire decade was stable. Since Mizruchi claims that this fracturing has been occurring since World War II, our next step is to expand the analysis to go back decades in order to see when this change may have occurred.
In addition to contributing to the conversation on whether the Mizruchi hypothesis holds or not, we have proposed novel methods to handle a longitudinal investigation of a sequence of social networks where the nodes undergo a few modifications at each time point. Methodologically, our contribution is two-fold: we extend a Bayesian model hereto applied to compare two time periods to a longer time period, and we define and employ the concept of a hull of a sequence of social networks, which makes it possible to circumvent the problem of changing nodes over time.
References
- [1] M. S. Mizruchi, The fracturing of the American corporate elite. Harvard University Press, 2013.
- [2] J. Scott, “Networks of corporate power: A comparative assessment,” Annual review of sociology, pp. 181–203, 1991.
- [3] M. Useem, The inner circle: Large corporations and the rise of business political activity in the US and UK. Oxford University Press, 1984.
- [4] C. W. Mills, The power elite. Oxford University Press, 1956.
- [5] L. H. H. Wong, A. F. Gygax, and P. Wang, “Board interlocking network and the design of executive compensation packages,” Social Networks, vol. 41, pp. 85 – 100, 2015.
- [6] G. Y. Wong, “Bayesian models for directed graphs,” Journal of the American Statistical Association, vol. 82, no. 397, pp. 140–148, 1987.
- [7] P. S. Gill and T. B. Swartz, “Bayesian analysis of directed graphs data with applications to social networks,” Journal of the Royal Statistical Society. Series C (Applied Statistics), vol. 53, no. 2, pp. 249–260, 2004.
- [8] S. Adams, N. Carter, C. Hadlock, D. Haughton, and G. Sirbu, “Change in connectivity in a social network over time: A bayesian perspective,” Connections, vol. 28, pp. 17–27, 2008.
- [9] A. Goldenberg, A. Zheng, S. Fienberg, and E. M. Airoldi, “A survey of statistical network models,” Foundations and Trends in Machine Learning, vol. 2, pp. 129–233, 2010.
- [10] W. K. Carroll and J. P. Sapinski, “Corporate elites and intercorporate networks,” in The SAGE Handbook of Social Network Analysis, J. P. Scott and P. J. Carrington, Eds. Sage, 2014, pp. 180–195.
- [11] J. Alstott, P. Panzarasa, M. Rubinov, E. T. Bullmore, and P. E. Vértes, “A unifying framework for measuring weighted rich clubs,” Scientific Reports, vol. 4, 2014.
- [12] P. Stanworth and A. Giddens, “The modern corporate economy: Interlocking directorships in britain, 1906–1970,” The Sociological Review, vol. 23, no. 1, pp. 5–28, 1975.
- [13] R. Whitley, “The city and industry: the directors of large companies, their characteristics and connections,” in Elites and Power in British Society, P. Stanworth and A. Giddens, Eds. Cambridge University Press, 1974, pp. 65–80.
- [14] N. Vafeas, “Length of board tenure and outside director independence,” Journal of Business Finance & Accounting, vol. 30, no. 7-8, pp. 1043–1064, 2003.