How SN Ia host-galaxy properties affect cosmological parameters
Abstract
We present a systematic study of the relationship between Type Ia Supernova (SN Ia) properties, and the characteristics of their host galaxies, using a sample of 581 SNe Ia from the full Sloan Digital Sky Survey II (SDSS-II) SN Survey. We also investigate the effects of this on the cosmological constraints derived from SNe Ia. Compared to previous studies, our sample is larger by a factor of , and covers a substantially larger redshift range (up to ), which is directly applicable to the volume of cosmological interest. We measure a significant correlation () between the host-galaxy stellar-mass and the SN Ia Hubble Residuals (HR). We find a weak correlation () between the host-galaxy metallicity as measured from emission lines in the spectra, and the SN Ia HR. We also find evidence that the slope of the correlation between host-galaxy mass and HR is steeper in lower metallicity galaxies. We test the effects on a cosmological analysis using both the derived best-fitting correlations between host parameters and HR, and by allowing an additional free parameter in the fit to account for host properties which we then marginalize over when determining cosmological parameters. We see a shift towards more negative values of the equation of state parameter , along with a shift to lower values of after applying mass or metallicity corrections. The shift in cosmological parameters with host-galaxy stellar-mass correction is consistent with previous studies. We find a best-fitting cosmology of , and (statistical errors only).
keywords:
supernovae: general, cosmological parameters, dark energy, cosmology: distance scale,1 Introduction
Type Ia Supernovae (SNe Ia) arise from the explosion of a degenerate carbon-oxygen white dwarf, following either accretion from a non-degenerate companion, or a merger with a white dwarf secondary in a binary system [Hillebrandt & Niemeyer, 2000]. Their relatively uniform peak luminosities has led to their use as standardisable candles for cosmology, where they can be used to probe the expansion of the Universe, and the acceleration of this expansion due to dark energy [e.g. Riess et al., 1998, Schmidt et al., 1998, Perlmutter et al., 1999, Sullivan et al., 2011].
The absolute magnitude of an SN Ia at maximum light correlates strongly with the rate of decline seen in the B-band after peak [the light-curve ‘stretch’, Phillips, 1993], and with SN Ia colour [Riess, Press & Kirshner, 1996]. By applying empirical calibrations to a large sample of SNe Ia, the intrinsic dispersion in their peak magnitudes is sufficiently reduced that they can be used to accurately derive cosmological parameters. More recently, the availability of precise, well-calibrated photometry for large samples of SNe Ia has motivated searches for additional correlations between Type Ia SNe and their spectroscopic properties [e.g. Foley & Kasen, 2011] or host-galaxy characteristics [e.g. Sullivan et al., 2010, Childress et al., 2013a]. The identification of any such correlations can be used to further reduce the scatter in the Hubble diagram, and improve estimates of the Hubble constant H0 and equation of state . Identifying relationships between SNe Ia properties and their host galaxies can also help shed light on the progenitor systems and physical mechanisms which lead to SNe Ia [e.g. Maguire et al., 2013].
Previous SN studies, such as Kelly et al. [2010], Sullivan et al. [2010], Lampeitl et al. [2010a], D’Andrea et al. [2011], Li et al. [2011], Gupta et al. [2011], Johansson et al. [2013], Childress et al. [2013a], Pan et al. [2014] have shown that there are correlations between the peak brightness of an SN Ia, and certain properties of its host galaxy. Of those, the correlation between host-galaxy stellar mass and SNe Ia brightness (after correction for SN stretch and colour) has been investigated the most. Kelly et al. [2010] have shown that more massive galaxies tend to host SNe Ia that are 10 per cent brighter after light-curve corrections at 2.5 confidence. Sullivan et al. [2010] demonstrated that separating a sample of SNe Ia according to whether they had a low or high-mass host galaxy, and using two different values of (the peak absolute magnitude in the distance modulus calculation) for these samples improves the precision of the fitted cosmological parameters by . They found that the absolute value of the offset is 0.08 mag at 109 M⊙, with 4 confidence.
It is quite likely, however, that the host-galaxy mass is merely a proxy for an underlying physical property such as metallicity, as any individual SN Ia should be ‘unaware’ of (and hence unaffected by) the total mass of its host. Several previous studies have investigated the host-galaxy metallicity, including D’Andrea et al. [2011], Johansson et al. [2013], Childress et al. [2013a], Pan et al. [2014], who all found that SNe Ia in higher metallicity galaxies are over luminous for their light-curve shape and that their Hubble Residual (HR; the difference between the measured distance modulus and that expected from the best-fitting cosmology) are 0.1 mag brighter, at confidence levels varying between [Johansson et al., 2013], [Pan et al., 2014], [Childress et al., 2013a] and [D’Andrea et al., 2011]. However, as spectroscopy is required to measure galaxy metallicity, it is a much harder property to measure than mass, and hence samples are smaller.
Other studies have investigated regions of local star formation. Rigault et al. [2013] used the SN Factory sample, while Rigault et al. [2015] used the Constitution sample to investigate areas of local star formation using Galaxy Evolution Explorer (GALEX) FUV/NUV data. They showed that SNe in locally star-forming environments are on average mag fainter than SNe Ia having locally passive environments. They also caution that if the ratio of SNe Ia in local star-forming environments changes with redshift or sample selection, this can lead to a bias in cosmological measurements. However, Kelly et al. [2015] show that the distances to SNe in locally star formation regions can be calibrated to per cent. They suggest that the smaller scatter in this sample is due to only one progenitor type erupting in these regions. However, Jones et al. [2015] see no correlation between the regions of local star formation and the SN parameters.
We also note that some authors have found the correlation between host-galaxy mass and HR to be much less significant than that found by Sullivan et al. [2010] and others. Rather than matching to a template, Kim et al. [2014] fit SNe Ia light curves by modelling them as stochastic functions described by Gaussian Processes. Using this different technique for fitting SNe Ia, they find no evidence for host-galaxy mass to HR relation. The residual step at 1010 M⊙ is 0.0130.031 mag, which is consistent with zero. They interpret the absence of a correlation as a result of their technique of light curve fitting, which they argue can better account for diversity in SNe Ia.
In this paper, we use the photometrically-classified sample of SNe Ia from the Sloan Digital Sky Survey II (SDSS-II) SN Survey, presented by Campbell et al. [2013], to investigate correlations between the properties of the host galaxies of SNe Ia, and the properties of the SNe Ia themselves. In Sections 2 and 3, we introduce the data and techniques used; in Section 4, we present the analysis of possible correlations; in Section 5, we discuss analyses of subsets of the data, while in Sections 6 and 7, we calculate the effect of these correlations on derived cosmological parameters, and discuss their implications.
We note that a paper by Wolf et al. [2015] has recently been submitted, which seeks to address some of these same questions using the SDSS-II data set. However, there are significant differences between these two papers; Wolf et al. focus on performing a careful reanalysis of all the host-galaxy properties (such as metallicity and mass), while we use the standard SDSS products. In this work, we also examine the effect of our results on cosmological fits. Two independent analyses of the same data also function as a useful check on the reliability of the results obtained; we discuss this further in Section 4.5.
2 Data and methodology
2.1 SDSS-II SN sample
The SDSS-II SN Survey [Frieman et al., 2008, Sako et al., 2008, 2014] was a dedicated search for intermediate-redshift SNe Ia between 2005 and 2007, in a 300 deg2 field called ‘Stripe 82’. The survey was carried out in multicolour (ugriz) imaging, for three months per year, on the SDSS 2.5m telescope [Gunn et al., 1998]. After three years of observations, more than 500 SNe Ia had spectroscopic confirmation [Zheng et al., 2008, Konishi et al., 2011, Ostman et al., 2011]. The spectroscopically confirmed sample of SDSS-II SNe Ia has now been used to constrain cosmological parameters both independently [Kessler et al., 2009, Sollerman et al., 2009, Lampeitl et al., 2010a] and in a joint analysis with the Supernova Legacy Survey [SNLS; Betoule et al., 2014]. The SDSS-II SN sample has also been used to measure the SN Ia rate [Dilday et al., 2008, 2010, Smith et al., 2012], examine the rise-time distribution [Hayden et al., 2010] and study the correlations between SNe Ia and their host galaxies [Lampeitl et al., 2010b, D’Andrea et al., 2011, Gupta et al., 2011, Galbany et al., 2012, Hayden et al., 2013] and spectroscopic indicators [Konishi et al., 2011, Nordin et al., 2011, Foley, 2012].
SDSS also identified a large sample of potential SNe Ia which were not spectroscopically confirmed. Campbell et al. [2013] demonstrated that if these candidate SNe could be photometrically classified with sufficient efficiency and purity, then they could also be used for cosmological purposes. To make robust photometric classifications it is necessary to know the host-galaxy redshift. Therefore, an ancillary program was run as part of the SDSS-III Baryon Oscillation Spectroscopic Survey [BOSS; Dawson et al., 2013, Olmstead et al., 2014] between 2009 and 2010 to obtain the spectra and redshifts of the host galaxies of a large sample of SN candidates detected by the SDSS-II SN Survey. Details of the target selection and data reduction for this sample of galaxies are outlined in Campbell et al. [2013], and details of the data analysis and redshifts for the sample are presented in Olmstead et al. [2014]. In total, 3520 redshifts were measured for the host galaxies of SN candidates (and other transients), to a limiting galaxy magnitude of mag.
A sample of 752 high-quality photometrically-classified SNe Ia for use in cosmological analyses was constructed in Campbell et al. [2013]. This sample was selected on the basis of a Bayesian light curve classifier, PSNID [Sako et al., 2011], which uses SNe templates and fits to SALT2 templates [Guy et al., 2007], combined with stringent data-quality cuts. The sample covers the redshift range of . Using detailed survey specific simulations Campbell et al. [2013] estimate the completeness to be 70 per cent and the remaining contamination from non-Ia SNe to be per cent. This photometrically-classified SNe Ia sample was shown to produce comparable and competitive constraints when compared to cosmological analyses from the SNLS spectroscopically-confirmed SNe Ia sample [Guy et al., 2010, Sullivan et al., 2010].
We use the sample from Campbell et al. [2013] throughout this paper and the host-galaxy properties determined from the BOSS spectra. This sample is slightly different from the photometrically-classified sample presented in Sako et al. [2014], due to differences in host galaxy association and selection cuts in constructing the sample. However, to carry out cosmological analysis of such a magnitude limited sample it is necessary to correct for Malmquist bias, hence we use the Campbell et al. [2013] data set and the Malmquist bias correction derived within. We also note that within the 752 photometrically-classified SNe Ia in the Campbell et al. [2013] sample, a subset of 208 SNe Ia have an additional spectroscopic classification.
All the SNe Ia have been fitted by the SALT2 light-curve fitter, this models the spectral energy distribution (SED) evolution of SNe Ia and their intrinsic variation using SNe Ia templates, and parameterizes the SNe Ia by three parameters; the stretch (), colour and apparent magnitude. The stretch, , is a fitting parameter which is used to scale the observed light curve of an SN Ia to a template. The colour is defined by .
The SALT2 parameters from the light curve fits are used to calculate the distance modulus to each SN Ia:
| (1) |
Where is the Malmquist bias correction, (in this paper, we show results with and without this correction, denoted HRcorr and HRuncorr, respectively) and which is defined by an analytic prescription laid out in Campbell et al. [2013] from modelling using SNe Ia simulations with the SuperNova ANAlysis (SNANA) code Kessler et al. [2009]. The Malmquist bias correction is defined as:
| (2) |
where , , and .
The parameters and (absolute -band magnitude at peak) are constants that can either be derived for the whole sample simultaneously with the best-fitting cosmology, or can be constrained from other data. In our cosmology analysis, presented in Section 6, we follow the same procedure as in Campbell et al. [2013] and we allow and to float within priors and analytically marginalize over (which is degenerate with ).
The HR for each SN is calculated by subtracting the best-fitting cosmology found in Campbell et al. [2013] ().
2.2 Host-galaxy properties
We adopt the SDSS DR10 [Ahn et al., 2012] host-galaxy parameters for all the SNe Ia hosts where these are available. Unfortunately, 150 of our SNe Ia host galaxies are missing processed host-galaxy spectral properties, as these were taken during commissioning of BOSS and were not fully processed by the SDSS-II BOSS pipeline and thus are not in the DR10 Portsmouth ‘Stellar Kinematics and Emission Line Fluxes’ tables [Thomas et al., 2013] used in this analysis. As these 150 SNe are a random subset of the full distribution, they should not bias the results presented in this paper.
Initially, host galaxies were divided into star-forming and passive categories, according to flags in the Portsmouth ‘Stellar Kinematics and Emission Line Fluxes’ DR10 tables. These classifications (and further sub-classifications) are based on the galaxies location on a ‘Baldwin, Phillips & Terlevich’ (BPT) diagram. This is a plot of emission line flux ratios, ([OIII]5007)/(H4861) against ([NII 6583)/(H6563); Baldwin et al., 1981). When an active galactic nucleus (AGN) is present in a galaxy, its line emission can dominate over the line flux from star formation, rendering measurements of the latter difficult. As a first attempt at removing AGNs, we applied the same thresholds as in Kewley et al. [2001], which removed 154 host galaxies from our sample.
We also investigated an alternative way of removing AGN from our sample, as many of our galaxy spectra have low S/N spectra and it is difficult to get significant detections of all four lines required to place a galaxy on a BPT diagram. Carter et al. [2001] suggested removing AGN using a ‘two-line’ diagnostic. They define galaxies as having an AGN if log(([NII 6583)/(H6563)). Miller et al. [2003] showed that all four lines are required to robustly classify star-forming galaxies but that the ‘two-line’ diagnostic is adequate for removing AGN. This ‘two-line’ diagnostic only removed 20 galaxies as likely AGN hosts. We carried out the subsequent analyses with both AGN diagnostics and found consistent correlations between the host galaxy and SNe Ia parameters for both samples. In the following sections, we show the results from the ‘two-line’ AGN diagnostics. It is worth noting that many correlations became slightly stronger, as might be expected from larger sample sizes, however the metallicity correlation with the SNe Ia HR becomes slightly less significant (from 1.8 to 1.4) possibly due to the inclusion of lower S/N data. After removing AGNs from our sample, using the ‘two-line’ diagnostic, we are left with 543 star forming and 38 passive host galaxies.
The stellar mass of a galaxy can be derived by comparing the observed broad-band photometry to the best-fit spectral energy distribution (SED) template. The grid of templates are based on stellar population models, and cover a range of physical parameters (i.e., ages, dust content, chemical composition). The stellar mass of all BOSS galaxies, including our SNe Ia host galaxies, have been calculated using the Maraston et al. [2006] population synthesis models [Maraston et al., 2013]. The ‘HyperZspec’ code used by Maraston et al. [2013] to calculate the masses is a modified version of ‘HyperZ’ [Bolzonella et al., 2000], with the SED fitting performed at a fixed redshift, which is derived from the spectra. HyperZspec computes the for a large number of templates, with varying star-formation histories, and identifies the best-fitting template.
There are four masses computed for each galaxy in SDSS DR10, one with the best-fitting passive model and one with the best-fitting star-forming model, for both a Salpeter and Kroupa Initial Mass Function (IMF). We use the fits from the Kroupa IMF throughout this paper. We use the stellar mass from the star-forming model for the host galaxies which have been classified as ‘star forming’ or ‘composite’ and the passive model for all other host galaxies.
We use the ages presented in Maraston et al. [2013] and again use the star-forming ages for the hosts with BPT flag ‘star forming’ or ‘composite’, and passive ages for others.
Measuring gas-phase metallicities from intermediate resolution and low S/N spectra is a long-standing problem. Ideally, the metallicity would be measured via the so-called ‘direct method’, where the auroral [O iii] 4363 line is used to determine the electron temperature of the emitting region, and forbidden emission lines are used to measure abundances. However, the [O iii] 4363 line is typically only detectable for 0.5 Z⊙, as above this threshold the gas is cooled via metal lines in the IR, and the auroral lines cannot be measured. Instead, we have used the strong-line diagnostic O3N2 [Pettini & Pagel, 2004] to determine metallicities for our sample. O3N2 = log[([O iii]5007/H) / ([N ii]6583/H)], and is valid over the metallicity range 8.1 12+log[O/H] 9.1 dex. The O3N2 diagnostic has several advantages, namely that it is single-valued111Some other diagnostics, such as the R23 method [Pilyugin, 2001, Pilyugin & Thuan, 2005, Liang et al., 2007, Yin et al., 2007], are double-valued, with a degenerate high (12 + log[O/H] 8.5) and a low (12 + log[O/H] 8.5) metallicity solution for a given line ratio., and that it is largely unaffected by reddening, as the two line ratios [O iii]/H and [N ii]/H rely on lines which are close in wavelength.
For the emission line fluxes we again use the results from the SDSS DR10 [the ‘Portsmouth results’; Thomas et al., 2013]. These are measured using an adapted version of the Gas and Absorption Line Fitting code [GANDALF v1.5; Sarzi et al., 2006] to derive emission line properties. GANDALF simultaneously fits stellar population and Gaussian emission line templates to the galaxy spectrum, in order to separate out the stellar continuum and absorption lines from the ionized gas emission. The effect of diffuse dust in the BOSS galaxies is taken into account assuming a Calzetti [2001] extinction law.
When deriving metallicities, we selected only host galaxies which were classified in SDSS as either ‘star-forming’ or ‘composite’, and which had measured fluxes in H, H, [O iii]5007 and [N ii]6583; each with an amplitude-over-noise (AoN) of greater than 1.4. For lines which are detected below this threshold we set lower limits on the metallicity. As discussed previously, metallicities were not measured for AGN hosts.
After excluding AGNs, we obtain a sample of 581 SNe Ia, of which 322 have AoN for the lines needed to measure the metallicity. For the other 259 host galaxies we use the continuum flux in the region where emission lines are expected, to set an upper limit on their flux, and thus on the metallicity of the galaxy. We use the midpoint between this measured upper limit on the metallicity and the lower expected value for ‘normal’ galaxies (12+log[O/H] = 7.10) as the estimate of the metallicity when testing for correlations and use the range between these two bounds as the error. Thus, these galaxies have extremely large error bars, they do not significantly affect the correlation fits, but are included for completeness. As a further test, these metallicity limits were excluded from the investigation of the correlations between SNe Ia and host-galaxy parameters and consistent results were obtained (see Appendix A).
There are now emerging new (and improved) methods for measuring the metallicities of galaxies [Kudritzki et al., 2014]. These stellar metallicities are based on low-resolution spectra of blue supergiant stars, using the such elements as iron, titanium, magnesium. However, as we are only concerned with ordering the host galaxies by their metallicities the absolute values are not so important.
We estimate the Star Formation Rate (SFR) for the galaxies using the H line strength. We use H as it is an intrinsically strong line and is located in the redder part of the spectrum, and so is less susceptible to dust extinction. The SFR estimates from the H line are nearly instantaneous measures as the H line is produced by ionizing photons which are generated by massive, young stars. We use the Kennicutt [1998] relation to relate the H luminosity to the SFR:
| (3) |
where is measured in erg s-1. We measure the SFR for 523 non-AGN host galaxies, where the H line is measured with AoN 1.4 (385 galaxies). The specific Star Formation Rate (sSFR) is a measure of the SFR in each host galaxy, scaled to the mass of the galaxy, i.e. per unit stellar mass. Additionally, for 58 galaxies where the flux was too low to actually measure the emission in H, the continuum was used to place an upper limit on the H emission, and hence set an upper limit on the SFR.
Table 1 summarizes the sample size used in each analysis.
| Cut | Number kept | Notes | Sample |
|---|---|---|---|
| Full sample | 752 | ||
| Fitted spectra | 602 | 150 removed | |
| AGN ‘two-line’ cut | 581 | 21 removed | Mass and age |
| H AoN 1.4 | 581 | 523 values, 58 limits | SFR and sSFR |
| All lines 1.4 | 581 | 332 values, 259 limits | Metallicity |
3 SNe Ia and host-galaxy properties distributions
Fig. 1 shows the distributions of the SNe Ia parameters in our sample. The HR show a Gaussian distribution centred around zero, as might be expected from their definition as the residual for individual SNe from the best-fitting overall cosmology. The SALT2 parameter distribution has a skewness of only , i.e. slightly more bright SNe Ia. This is to be expected in magnitude limited surveys, as at the limit of the survey brighter SNe Ia will preferentially be observed. This Malmquist bias is corrected for within the cosmological analysis, although the effect is relatively small on the skewness of . This is consistent with previous studies, such as Pan et al. [2014] and Rigault et al. [2013] who saw an even stronger bias to higher stretch SNe Ia. The colour distribution has a larger skew in its distribution (skewness = 0.28), and has a peak consistent with zero () for most SNe Ia but with a longer tail to redder colours. This is again consisted with previous studies [Johansson et al., 2013, Rigault et al., 2013, Pan et al., 2014].
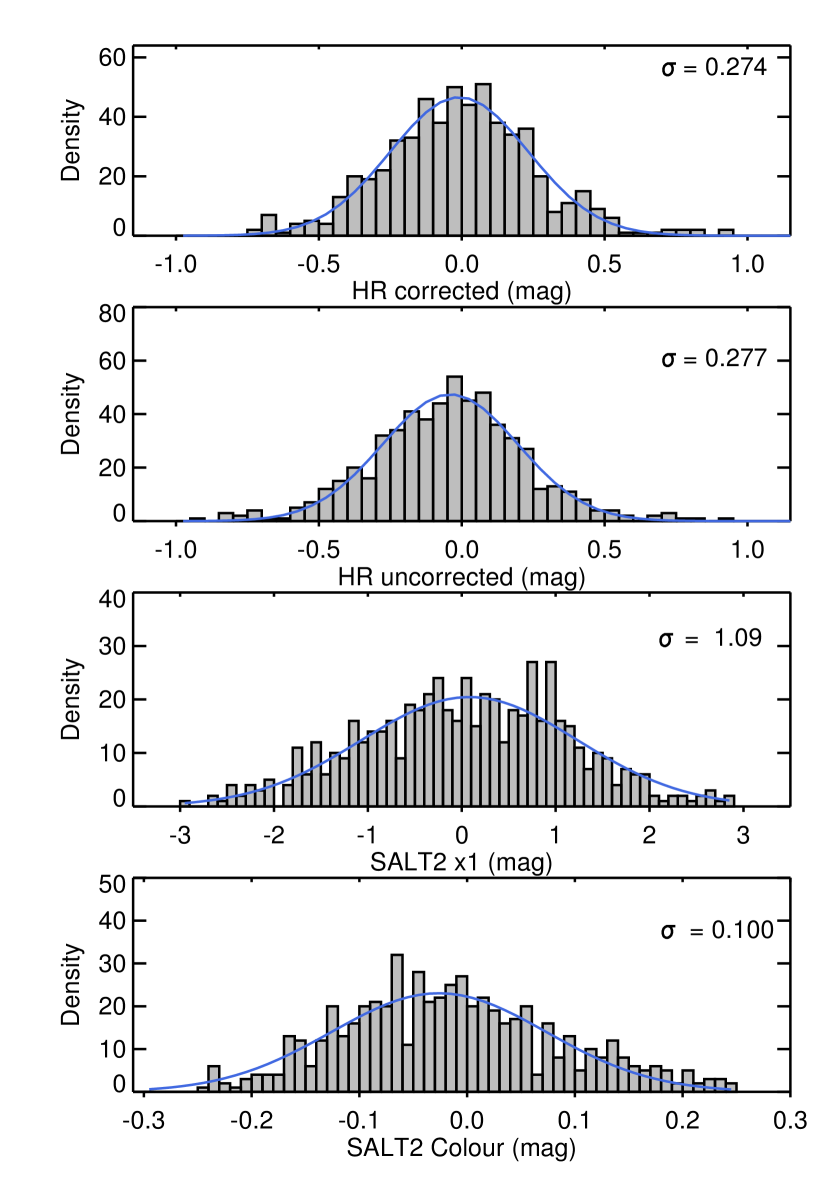
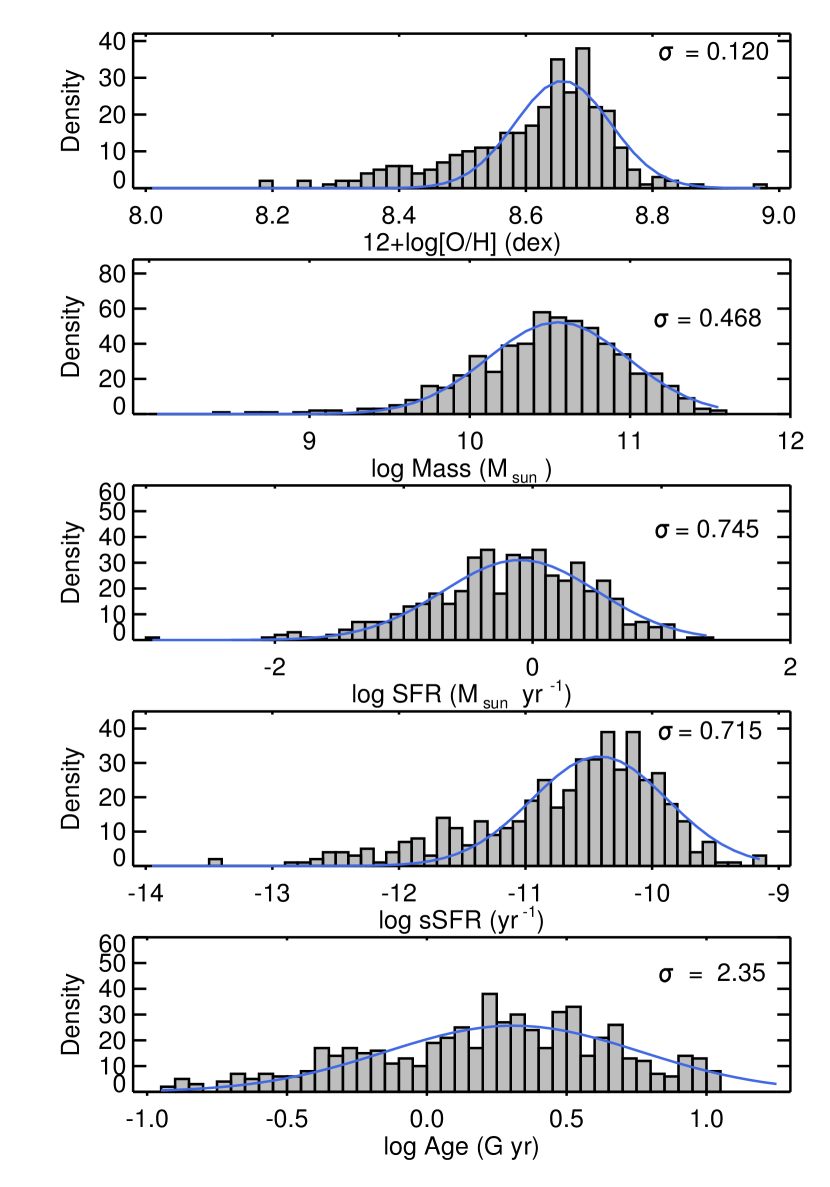
Fig. 2 shows the distributions of SNe Ia host-galaxy parameters in our sample. The distribution of measured metallicities (i.e. excluding upper limits) has a skewness of and an excess kurtosis of 0.94. The host-galaxy stellar mass distribution appears to be similar to previous SNe Ia host galaxy studies [Kelly et al., 2010, Rigault et al., 2013, Pan et al., 2014], with a skewness of and an excess kurtosis of 1.04. However, we seem to lack the lower mass host-galaxy population seen by some studies [Lampeitl et al., 2010a, Childress et al., 2013a]. The cause of this apparent difference is unclear, but may be due to the methods chosen for calculating the stellar mass, for example Lampeitl et al. [2010a] used the PEGASE2 code [Fioc & Rocca-Volmerange, 1997, 1999] to calculate the stellar mass. Our host-galaxy mass distribution is consistent with the low redshift SDSS galaxy distribution [Li & White, 2009].
The SFR distribution is relatively Gaussian, with a peak at M⊙ yr-1. The peak of the SFR distribution is shifted with respect to a comparable galaxy sample from photometric SFRs for the MPA-JHU SDSS catalogue [Brinchmann et al., 2004] and the SNFactory SN host analysis [Childress et al., 2013b]. Our sample appears to lack the high SFR host galaxies seen by Brinchmann et al. [2004] and Childress et al. [2013b], however, a direct comparison is difficult as these other analyses use photometric estimates of the SFR rather than that measured from the H emission. The distribution of sSFR has a skewness of and an excess kurtosis of 1.06. We also find a tail in the population of host galaxies which have lower SFRs, extending beyond the Gaussian envelope.
The logarithm of the age distribution is relatively Gaussian, with a skewness of 1.50 and an excess kurtosis of 1.88. This is quite different to the age distribution of the BOSS galaxies [Maraston et al., 2013], which have a flat distribution with age. This shows that light in the majority of our SNe Ia host galaxies is dominated by young stellar populations, although again there is a tail comprising of galaxies with ages up to 11 Gyr.
4 Correlations between SNe Ia and host-galaxy properties
To test for correlations between SNe Ia parameters and host-galaxy properties, we employed a Bayesian linear regression technique (fitting a function of form ), using the linmix_err package [Kelly, 2007] for idl. This method derives a likelihood function for the data being investigated using a Markov Chain Monte Carlo (MCMC) algorithm. The model accounts for measurement error in both parameters in the linear regression, and intrinsic scatter in the regression relationship. The technique outperforms other common estimators, and has been shown to be robust even when the measurement errors dominate the observed scatter, or when the distribution of independent variables are not Gaussian. As we are fitting data with large error bars, we set the METRO = 1 flag in linmix_err, so that the Metropolis-Hastings algorithm is used rather than the default Gibbs sampler, as this is helps when the measurement errors dominate the scatter in and . As mentioned previously, when we have upper limits we use the midpoint between the lower expected value for galaxies (metallicity = 7.1 dex; SFR = ) and the measured value, with the error bar stretching over the full range. We also repeat the analysis removing the limits, following the prescription for Kelly [2007]. Kelly outline a method for including limits or censored data in linmix_err in the dependent () variable. However, they suggest if the independent variable () is the limit then it is simpler to omit these limits, as inference on the regression parameters is unaffected when a sample is selected based only on the independent variables. With this smaller sample with only measured parameters we find consistent correlations (see Appendix A for correlations excluding upper limits).
The null hypothesis in our analysis is that there is no correlation between any of the SN parameters and the host galaxy parameters. We can reject this when a significant fraction of the MCMC samples are inconsistent with zero. The significant of the correlations is derived from the percentage of the posterior distribution which lies below zero (or vice versa for inverse correlations), while the uncertainty on the correlation is determined by from the 1 error on the Gaussian fit to the posterior distribution.
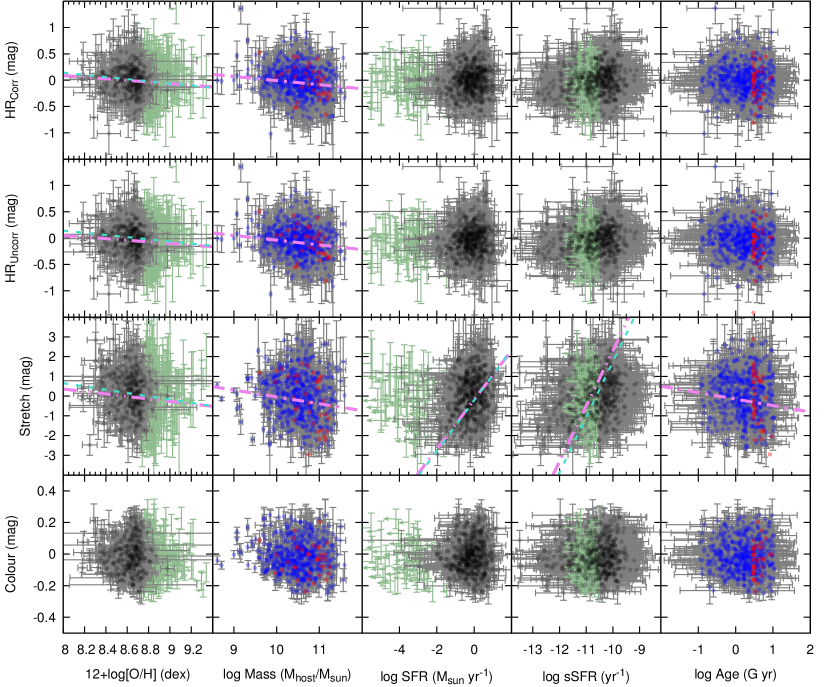
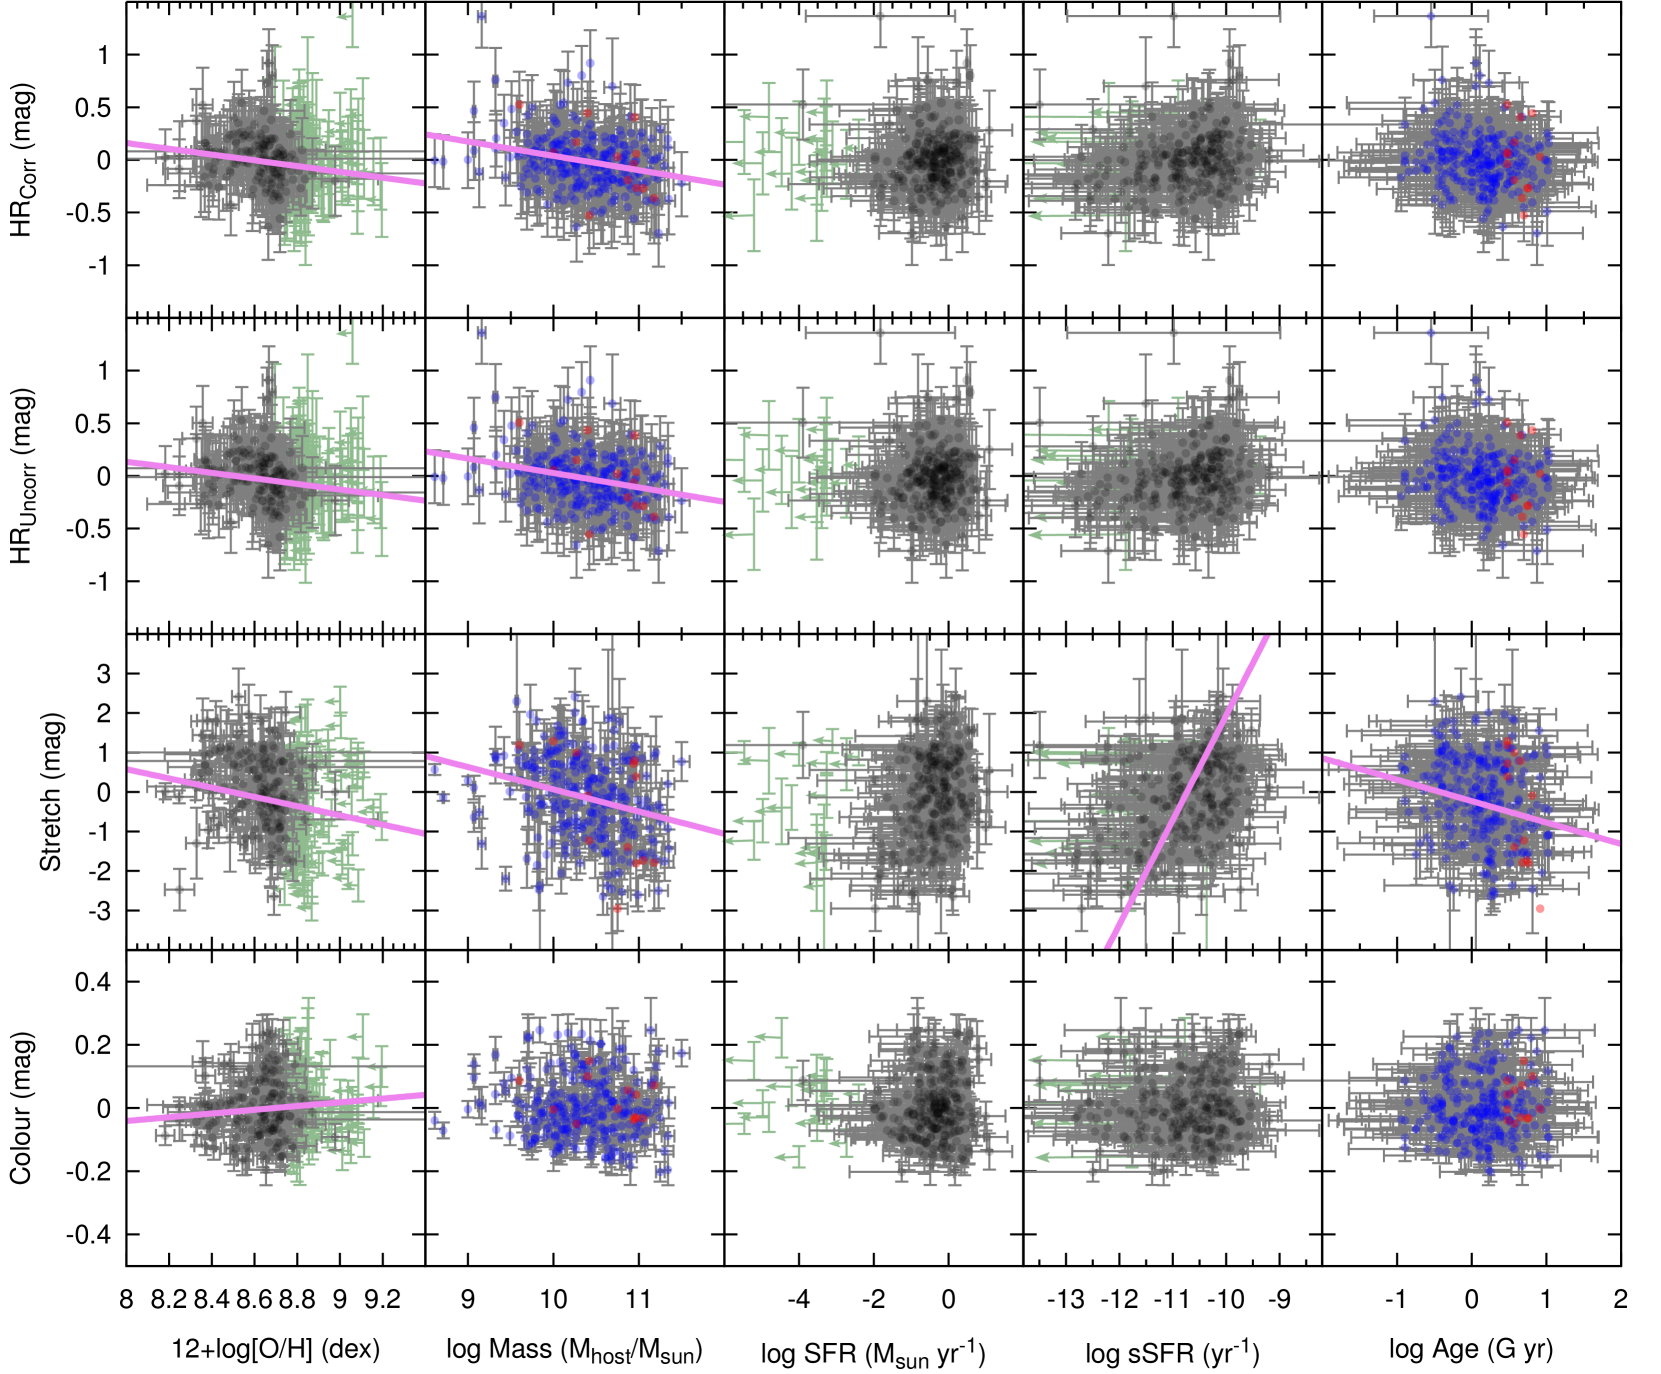
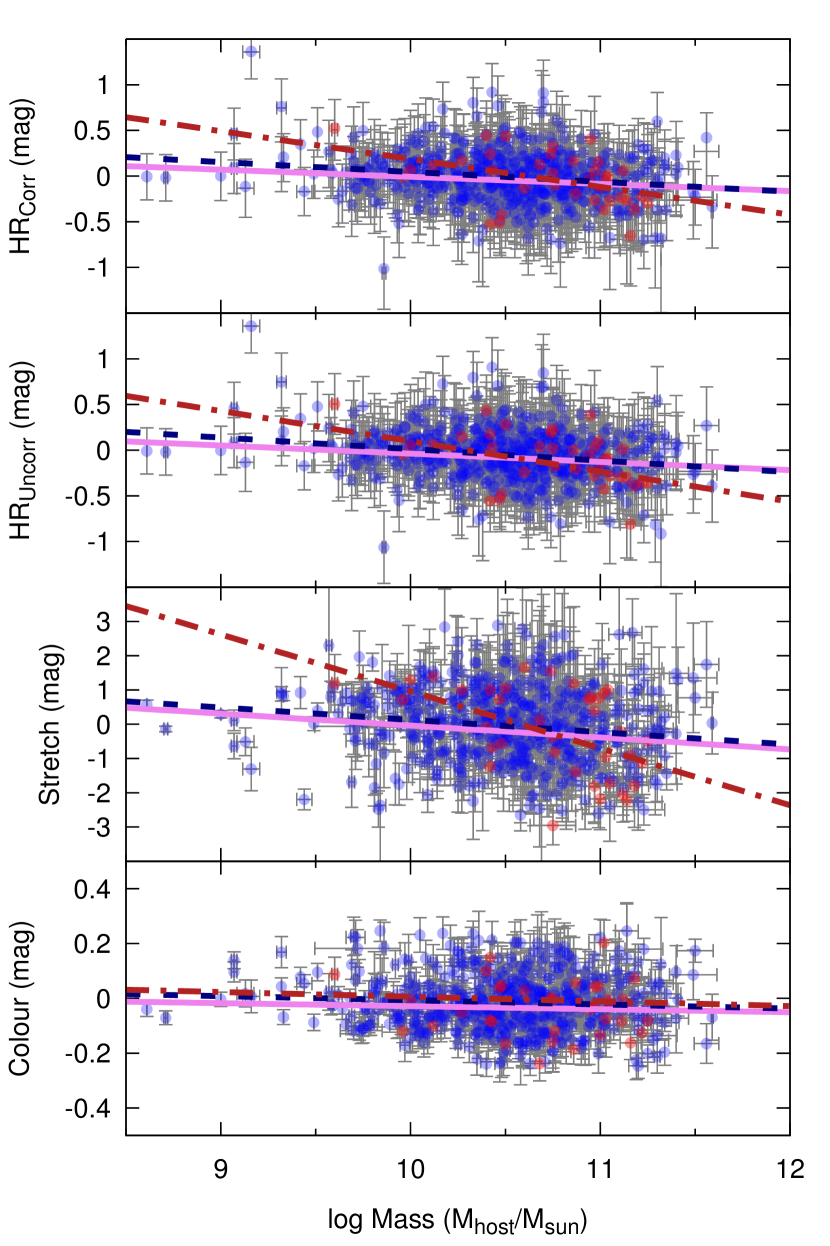
The HR (both before and after correction for Malmquist bias, see Campbell et al. [2013] for details), SNe Ia colour and value from the SALT2 fit (presented in Campbell et al., 2013) were compared to the host-galaxy metallicity, mass, age, SFR and sSFR. The plots for all combinations of SNe Ia and galaxy parameters are shown in Fig. 3. The distributions are fitted with a line where we found a significant correlation. The best-fitting parameters and the significance are shown in Table 2.
By definition, if we take 20 samples from a Gaussian distribution, then 7 of them will lie from the mean. As we are looking at 20 potential correlations between host galaxy and SN properties, we must be cautious of finding significant results for this reason. We hence adopt a 3 limit for our correlations; the chances of one of our twenty correlations being significant at this level by chance is 5 per cent. We note that in the following we find the correlation between host metallicity and HR to be less significant than this threshold, however, as a significant correlation has been found by other authors, it is still of interest to discuss here.
| (mag) | sig | % | |||
|---|---|---|---|---|---|
| Metallicity | HR corr | mag/dex | 82% | ||
| - | HR uncorr | mag/dex | 82% | ||
| - | mag/dex | 82% | |||
| - | colour | mag/dex | 73% | ||
| Mass | HR | 100% | |||
| - | HR uncorr | 100% | |||
| - | 100 % | ||||
| - | colour | 95.83 % | |||
| SFR | HR corr | mag/ | 81.61% | ||
| - | HR uncorr | mag/ | 82.66% | ||
| - | mag/ | 100% | |||
| - | colour | mag/ | 95.99% | ||
| sSFR | HR corr | mag/ | 66.90% | ||
| - | HR uncorr | mag/ | 70.03% | ||
| - | mag/ | 100% | |||
| - | colour | mag/ | 86.55% | ||
| Age | HR corr | mag/(Gyr) | 97.25% | ||
| - | HR uncorr | mag/(Gyr) | 97.79% | ||
| - | mag/(Gyr) | 99.92% | |||
| - | colour | mag/(Gyr) | 69.79% |
4.1 Metallicity
The left column of Fig. 3 shows the potential correlations between the SNe Ia parameters and the metallicity of the host galaxy. The correlations between host-galaxy metallicity and HR all have a significance of between 1.2 and 1.4, so these do not pass the 3 threshold adopted previously. We see a slight correlation (with a low significance of ) between the host-galaxy metallicity and the HR, both with and without the Malmquist bias correction. The slope of the correlation for the corrected HR is mag/dex. The direction of the trend is such that metal rich galaxies have slightly brighter SNe Ia after they have been standardized using SALT2 and colour (i.e. they have a negative HR).
This trend is in general agreement with previous studies [D’Andrea et al., 2011, Konishi et al., 2011, Childress et al., 2013a, Johansson et al., 2013, Pan et al., 2014]. D’Andrea et al. [2011], using 40 SDSS-II SNe Ia in emission-line galaxies, found that light-curve corrected SNe Ia are 0.1 magnitudes brighter in high-metallicity hosts than in low-metallicity hosts, at 4.9 significance. A comparison between the slope of the relation we find and that found by other authors is shown in Fig. 4. Our results appear to be consistent with all previous slopes apart from Johansson et al. [2013], who see a steeper slope but do not find it to be statistically significant (). However, it is hard to directly compare our analysis to Johansson et al. [2013], as they calculate metallicities from derived Lick indices. Our sample is 8 to 14 times large than these previous studies (when we include the limits from the continuum flux, or 4 to 5 times larger with only the measured values).

While we do not see strong evidence for a correlation between the gas-phase metallicity of the host galaxy and either the SN stretch () or colour, previous studies by Pan et al. [2014] and Childress et al. [2013a] saw a consistent correlation between these parameters. Pan et al. and Childress et al. found that low-metallicity galaxies preferentially host broader (higher ) and redder (higher SALT2 colour values) SNe Ia (before light-curve correction), with 98% and 2.9 confidence, respectively. Childress et al. [2013a] has considerably smaller errors bars, this may be due to the lower redshift range of the SNFactory sample used in their analysis () allowing for high-quality SN light curves to be obtained. In addition, the host-galaxy spectral follow up was carried out on 4–8m class telescopes, yielding high S/N spectra and hence more precise measurements of metallicities.
It is perhaps surprising that a stronger correlation between the metallicity and SN HR is not observed. One might wonder if this is due to our low S/N data, however removing the limits and using only the sample below (which should have higher S/N spectra) does not significantly increase the significance of the correlation. We suggest that it might be that the integrated metallicity of the entire galaxy is not representative of the local environment where the SN progenitor formed, which may correlate stronger with the HR [Rigault et al., 2015].
4.2 Mass
The second column of Fig. 3 shows the potential correlations between the SNe Ia parameters and the stellar mass of the host galaxy. Fig. 5 shows magnified plots for all significant correlations between the host-galaxy mass and the SNe Ia parameters. We see a highly significant () correlation between the stellar mass of the host galaxy and both the Malmquist bias corrected and uncorrected HR; SNe Ia which are brighter after light-curve correction preferentially explode in more massive hosts. We found the slope of this trend to be , which is consistent with most previous works. There also appears to be an offset between the passive and star-forming host galaxies, with more massive passive host galaxies with negative HRs, discussed further in Section 5.3. This is consistent with the idea that the mix of prompt and delayed channels varies between the passive and star-forming hosts, with the delayed channel dominating in passive host galaxies. It is surprising that the HR correlation with host-galaxy stellar mass () is much more significant than the correlation with metallicity (). Although our sample of hosts with measured metallicity contains of only 332 galaxies (the other 259 having upper limits), a sample which is a factor of two smaller seems unlikely to account for a correlation which is a factor of six weaker. Indeed, if we test fitting the mass – HR correlation with only the 332 galaxies with measured metallicity, we still find a correlation, which actually has a steeper slope of (or a slope of when the HRs are uncorrected for Malmquist bias).
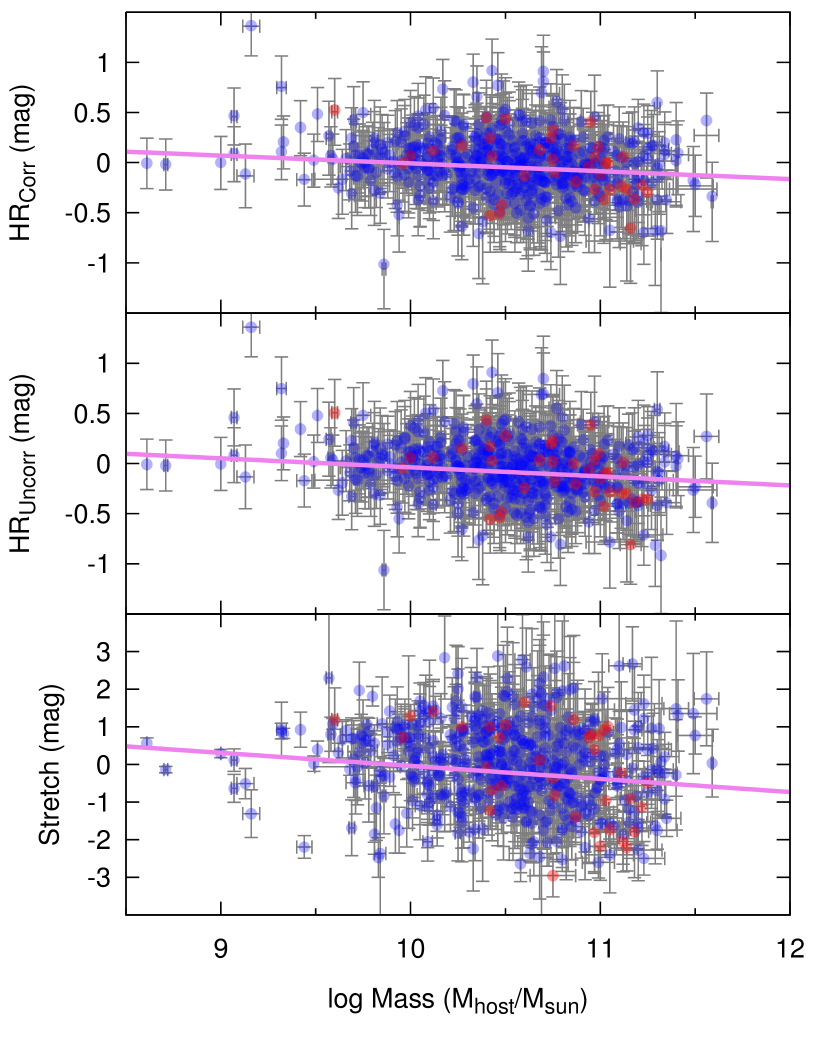
Fig. 6 shows a comparison of the host-galaxy mass versus HR slope from our work and that found in other analyses. Although we find a slope which is consistent with most previous studies, using our Malmquist bias corrected sample, our slope is slightly steeper than that found by Childress et al. [2013a] using 115 SNe from SNFactory, who find a slope of ,

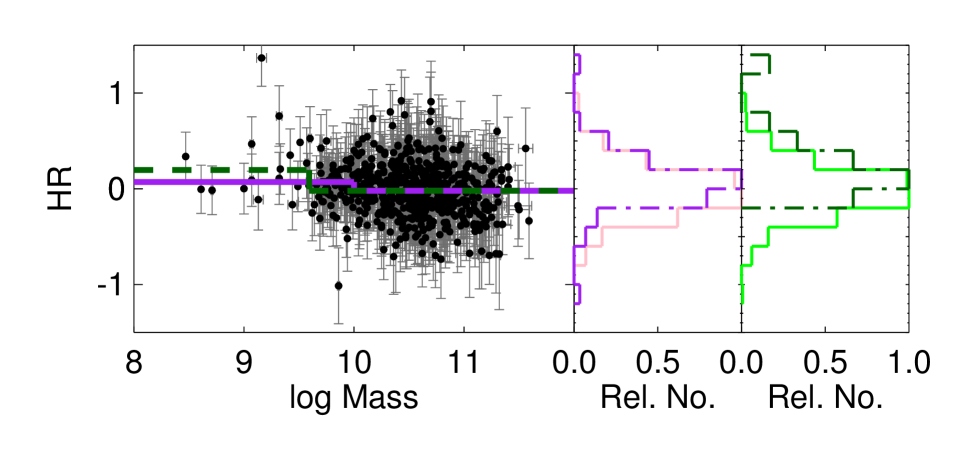
Other studies have split their sample of hosts into low- and high- mass galaxies, and fit each with a different value for the absolute magnitude of SNe Ia, consistent with the direction of the trend we see in our data. We investigate dividing the sample into two subsamples, with a host-galaxy mass either above or below a threshold of , and fit a constant to each distribution of HRs using least squares. We then also investigate allowing the position of split between the two populations to vary as a free parameter. Fig. 7 shows these two fits to the data. We find that when the split is fixed at host-galaxy stellar mass of the offset in HR between the two populations is mag, with a significance of 2.5. This offset between the two populations is comparable to that found in previous studies. Kelly et al. [2010] using a sample of 70 low redshift SDSS-II SNe Ia found that physically larger, more massive hosts have SNe Ia that are per cent brighter after light-curve correction, which is an 0.11 mag offset in HR for SNe Ia in low and high-mass hosts (which they define as log M) at 2.5 significance. Sullivan et al. [2010], using 195 SNe Ia from SNLS showed that events of the same light-curve shape and colour are, on average, 0.08 mag (4.0) brighter in massive host galaxies (which they define as ) and galaxies with low sSFR. When the position of the split is allowed to vary, the best fit is found to be with a threshold of , and the offset in HR between the two populations is increased to 0.262 mag. While this is at a lower significance of only of 1.4, it is a larger HR offset than found in previous studies. With a freely varying mass threshold, the high mass subset has the same fit as when the split was forced to be at . However, the low-mass population contains more positive HRs when the split between populations is allowed to vary, although it also consists of a smaller sample. There are only 18 SN below the cut, so per cent of the population are above the split, which in fact seems more consistent with no split. The histograms of HR for low- and high- mass galaxies using these two separations shown in Fig. 7 suggest that the high-mass galaxy sample contains more negative HRs in both cases. Only when the split is allowed to vary do we see a difference in the positive HR distribution, with lower-mass hosts tending to have SNe Ia with a more positive HR, as found by previous studies [Pan et al., 2014]. However, we caution that as there are relatively few SNe Ia (80; 14 per cent of the sample) with host masses below , and the findings for SNe Ia in low-mass hosts rely on small number statistics. To test the effects of this, we drew 80 galaxies at random to determine whether their mean HR differs from the remainder of the sample by more than the difference between the low- and high- mass subsamples discussed previously. Over 100 Monte Carlo iterations, 54% of the instances we recover difference in mean HR between the samples as large as the 0.020 mag difference seen when allowing for a fixed mass cut. From this, we conclude that the difference between the high and low host galaxies is not likely to be significant.
In Fig. 3 and Fig. 5, passive and star-forming galaxies are designated with red and blue points, respectively. As expected, the passive galaxies are more massive, and hence host the SNe Ia with more negative HR. We also see a clear correlation between the stellar mass of the host galaxy and the SALT2 parameter at a significance of . SNe Ia in more massive galaxies tend to have more negative (meaning they have narrower light curves prior to correction). The slope of the correlation between host-galaxy mass and is , which is in agreement with previous studies [Howell et al, 2009, Neill et al., 2009, Sullivan et al., 2010, Childress et al., 2013a, Pan et al., 2014]. Johansson et al. [2013] see a stronger trend (4, in the same direction) between the host-galaxy mass and , with a slope of . When determining this relation, Johansson et al. [2013] include AGN hosts in their sample, which may have some effect on the strength of the correlation.
Finally, we note that in comparing correlations with host-galaxy stellar mass between different studies, we must remain cognizant of the different techniques which were used to derive stellar mass. As discussed in Section 2.2 we use the BOSS Portsmouth results, calculated using the Maraston et al. [2013] models, whereas some other previous studies, including Kelly et al. [2010] and Sullivan et al. [2010] have used PEGASE2 for their stellar mass estimates. Childress et al. [2013a] have considerably smaller errors bars, and this may be due to the wider wavelength range used to calculate the stellar masses (including UV through to IR photometry, rather than just optical photometry which we use here), as well as the lower redshift of their sample.
4.3 Star Formation Rate
Columns 3 and 4 of Fig. 3 show the potential correlations between SNe Ia parameters and the SFR and sSRF of the host galaxy. We find no significant correlation of HR with the SFR or sSFR of the host galaxy. While some other works [Pan et al., 2014] also saw no signs of a correlation between HR and SFR, others [Sullivan et al., 2010, D’Andrea et al., 2011, Childress et al., 2013a] found a trend with sSFR with significance varying between 1.7 and 3.2, where host galaxies with lower sSFR tend to have over-luminous SNe Ia after corrections (i.e. negative HR). D’Andrea et al. [2011] found a correlation, they included passive galaxies in their analysis (defined as having H signal-to-noise10 and failing one of their emission-line cuts). These slight differences we observe between the HR and the SFR or sSFR might be due to the population of low sSFR galaxies with positive HR which were absent in some previous samples [D’Andrea et al., 2011, Childress et al., 2013a].
We see a highly significant correlation () between and the SFR, with broader (higher ) SNe Ia residing in galaxies with higher SFR. This correlation has a slope of mag/ for (or mag/ for with sSFR). This agrees with the recent work from Rigault et al. [2013], where they measure the local star formation and observe that the previously noted correlation between stretch and host mass is driven entirely by the SNe Ia coming from locally passive environments, in particular at the low-stretch end (at 3.8). Our data are not suited to make an analysis of the local environment (see Section 5.2), however using the SFR of the entire host galaxy we see the same trends, particularly at the low stretch end. Additionally, redder SNe Ia appear to reside in galaxies with higher SFR. This correlation has a slope of mag/ (or mag/ with sSFR). This is again consistent with Rigault et al. [2013], who found that SNe Ia with local H emission are redder by mag. The correlation with is also consistent with other previous studies e.g. Sullivan et al. [2010], who saw a difference between low and high sSFR and . The correlation with colour is as one might perhaps expect, as star-forming galaxies contain more dust, and thus some of the SNe Ia colour may be accounted for by host-galaxy reddening. This is in agreement with Pan et al. [2014] who see the same correlation (at 3.1) with SNe Ia colour. The and sSFR, and colour and sSFR are the only correlations to have highly skewed (1.331 and respectively) and high kurtosis (3.039 and 1.847, respectively) posterior distributions for the slope of the correlation.
Rigault et al. [2015] confirmed that that SNe Ia in locally star-forming environments are dimmer than SNe Ia located in locally passive environments using the Constitution sample [Hicken et al., 2009] and host-galaxy data from GALEX. They show that using samples with different distributions of locally passive and star-forming environments for the determination of results in an over estimate. Rigault et al. find the resulting corrected value of to be km s-1 , consistent with estimates of from the cosmic microwave background [Planck Collaboration XIII, 2015].
In contrast, Jones et al. [2015] investigated SNe Ia in locally star-forming environments using GALEX imaging of the hosts of SNe Ia from SDSS-II, SNLS, Pan-STARRS and Supernova Factory and find little evidence that SNe Ia in locally passive environments are brighter, after light-curve correction, than SNe Ia in locally star-forming environments. These authors suggest that the reduction in the significance of potential correlations is due to larger sample size and cleaner SNe Ia selection criteria used for the Betoule et al. [2014] and Riess et al. [2011] samples.
4.4 Age
The final column of Fig. 3 shows the potential correlations between the SNe Ia parameters and the log age of the host galaxy. The only significant correlation we see is between the age of the host galaxy and the SALT2 parameter of the SNe Ia (). Narrower (more negative ) SNe Ia are preferentially found in older stellar populations (with a slope of mag/(Gyr)). This is the same general trend as seen before by Pan et al. [2014] and Johansson et al. [2013]. However, Johansson et al. [2013] found a much steeper slope of at . They see very few old galaxies with broader SNe Ia (positive ) values, where as we see far more of these. This is likely due to us pushing out to higher redshift and thus sampling a larger volume (see Fig. 8, where we restrict our sample to , and find a steeper correlation).
Rigault et al. [2013] suggested that the relation between SNe Ia stretch and host-galaxy stellar mass is mainly driven by age, as measured by local SFR. Rigault et al. [2013] use locally passive environments to show that this drives the -mass correlation, and that SNe Ia with arise exclusively in massive galaxies (log10). This is inconsistent with our findings, where we see a clear (albeit small) population of SNe Ia in low-mass host galaxies with .
4.5 Comparison with Wolf et al.
The results presented here are in general agreement with the correlations presented in Wolf et al. [2015], who used a similar sample of photometrically-classified SNe Ia from SDSS-II, but re-determined host-galaxy parameters, stellar parameters and use stellar masses presented in Sako et al. [2014] which were calculated using Flexible Stellar Population Synthesis [FSPS; Conroy et al., 2009, Conroy & Gunn, 2010]. Both this work and Wolf et al. see a strong correlation with host-galaxy stellar mass ( in this work and 3.6 in Wolf et al.). Wolf et al. find a smaller offset in HR ( mag rather than mag) when correcting for host-galaxy mass using a step function. This is due to the different host galaxy masses adopted for the location of the step function. Both analyses found weak evidence for a correlation between HR and host-galaxy metallicity, at a significance of 1.4 in this analysis and 1.7 in Wolf et al.. Furthermore, both works find no strong evidence for a trend of HR with sSFR ( in this work and 0.42 in Wolf et al.). The agreement between Wolf et al. and this work are encouraging, as it suggests that despite different techniques for measuring host-galaxy stellar parameters and masses, the derived correlations between SN and host properties are robust.
5 Subsample analyses
5.1 SNe Ia at low redshift
| (mag) | sig | % | |||
|---|---|---|---|---|---|
| Met | HR corr | mag/dex | 1.7 | 90.81% | |
| HR uncorr | mag/dex | 1.7 | 90.79% | ||
| mag/dex | 1.8 | 91.19% | |||
| colour | mag/dex | 1.4 | 83.01% | ||
| Mass | HR corr | 100% | |||
| HR uncorr | 100% | ||||
| 100% | |||||
| colour | 91.20% | ||||
| SFR | HR corr | mag/ | 84.74% | ||
| HR uncorr | mag/ | 82.63% | |||
| mag/ | 99.66% | ||||
| colour | mag/ | 75.43% | |||
| sSFR | HR corr | mag/ | 68.08% | ||
| HR uncorr | mag/ | 65.36% | |||
| mag/ | 100% | ||||
| colour | mag/ | 99.44% | |||
| Age | HR corr | mag/(Gyr) | 99.43% | ||
| HR uncorr | mag/(Gyr) | 99.12% | |||
| mag/(Gyr) | 100% | ||||
| colour | mag/(Gyr) | 65.75% |
We also tested for correlations between SNe Ia and host-galaxy properties after restricting our sample to , to ensure that the observed correlations between host galaxy and the SNe Ia parameters are not driven by the Malmquist bias in our sample, and to search for any evolution of parameters with redshift which may affect cosmological analyses. The low redshift () sample consists of 288 SNe Ia, all of which have measured masses and ages, 271 with measured host-galaxy SFR and sSFR (the other 17 having limits from the non-detection of H), and 172 with measured metallicity (the other 116 having limits from the continuum flux of the spectral lines). We tested for correlations using the same procedure as in Section 4, and the resulting plot of host galaxy and SNe Ia properties is shown in Fig. 8 and the fitted parameters in Table 3.
From a comparison of Figs. 3 and 8, it is clear that most of the correlations remain consistent between the full sample and the subset of low-redshift SNe Ia. The mass correlations are consistent with the full sample, although we see that the slope of the correlations tend to be steeper at low redshift. Interestingly, the correlations between SNe Ia and host SFR is significantly less significant at lower redshifts (going from a result in the full sample to only 2.9). This could be the result of sampling a smaller range of host galaxies in the smaller volume at lower redshift. The redshift range of the sample was shown clearly to have a large effect in Sullivan et al. [2010], where they compared a low-redshift subsample to their full volume, and found that the low-redshift sample contained few low SFR galaxies (these galaxies also had low mass and metallicity). The slope of the log age versus correlation seems to be somewhat sleeper in the low redshift sample. This is consistent with previous studies [Johansson et al., 2013], as there is a population of old galaxies with broad SNe Ia (high ) at higher redshift, which are absent in the low redshift sample.
5.2 Host spectra taken at the location of the SN Ia

For a small number of the SNe Ia the BOSS spectra was taken at the position of the SNe Ia rather than the core of the galaxy. This was mainly done for SNe Ia where a host spectrum was already available in SDSS-II. From the sample of SNe Ia with spectra at the SN position, we have 19 with measured host-galaxy properties, 13 of which are classed as star forming or composite, and 8 of which have AoN for the lines used to measure metallicity. As these locations are in general well removed from the centre of the galaxy, we might expect to see different local properties than in the core of the host. For this sample we repeated the analysis for the full sample. It is hard to draw conclusions from such small sample, and the most significant correlation (between and host metallicity) was only at the level.
In Fig. 9 we compare the host-galaxy metallicities measured from spectra taken at the location of the SN to the metallicity derived from the SDSS spectra taken of the centre of the host. There is a systematic offset between the metallicity at the centre of the galaxy and at the SNe Ia position, although the direction of the offset is opposite to that which we would expect given the typical metallicity gradient in galaxies. However, with a small sample and large error bars on metallicity measurements, along with the relatively large size of the SDSS and BOSS fibres, we caution that this offset is quite likely spurious.
5.3 Separating the mass and metallicity correlations
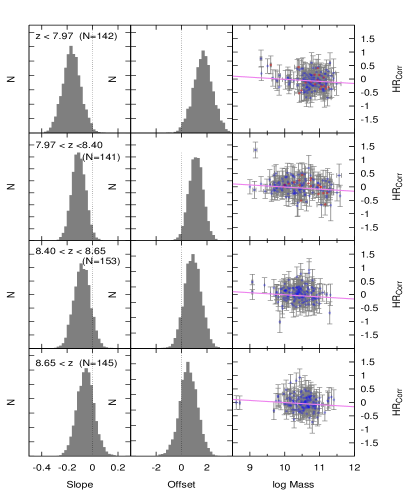
The correlation between HR and host-galaxy metallicity and mass has been previously noted by many authors [Sullivan et al., 2010, Childress et al., 2013a, Johansson et al., 2013, Pan et al., 2014]. But what remains unclear is to what extent these correlations are related, as more massive galaxies are also more metal rich. To test this, we have divided our sample of SNe Ia into bins corresponding to host-galaxy masses in a 0.3 dex range. We then looked for correlations between the SNe Ia parameters and the host-galaxy metallicity within each mass bin, as was done for the larger sample. The results of this fitting within each bin are shown in Fig. 10. We also repeated this process, but binning the sample in metallicity, while searching for a correlation between HR and host-galaxy mass. As there is some scatter in the mass – metallicity relation for galaxies, a sample of galaxies with the same mass will have a range of metallicities. By dividing the sample into bins of a given mass, or metallicity, we can control for the other variable and hence determine which is driving the correlation. If metallicity is the determining factor, then galaxies with similar mass, but different metallicities should show a correlation between metallicity and HR, while galaxies with a similar metallicity but different masses should not.
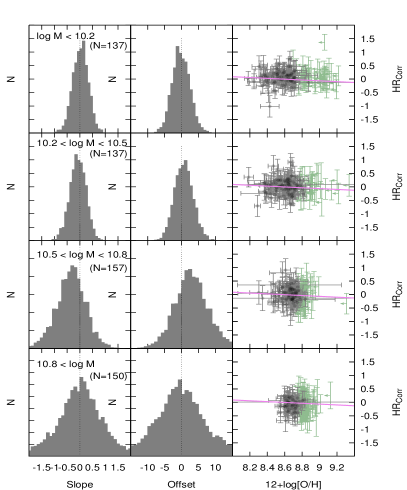
As can be seen in Fig. 10, the results of this test are somewhat ambiguous. For the two lowest galaxy mass bins, the peak of the posterior distribution corresponds to a slope of 0.0 (i.e. no correlation was found between metallicity and HR). While the mass bin has a best-fitting correlation slope of , there is a broad posterior distribution which is also consistent with zero slope. All the offsets are consistent with zero. The highest mass bin has an even broader posterior distribution, which is peaked at zero. We note that as each of the mass bins only covers a relatively narrow range of metallicities, it is more difficult to measure the slopes of the host metallicity–HR relation than in the full sample.
However, when the sample was binned in metallicity, the posterior distribution of slopes for the HR with host mass correlation peaks at a negative slope for all of the bins, with the more metal poor hosts displaying a steeper slope, which seems to show the opposite to the trend we expect. The lowest metallicity hosts with have a best-fitting slope of mag/dex, whereas the highest metallicity hosts with have a best-fitting slope of only mag/dex. As the mass correlation is much stronger than the metallicity correlation in our full sample is it not surprising that the mass correlation still dominates in our binned distributions. It is unclear, however, why the slope of the host-mass relation is steeper in lower metallicity hosts.
The slope posterior distribution has a much more negative value in the lower metallicity bins. One possibility is that this may be due to the presents of passive galaxies in these lower metallicity bins driving the correlation, and there being no passive galaxies in the higher metallicity bins. To investigate this we look at the HR, stretch and colour for the passive and star forming galaxies separately, shown in Fig. 11. This clearly shows that the passive galaxies have a much stronger dependence between the HR (and stretch) of the SNe Ia and the host-galaxy mass than the star forming galaxies. The slopes are different at approximately the 1 level, as shown in the Table 4. Using one universal correlation for all types of galaxies may end up under-correcting the SNe Ia in passive galaxies. In Section 6 we investigate the effect that using separate correlations for SNe in star-forming or passive host galaxies has on the derived cosmological parameters.
| (mag/dex) | (mag) | sig | % | ||
|---|---|---|---|---|---|
| SF mass | HR corr | 100% | |||
| HR uncorr | 100% | ||||
| 100% | |||||
| colour | 2.2 | 96.77% | |||
| Passive mass | HR corr | 1.717 | 2.3 | 97.43% | |
| HR uncorr | 1.687 | 2.4 | 98.00% | ||
| 5.399 | 2.9 | 99.61% | |||
| colour | 0.453 | 1 | 68.48% |
6 Cosmological analysis
Previous studies such as Sullivan et al. [2010] have shown that including a correction for the host-galaxy mass when carrying out cosmological analyses improves the quality of fit for the SNe Ia data. The currently accepted paradigm in cosmology is the Cold Dark Matter (CDM) model. This model uses a cosmological constant, , to parametrize the accelerating expansion of the Universe by dark energy, and is the simplest model we have to explain current observations. While the fiducial CDM cosmological model has the dark energy equation of state parameter , if we allow this to be a free parameter we can test how close our Universe is to the CDM cosmology.
We use the CosmoMC [Lewis & Bridle, 2002] code for our cosmological fits. We have used a flat CDM cosmological model for fitting our data on its own, but allow () to have values other than zero when fitting our data in combination with other cosmological information. The CosmoMC package uses an MCMC technique to efficiently probe multi-dimensional parameter space, allowing one to quickly investigate a large number of different regions in the parameter space. We allow simultaneous fitting of both the cosmological parameters and the SALT2 SNe Ia parameters and , which allow for the standardization of SNe Ia. We also include in the distance modulus calculation the redshift-dependent Malmquist bias correction from Campbell et al. [2013] and the full SALT2 light-curve parameter covariance matrix.
We ran the cosmological analysis on the sample of 581 SNe Ia which have host-galaxy masses. We first carried out the fit on this sample as is, then again including a correction for the best-fitting linear correlation between host-galaxy mass and Malmquist bias-corrected HR (HR corr) as listed in Table 2. We also tested the effects of allowing for a linear correlation between HR and host mass within the cosmological fit, but allowing the slope and intercept parameters to vary freely, similarly to how the and parameters of the distance modulus equation are treated. We see that the offset is not constrained in the cosmological analysis and is not correlated with any of the cosmological parameters, suggesting that having this extra degree of freedom is not required by the current data (see Appendix B for more details). We hence rerun our cosmological analysis allowing only one free parameter to account for the host-galaxy mass. Additionally, we tested fitting this sample including a step-function in the relation between host-galaxy mass and Malmquist bias corrected HR (HR corr). We tested both the effects of a step functions fixed at and with the best-fitting value of .
We investigated using the sample of SNe Ia on their own, and with a prior on from the SH0ES analysis [Riess et al., 2011]. The SH0ES measurement is partially determined using nearby SNe Ia measurements, and thus to be fully consistent we would have to consider the covariance between this value of and our SNe Ia measurements. However, as we are assuming no prior information on in our treatment of intrinsic SNe Ia parameters, these measurements can be considered independent. Using the SNe Ia data with the SH0ES prior we fit for a flat, CDM cosmological model using CosmoMC and the prior Set I in Table 5. All other cosmological parameters are left at their default values at this stage.
Finally, we repeated the analysis combining our data with the power spectrum of Luminous Red Galaxies (LRGs) in the SDSS DR7 [Reid et al., 2010], and the full WMAP7 CMB power spectrum [Larson et al., 2011]. We use WMAP data rather than the more recent Planck results [Planck Collaboration XIII, 2015] to facilitate direct comparison with previous studies. We fit this combination of data for a non-flat CDM cosmology, using the priors listed as Set II in Table 5. With the addition of these external data sets, we can now relax our priors on the re-ionization optical depth (=[0.00, 0.50]), the primordial super-horizon power in the curvature perturbation on 0.05 Mpc-1 scales (=[0,30]), and the scalar spectral index (=[0,1.5]), which had previously all been set to zero.
| Parameter | Set I | Set II |
|---|---|---|
| [-3,3] | [-3,3] | |
| 0 | [-1.5,1.5] | |
| [0.0, 1.2] | [0.0, 1.2] | |
| 0.0458 | [0.015, 0.200] | |
| [50,100] | [50,100] |
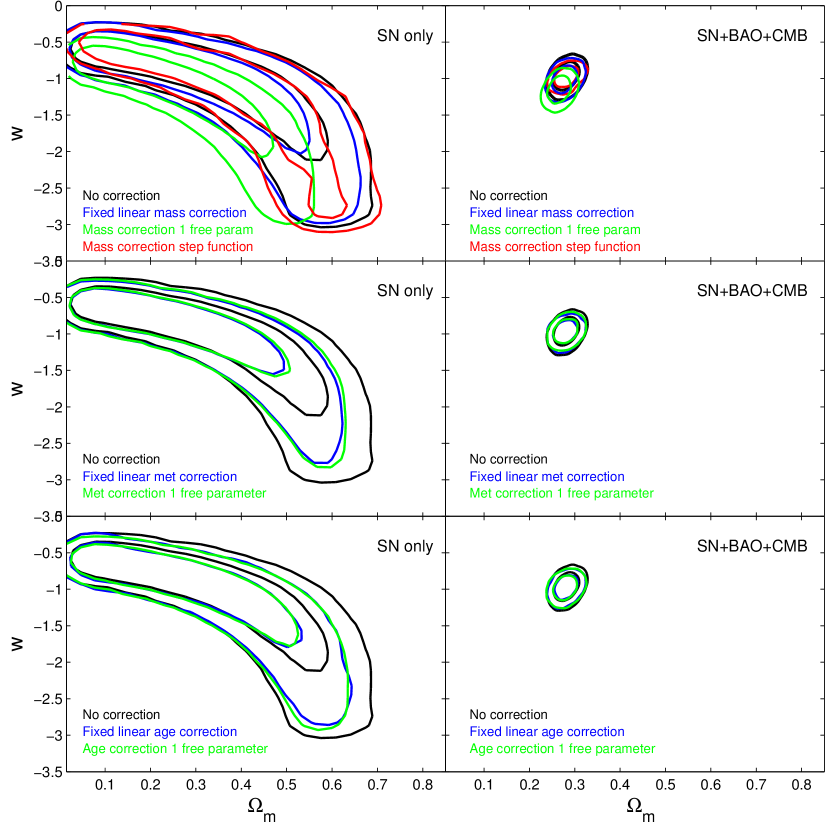
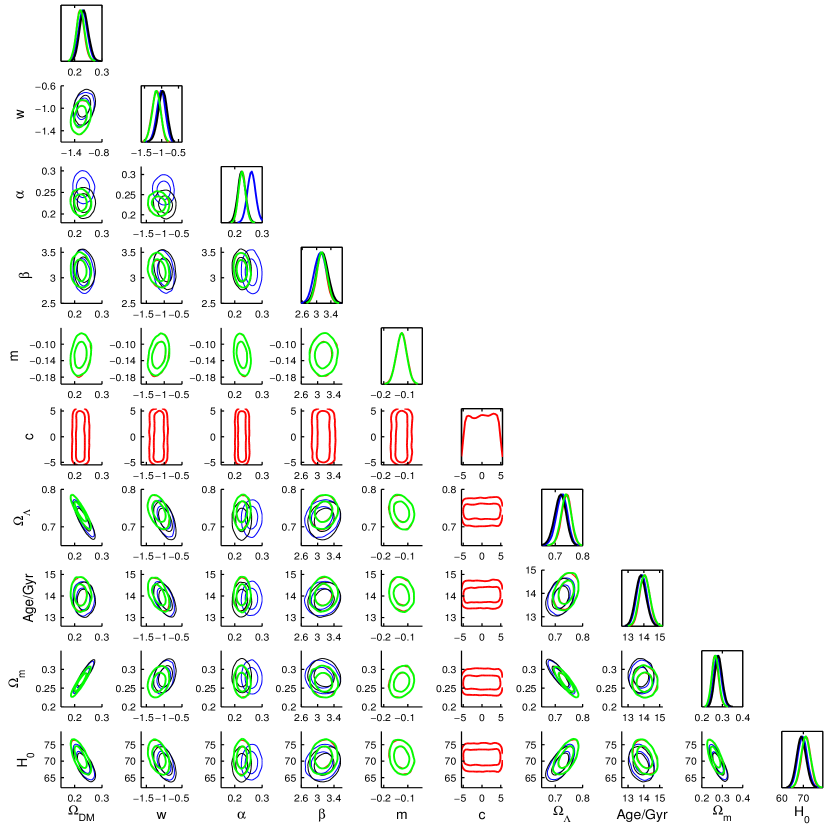
The top-left panel of Fig. 12 shows the contours for plotted against the dark energy equation of state parameter, , for the sample of 581 SNe Ia with measured host-galaxy stellar mass, using only SNe Ia data plus the prior on . The cosmological contours for all the potential correlations between parameters in the CosmoMC fit can be found in the Appendix. The best-fitting cosmological parameters are listed in Table 6. When only using SNe Ia data and the prior, applying a linear correction for the host-galaxy mass (either with the best-fitting values quoted in Table 2 or with the coefficient left as a free parameter in the fit), the size of the cosmological contours are reduced, as shown in the top-left hand panel of Fig. 12. When the parameters of the correction for the host-galaxy stellar mass are fixed in the cosmological analysis it biases the and parameters, more details can be found in the Appendix. The contours also shift to more negative and lower values of , especially when the parameters are left free. This suggests that without a host-galaxy correction for mass the cosmological contours are biased. The linear correlation of HR with host-galaxy mass is found to have a slope of within the CosmoMC fit with one free parameter. This slope is slightly steeper than that found when fitting the HR and mass after a cosmological solution had already been found (i.e. Section 4.2; ), but is consistent with the slope from the low redshift sample in Section 5.1 (). When only using SNe Ia data and the prior, applying a step-function correction for the host-galaxy mass, there is very little difference in the size or position of the cosmological contours. This is somewhat surprising as previous studies suggested that the step-function represented the data well. Betoule et al. [2014] using the SDSS+SNLS data found a 5 step function correction, with an offset of mag between the high and low-mass host galaxies (with a split at ). The much lower significance of the step function we find is likely due to the small numbers of SNe Ia in hosts with masses below in our data, compared to the sample of Betoule et al. [2014] which contained many more SNe Ia in low-mass hosts.
The cosmological contours for versus , after combining the SNe Ia data with the power spectrum of LRGs in SDSS DR7 [Reid et al., 2010] and the full WMAP7 CMB power spectrum [Larson et al., 2011] are shown in the top right-hand side of Fig. 12, with the best-fitting values quoted in Table 6. Again, the cosmological contours shift to slightly lower values of and smaller values for when the host-galaxy mass correlation is included. The change in the best-fitting value of is 0.18, which is a difference. In fact, with one or two parameters free in the CosmoMC the best-fitting cosmology excludes at the 1 level. However, since this analysis is purely statistical, with no systematic errors taken into account this is not a significant result.
We repeated the cosmological analysis, but correcting the SNe Ia distance moduli by the metallicity or the age of the host rather than the mass. In this case, we used the same size SNe Ia sample (581) but with 259 (45 per cent) of them having limits rather than measured host-galaxy metallicities (all 581 host galaxies have measured ages). Again, we begin by including two free parameters for the correlation with host-galaxy metallicity or age, the slope () and offset (). Similar to the host-galaxy stellar mass correlation, we see that the offset is not constrained at all, indicating that the data do not require a parameter for the offset as well as slope in the host-galaxy metallicity or age correlation. We thus performed the cosmological analysis with only one free parameter for the slope of the metallicity or age correlation.
The cosmological contours for all the potential correlations between parameters in the CosmoMC fit, for the sample of 581 SNe Ia with measured host-galaxy metallicity, using only SNe Ia data plus the prior on and combing with other cosmological probes are shown in the Appendix. The versus cosmological contours from the metallicity correlation analysis are shown in middle row and the age correlation analysis are shown in the bottom row of Fig. 12 . The best-fitting cosmological parameters are given in Table 6. Again the left-hand panels show the fit for the sample using only SNe Ia data with the SH0ES prior [Riess et al., 2011] and a flat CDM cosmological model. The right-hand panels show the effect of also including the LRGs [Reid et al., 2010], and the full WMAP7 CMB power spectrum [Larson et al., 2011]. This clearly shows that including a correction for the host-galaxy metallicity or age reduces the size of the error contours when only SNe Ia data and a prior on are used; but when other cosmological probes are included in the analysis the effect of the host-galaxy metallicity or age correlation is negligible.
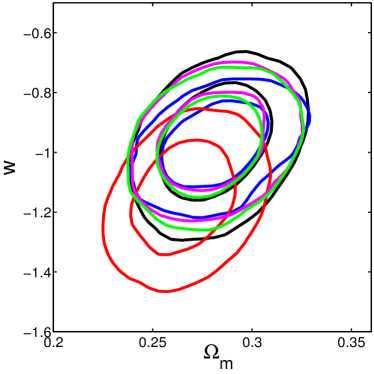
Fig. 13 shows the versus cosmological contours for all the host-galaxy correction we have investigated in the cosmological analysis, with SH0ES prior [Riess et al., 2011], LRGs [Reid et al., 2010], and the full WMAP7 CMB power spectrum [Larson et al., 2011] . This clearly shows that all the different fits agree within 1 error contours. The linear correction for the host-galaxy stellar mass, when allowed to vary in the cosmological analysis has the largest effect on the cosmological parameters, shifting to lower values of and more negative values of .
We also investigate using separate correlations for SNe host-galaxy mass for star-forming or passive galaxies in the cosmological analysis. We find that when using the fixed correlations from Section 5.3 the derived cosmological parameters are consistent with the results when using a single correction for the host-galaxy mass. Additionally, we tested allowing the slope to vary in the cosmological fit for the passive and star-forming galaxies separately. However, both populations converge to the same value for the slope, and this is consistent with that found when the combined sample was fitted. Thus, we conclude that our current data do not require passive and star-forming galaxies to be separated, but caution that this may become important for the next generation of SN surveys.
| Correction | Data | Fit parameters | Results | ||||||||
| SNe | CMB | LRGs | Fig. 12 | ||||||||
| None | ✓ | ✓ | 0 | 0 | 0.363 | 0.637 | 0 | -1.190 | Left all | ||
| Mass fix | ✓ | ✓ | -0.0780.021 | 0.7720.211 | 0.330 | 0.669 | 0 | -1.154 | Left top | ||
| Mass free 1 params | ✓ | ✓ | -0.1230.021 | 0 | 0.287 | 0.713 | 0 | -1.316 | Left top | ||
| Mass step | ✓ | ✓ | log M = 10 | = 0.091 | 0.394 | 0.606 | 0 | -1.32 | Left top | ||
| Mass step free | ✓ | ✓ | log M = 9.59 | = 0.262 | 0.389 | 0.611 | 0 | -1.321 | Left top | ||
| Met fix | ✓ | ✓ | -0.1540.168 | 1.3201.444 | 0.293 | 0.707 | 0 | -1.027 | Left middle | ||
| Met free 1 params | ✓ | ✓ | -0.1280.056 | 0 | 0.297 | 0.703 | 0 | -1.030 | Left middle | ||
| Age fix | ✓ | ✓ | -0.0130.011 | 0.0190.022 | 0.312 | 0.688 | 0 | -1.089 | Left bottom | ||
| Age free 1 params | ✓ | ✓ | -0.0250.006 | 0 | 0.316 | 0.684 | 0 | -1.106 | Left bottom | ||
| None | ✓ | ✓ | ✓ | ✓ | 0 | 0 | 0.282 | 0.718 | -0.0 | -0.970 | Right top |
| Mass fix | ✓ | ✓ | ✓ | ✓ | -0.0780.021 | 0.7720.211 | 0.278 | 0.724 | -0.001 | -1.01 | Right top |
| Mass free 1 params | ✓ | ✓ | ✓ | ✓ | -0.1260.020 | 0 | 0.266 | 0.740 | -0.006 | -1.151 | Right top |
| Mass step | ✓ | ✓ | ✓ | ✓ | log (M/) = 10 | = 0.091 | 0.282 | 0.718 | -0.001 | -0.975 | Right top |
| Mass step free | ✓ | ✓ | ✓ | ✓ | log (M) = 9.59 | = 0.262 | 0.279 | 0.722 | -0.001 | -0.986 | Right: top |
| Met fix | ✓ | ✓ | ✓ | ✓ | -0.1540.168 | 1.3201.444 | 0.280 | 0.729 | -0.001 | -0.981 | Right middle |
| Met free 1 params | ✓ | ✓ | ✓ | ✓ | -0.1350.056 | 0 | 0.281 | 0.719 | 0.000 | -0.964 | Right middle |
| Age fix | ✓ | ✓ | ✓ | ✓ | -0.0130.011 | 0.0190.022 | 0.281 | 0.719 | 0.001 | -0.975 | Right bottom |
| Age free 1 params | ✓ | ✓ | ✓ | ✓ | -0.0240.006 | 0 | 0.280 | 0.721 | -0.001 | -0.979 | Right bottom |
7 Conclusions
In this paper, we have investigated correlations between SNe Ia light curves and their host galaxies and look at the effect on the cosmological constraints. For this we have used the sample of 581 photometrically-classified SNe Ia from Campbell et al. [2013]. This sample was assembled from three years of photometry from the SDSS-II SN Survey, together with BOSS spectroscopy of the host galaxies of transients. We use the stellar population parameters derived from the BOSS DR10 results [Ahn et al., 2012] and calculate the metallicities from the measured line fluxes. The stellar masses are derived using SED fitting with the Maraston et al. [2013] models. Compared to previous studies, our sample is larger by a factor of . We also cover a wider range of redshifts (up to ), which is directly applicable to cosmological measurements.
Our main results are as following.
-
•
We measure a significant correlation () between the host-galaxy stellar-mass and the SNe Ia HR, consistent with previous studies. The correlation between host-galaxy stellar mass and the SNe Ia HR is likely to be due to an underlying physical property, which the mass (which is easier to measure) is simply acting as a proxy for. We find that whether the host mass is fit with a linear fit or a step function will alter the derived cosmological parameters.
-
•
We find a weak correlation () between the host-galaxy metallicity and the SNe Ia HR. Comparing the slope of this correlation to previous studies, we find that it is consistent, and that all studies show the same direction of trend.
-
•
We consider a small sample of host-galaxy spectra taken at the position of the SN, but unfortunately the sample size is too small to draw meaningful conclusions.
-
•
We find that the slope of the correlation between HR and host-galaxy mass is steeper for low-metallicity galaxies.
-
•
We test the effects of either applying a fixed linear correction (based on either host-galaxy stellar mass, metallicity or age) to the distance modulus, or allowing an additional free parameter to account for this within a cosmological fit. We see a shift towards a more negative equation-of-state parameter and a shift to lower values of when including a correction for the host-galaxy stellar mass, especially when the relation coefficients are fit simultaneous with the cosmological parameters. The shift with host-galaxy stellar-mass correction is consistent with previous studies [Sullivan et al., 2006], and we also see a small reduction in the size of the cosmological contours. When a fixed correction for the host-galaxy stellar mass is applied it biases the and parameters.
-
•
We find that the host-galaxy stellar mass has a much more significant effect on the cosmological parameters than the host-galaxy metallicity or age.
As current and next generation surveys move towards a goal of 1 per cent cosmology, small systematic effects such as the host-galaxy mass and metallicity correlations considered here become ever more important. While it is possible to measure these systematic effects and correct for them, to properly account for the covariances and degeneracies between SNe Ia and host-galaxy parameters it is better to fit and solve for these effects simultaneously with cosmological parameters.
We also suggest that a future avenue for this work could be the inclusion of host morphologies from Galaxy Zoo. 17 of our host galaxies were included in the GZ1 or GZ2 catalogues from Galaxy Zoo [Lintott et al., 2008, Willett et al., 2013]222Publicly available at http://data.galaxyzoo.org/. This sample is only a small subset of our full sample as most of our hosts are unresolved with mag. However, this would be extremely interesting to investigate in the future with a lower redshift sample.
8 Acknowledgements
We are indebted to the anonymous referee, who made many constructive and helpful suggestions which have improved this work. We thank Bethan James, Bob Nichol, Rubina Kotak, Max Pettini, Mark Sullivan, Clare Worley, Sergey Koposov and Andy Casey for useful discussion and advice. We thank Rachel Wolf, Chris D’Andrea, Ravi Gupta, Masao Sako, Roberto Trotta and Hikmatali Shariff for helpful and constructive discussions and comments on this work.
This work was partly supported by the European Union FP7 programme through ERC grant number 320360.
Funding for SDSS-III has been provided by the Alfred P. Sloan Foundation, the Participating Institutions, the National Science Foundation, and the U.S. Department of Energy Office of Science. The SDSS-III web site is http://www.sdss3.org/.
SDSS-III is managed by the Astrophysical Research Consortium for the Participating Institutions of the SDSS-III Collaboration including the University of Arizona, the Brazilian Participation Group, Brookhaven National Laboratory, Carnegie Mellon University, University of Florida, the French Participation Group, the German Participation Group, Harvard University, the Instituto de Astrofisica de Canarias, the Michigan State/Notre Dame/JINA Participation Group, Johns Hopkins University, Lawrence Berkeley National Laboratory, Max Planck Institute for Astrophysics, Max Planck Institute for Extraterrestrial Physics, New Mexico State University, New York University, Ohio State University, Pennsylvania State University, University of Portsmouth, Princeton University, the Spanish Participation Group, University of Tokyo, University of Utah, Vanderbilt University, University of Virginia, University of Washington, and Yale University.
Appendix A Host galaxy correlations without upper limits
Our sample of SN host galaxies has 332 with measured metallicities and 259 with upper limits. Kelly [2007] investigated using upper limits or ‘censored’ data in the dependent variable but suggested it was easiest to remove and refit the data when the limits were in the independent variable. We follow this procedure and remove the upper limits for our metallicity (or SFR) sample and refit the correlations. The results from these fits can be see in Table 7 and are shown as the cyan dashed line on Fig. 3. These are all consistent with the analysis carried out including the upper limits. However, some of the correlations slightly change their significance. Most notably the colour versus sSFR correlations becomes more significant (1.45 to 4) when the upper limits are excluded.
| sig | % | ||||
|---|---|---|---|---|---|
| Metallicity | HR corr | mag/dex | 1.7821.573 mag | 1.5 | 87.18% |
| - | HR uncorr | mag/dex | 1.7821.573 mag | 1.5 | 87.18% |
| - | mag/dex | 7.2964.636 mag | 1.8 | 93.81% | |
| - | colour | mag/dex | -0.2140.474 mag | 0.9 | 66.67% |
| SFR | HR corr | mag/ | -0.0140.018 mag | 81.43% | |
| - | HR uncorr | mag/ | -0.0450.018 mag | 79.52% | |
| - | mag/ | -0.2140.0554 mag | 100% | ||
| - | colour | mag/ | -0.0240.006 mag | 95.51% | |
| sSFR | HR corr | mag/ | 0.8523.917 mag | 58.82% | |
| - | HR uncorr | mag/ | 0.6303.479 mag | 56.66% | |
| - | mag/ | 29.7944.578 mag | 100% | ||
| - | colour | mag/ | 6.9412.241 mag | 99.995% |
Appendix B Cosmological parameter correlations
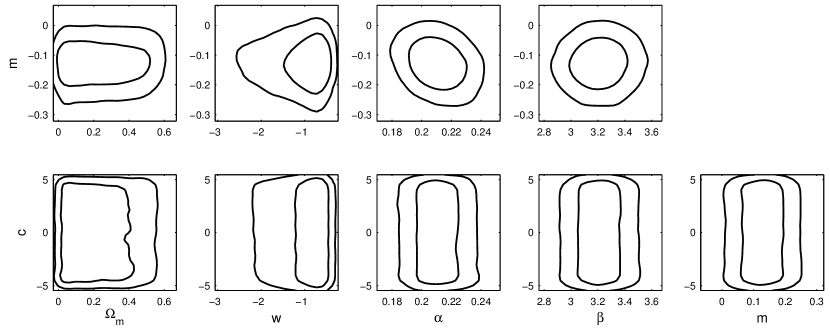
In Section 6, we investigate using the correlations with host-galaxy stellar mass as an additional parameter in the cosmological analysis.
Fig. 14 shows the correlations between the slope () and intercept () of the correction for the host-galaxy mass correlation with the cosmological parameters when the slope and offset are allowed to vary in the CosmoMC fit, for the sample of 581 SNe Ia with measured host-galaxy stellar mass, using only SNe Ia data plus the prior on . We see that the offset is not constrained, suggesting that having this extra degree of freedom is not required by the current data. We hence rerun our cosmological analysis allowing only one free parameter to account for the host-galaxy mass.
Fig. 15 shows all the potential correlations between recovered parameters in the CosmoMC fit, for the sample of 581 SNe Ia with measured host-galaxy stellar mass, using data from SNe Ia + + BAO + CMB. It is evident that when a fixed correction for the mass correlation is used, the best-fitting (and to a lesser extent, ) recovered from the cosmological analysis is shifted to higher values. The plot of versus suggests that these two parameters are degenerate. This might be expected as SNe Ia in more massive galaxies tend to be broader (and hence have higher ). This suggests that deriving a correlation for the host-galaxy mass with all the cosmological parameters fixed, and then applying this may create a bias in the analysis, which is somewhat compensated for by the change in . As an alternative, we suggest that it is safer to allow the correction for the host-galaxy mass to be an additional free parameter which is solved for simultaneously in the cosmological fit, rather than measuring it independently and attempting to ‘correct’ the data. In Fig. 15 the fits with both the slope and intercept of the mass correlation as free parameters, and those where only the slope was allowed to vary, are almost indistinguishable. This strengthens our conclusion that the additional parameter for the intercept is not required. The fits with the correction for the mass as a free parameter are also found to shrink the 1 and 2 error contours for many of the derived cosmological parameters and in some cases changes the best-fitting value.
The cosmological analysis was repeated using a correction for host-galaxy metallicity. Fig. 16 shows all the possible correlations between the CosmoMC fitted parameters, including CMB and BAO constraints as well as SNe Ia and a prior on . Here, we see the same small change in when the free parameter for metallicity is included in the fit, however, the change in is now less marked than when using the mass correction. The size of the error contours and their location is similar for all the other cosmological fits. Adding a correction for metallicity either as a fixed value or as free parameter does not seem to improve the cosmological analysis when combined with other cosmological probes.
Appendix C SNe Ia and host-galaxy data
In Table 8 we present the key information used in this paper for our sample of 581 photometrically–classified SNe Ia [Campbell et al., 2013] with host galaxy information, the table can be electronically downloaded from http://www.mnras.oxfordjournals.org/lookup/suppl/doi:10.1093/mnras/stw115/-/DC1. Table 8 lists the columns within this table.
| Field | Property |
|---|---|
| 1 | SN ID |
| 2 | Host-galaxy redshift |
| 3 | Host-galaxy redshift error |
| 4 | SN RA [Deg J2000] |
| 5 | SN Dec [Deg J2000] |
| 6 | SN SALT2 X0 [mag] |
| 7 | SN SALT2 X0 error [mag] |
| 8 | SN SALT2 X1 [mag] |
| 9 | SN SALT2 X1 error [mag] |
| 10 | SN SALT2 colour [mag] |
| 11 | SN SALT2 colour error [mag] |
| 12 | SN SALT2 X0 X0 covariance |
| 13 | SN SALT2 X0 X1 covariance |
| 14 | SN SALT2 X0 colour covariance |
| 15 | SN SALT2 X1 X1 covariance |
| 16 | SN SALT2 X1 colour covariance |
| 17 | SN SALT2 color colour covariance |
| 18 | SN uncorrected [mag] |
| 19 | SN corrected [mag] |
| 20 | SN error [mag] |
| 21 | SN best-fitting cosmology estimated [mag] |
| 22 | SN best-fitting cosmology estimated error [mag] |
| 23 | SN HR from uncorrected [mag] |
| 24 | SN HR from corrected [mag] |
| 25 | HR error [mag] |
| 26 | Host-galaxy ObjID (DR8) |
| 27 | Host-galaxy type |
| 28 | Host-galaxy metallicity [mag/dex] |
| 29 | Host-galaxy metallicity error [mag/dex] |
| 30 | Host-galaxy metallicity type (measured or upper limit) |
| 31 | Host-galaxy mass [] |
| 32 | Host-galaxy mass error [] |
| 33 | Host-galaxy SFR [mag/] |
| 34 | Host-galaxy SFR error [mag/] |
| 35 | Host-galaxy SFR type (measured or upper limit) |
| 36 | Host-galaxy sSFR [mag/] |
| 37 | Host-galaxy sSFR error [mag/] |
| 38 | Host-galaxy age [mag/(Gyr)] |
| 39 | Host-alaxy age error [mag/(Gyr)] |
References
- Ahn et al. [2012] Ahn C.P. et al., 2012, ApJS, 203, 21
- Baldwin et al. [1981] Baldwin J.A., Phillips M.M., Terlevich R.,1981, PASP, 93, 5
- Betoule et al. [2014] Betoule M. et al., 2014, A&A, 568, A22
- Brinchmann et al. [2004] Brinchmann J., Charlot S., White S.D.M., Tremonti C., Kaumann G., Heckman T., Brinkmann J., 2004, MNRAS, 351, 1151
- Bolzonella et al. [2000] Bolzonella M., Miralles J.-M., Pelló R., 2000, A&A, 363, 476
- Calzetti [2001] Calzetti D., 2001, PASP, 113, 1449
- Carter et al. [2001] Carter B.J., Fabricant D.G., Geller M.J., Kurtz M.J., McLean B,. 2001, ApJ, 559, 606
- Campbell et al. [2013] Campbell H. et al., 2013, ApJ, 763, 88
- Childress et al. [2013a] Childress M. et al. 2013a, ApJ, 770, 107
- Childress et al. [2013b] Childress M. et al. 2013b, ApJ, 770, 108
- Conroy et al. [2009] Conroy C., Gunn J. E., White M., 2009, ApJ, 699, 486
- Conroy & Gunn [2010] Conroy C., Gunn J. E., 2010, ApJ, 712, 833
- D’Andrea et al. [2011] D’Andrea C.B. et al., 2011, ApJ, 743, 172
- Dawson et al. [2013] Dawson K.S. et al., 2013 AJ, 145, 10
- Dilday et al. [2008] Dilday B. et al., 2008, ApJ, 682, 262
- Dilday et al. [2010] Dilday B. et al., 2010, ApJ, 715, 1021
- Fioc & Rocca-Volmerange [1997] Fioc M., Rocca-Volmerange B., 1997 , A&A, 326, 950
- Fioc & Rocca-Volmerange [1999] Fioc M., Rocca-Volmerange B., 1999, (astro-ph/9912179)
- Foley & Kasen [2011] Foley R.J., Kasen D., 2011, ApJ, 729, 55
- Foley [2012] Foley R.J., 2012, ApJ, 748, 127
- Frieman et al. [2008] Frieman J.A. et al., 2008, AJ, 135, 338
- Galbany et al. [2012] Galbany L. et al., 2012 ApJ, 755, 125
- Gunn et al. [1998] Gunn J.E et al., 1998, AJ, 116, 3040
- Gupta et al. [2011] Gupta R.R. et al., 2011 ApJ, 740, 92
- Guy et al. [2007] Guy J. et al., 2007 A&A, 466,11
- Guy et al. [2010] Guy J. et al., 2010, A&A, 523, A7
- Hayden et al. [2010] Hayden B.T. et al., 2010 ApJ, 722, 1691
- Hayden et al. [2013] Hayden B.T., Gupta R.R., Garnavich P.M., Mannucci F., Nichol R.C, Sako M., 2013 ApJ, 764, 191
- Hicken et al. [2009] Hicken M., Wood-Vasey W. M., Blondin S., Challis P., Jha S., Kelly P. L., Rest A., Kirshner R., 2009, ApJ, 700, 1097
- Hillebrandt & Niemeyer [2000] Hillebrandt W., Niemeyer J.C., 2000, ARA&A, 38, 191
- Howell et al [2009] Howell D.A. et al., 2009 ApJ, 691, 661
- Johansson et al. [2013] Johansson J, et al., 2013 MNRAS, 435,1680
- Jones et al. [2015] Jones D.O., Riess A.G, Scolnic D.M., 2015, AAS Meeting, 227, 139.08
- Kelly [2007] Kelly B.C., 2007, ApJ, 665, 1489
- Kelly et al. [2010] Kelly P.L., Hicken M., Burke D.L., Mandel K.S., Kirshner R.P., 2010, ApJ, 715, 743
- Kelly et al. [2015] Kelly P.L., Filippenko A.V., Burke D. L., Hicken M., Ganeshalingam M., Zheng W., 2015, Science, 347, 1459
- Kennicutt [1998] Kennicutt R. C.,1998, ARA&A, 36, 189
- Kessler et al. [2009] Kessler R. et al., 2009, ApJS, 185, 32
- Kewley et al. [2001] Kewley L.J., Dopita M.A., Sutherland R.S., Heisler C.A., Trevena J., 2001, ApJ, 556, 121
- Kim et al. [2014] Kim A.G. et al., 2014, ApJ, 784, 51
- Konishi et al. [2011] Konishi K. et al., 2011, (arXiv:1101.1565)
- Kudritzki et al. [2014] Kudritzki R., Urbaneja M.A., Bresolin F., Hosek M.W., Przybilla N., 2014, ApJ, 788, 56
- Lampeitl et al. [2010a] Lampeitl H. et al., 2010a, MNRAS, 401, 2331
- Lampeitl et al. [2010b] Lampeitl H. et al., 2010b, ApJ, 722, 566
- Larson et al. [2011] Larson D. et al., 2011, ApJS, 192, 16
- Lewis & Bridle [2002] Lewis A., Bridle S., 2002, Phys.Rev.D, 66, 103511
- Li & White [2009] Li C., White S.D.M., 2009, MNRAS, 398, 2177
- Li et al. [2011] Li W. et al. 2011, MNRAS, 412, 1441
- Liang et al. [2007] Liang Y. C., Hammer F., Yin S. Y., Flores H., Rodrigues M., Yang Y. B. 2007, A&A, 473, 411
- Lintott et al. [2008] Lintott C.J. et al., 2008, MNRAS, 389, 1179
- Maguire et al. [2013] Maguire K., et al. 2013, MNRAS, 436, 222
- Maraston et al. [2006] Maraston C., Daddi E., Renzini A., Cimatti A., Dickinson M., Papovich C., Pasquali A., Pirzkal N., 2006, ApJ, 652, 85
- Maraston et al. [2013] Maraston C. et al., 2013, MNRAS, 435, 2764
- Miller et al. [2003] Miller C.J., Nichol R.C., Gomez P.L., Hopkins A.M., Bernardi M., 2003, ApJ, 597, 142
- Neill et al. [2009] Neill J.D. et al., 2009, ApJ, 707, 1449
- Nordin et al. [2011] Nordin J. et al., 2011, ApJ, 734, 42
- Ostman et al. [2011] Óestman L. et al., 2014, A&A, 526, A28
- Olmstead et al. [2014] Olmstead M.D. et al. 2014, AJ, 147, 75
- Pan et al. [2014] Pan Y.-C. et al., 2014, MNRAS, 438, 1391
- Perlmutter et al. [1999] Perlmutter S. et al., 1999, ApJ, 517, 565
- Pettini & Pagel [2004] Pettini M., Pagel B.E.J., 2004, MNRAS, 348, L59
- Phillips [1993] Phillips M.M., 1993, ApJL, 413, L105
- Pilyugin [2001] Pilyugin, L. S. 2001, A&A, 374, 412
- Pilyugin & Thuan [2005] Pilyugin L. S., Thuan T. X. 2005, ApJ, 631, 231
- Planck Collaboration XIII [2015] Planck Collaboration XIII 2015, (arXiv:1502.01589)
- Reid et al. [2010] Reid B.A. et al., 2010, MNRAS, 404, 60
- Riess, Press & Kirshner [1996] Riess A.G., Press W.H., Kirshner R.P., 1996, ApJ, 473, 88
- Riess et al. [1998] Riess A.G. et al., 1998, AJ, 116, 1009
- Riess et al. [2011] Riess A.G. et al., 2011, ApJ, 730, 119
- Rigault et al. [2013] Rigault M. et al., 2013, A&A, 560, 66
- Rigault et al. [2015] Rigault M. et al., 2015, ApJ, 802, 20
- Sako et al. [2008] Sako M. et al., 2008, AJ, 135, 348
- Sako et al. [2011] Sako M. et al., 2011, ApJ, 738, 162
- Sako et al. [2014] Sako M. et al., 2014, arXiv:1401.3317
- Sarzi et al. [2006] Sarzi M. et al., 2006, MNRAS, 366, 1151
- Schmidt et al. [1998] Schmidt B.P. et al., 1998, ApJ, 507, 46
- Smith et al. [2012] Smith M. et al., 2012, ApJ, 755, 61
- Sollerman et al. [2009] Sollerman J. et al., 2009, ApJ, 703, 1374
- Sullivan et al. [2006] Sullivan M. et al., 2006, AJ, 131, 960
- Sullivan et al. [2010] Sullivan M. et al., 2010, MNRAS, 406, 782
- Sullivan et al. [2011] Sullivan M. et al., 2011, ApJ, 737, 102
- Thomas et al. [2013] Thomas D. et al., 2013, MNRAS, 431, 1383
- Willett et al. [2013] Willett K.W. et al., 2013 MNRAS, 435, 2835
- Wolf et al. [2015] Wolf C. et. al., 2015, submitted
- Yin et al. [2007] Yin S. Y., Liang Y. C., Zhang B. 2007, ASP Conf, 373, 686
- Zheng et al. [2008] Zheng C. et al., 2008, AJ, 135, 1766