High-Resolution Imaging of Water Maser Emission in the active galaxies NGC 6240 and M51
Abstract
We present the results of observations of 22 GHz H2O maser emission in NGC 6240 and M51 made with the Karl G. Jansky Very Large Array. Two major H2O maser features and several minor features are detected toward the southern nucleus of NGC 6240. These features are redshifted by about 300 km sfrom the galaxy’s systemic velocity and remain unresolved at the synthesized beam size. A combination of our two-epoch observations and published data reveals an apparent correlation between the strength of the maser and the 22 GHz radio continuum emission, implying that the maser excitation relates to the activity of an active galactic nucleus in the southern nucleus rather than star-forming activity. The star-forming galaxy M51 hosts H2O maser emission in the center of the galaxy; however, the origin of the maser has been an open question. We report the first detection of 22 GHz nuclear radio continuum emission in M51. The continuum emission is co-located with the maser position, which indicates that the maser arises from active galactic nucleus-activity and not from star-forming activity in the galaxy.
1 Introduction
Observations of 22 GHz H2O masers have become established as a powerful tool for investigating the inner few parsecs of active galactic nuclei (AGNs), and have enabled precise distance measurements to local group galaxies and nearby AGNs (e.g., Herrnstein et al., 1999; Greenhill et al., 2009). Observations of extragalactic masers are of interest for determining the origin of the maser emission (e.g., whether it is driven by AGNs or starburst activity), and the suitability of the galaxy for direct distance measurement. Extragalactic H2O masers have also been detected in the sub-millimeter bands, with the 183 GHz, and possibly 439 GHz, transitions detected in NGC 3079 (Humphreys et al., 2005), and the 321 GHz transition detected in the Circinus galaxy (Hagiwara et al., 2013), providing additional information on the physical environments hosting these masers. In this paper we describe the results of observations with the Karl G. Jansky Very Large Array (VLA) of lower-luminosity 22 GHz H2O maser emission in the galaxies NGC 6240 (J1652+0024) and M51 (J1329+4713).
NGC 6240 (catalog ) is an interacting/merging galaxy hosting two nuclei that are separated by 1.5 (Beswick et al., 2001). At 22 GHz, an H2O maser with low isotropic luminosity (L 10 ☉) has been reported in this galaxy (Henkel et al., 1984; Hagiwara et al., 2002; Nakai et al., 2002). NGC 6240 has a large far-infrared luminosity LFIR = 1011-12 ☉, which cannot be accounted for by starburst activity alone, but which can be more naturally explained as a buried AGN heating surrounding dusty components (e.g., Depoy, Becklin, & Wynn-Williams, 1986; Sanders et al., 1988; Risaliti et al., 2006). Neutral Fe K lines at 6.4 keV due to reflection from optically thick material are detected from both nuclei, which is clear evidence for both being AGNs (Komossa et al., 2003). Very Long Baseline Interferometry (VLBI) observations (Gallimore & Beswick, 2004; Hagiwara et al., 2011) detected compact radio sources with brightness temperatures of 7106 K for the northern nucleus and 1.8107 K for the southern nucleus (e.g., Colbert et al., 1994), confirming the presence of AGNs at centimeter radio wavelengths. Using the VLA, we found that the maser emission was coincident with the southern nucleus to within the 0.1 resolution of the observation (Hagiwara et al., 2003). The origin of the maser has been an open question for some time (Hagiwara, 2010).
The star-forming galaxy M51 (catalog ) (NGC 5194 (catalog )) hosts a Seyfert/LINER nucleus (Heckman, 1980) and has H2O maser emission (Ho et al., 1987) that consists of Doppler-shifted features on either side of the galaxy’s systemic velocity (Hagiwara et al., 2001). The redshifted features are located toward the nuclear radio source, while the location of the blue-shifted counterpart is displaced from the radio source toward the southeast. A small velocity gradient closely aligned with the radio jet is detected from the redshifted features (Hagiwara, 2007). The redshifted maser most likely amplifies the background radio continuum jet, while the blue-shifted counterpart marks off-nuclear star formation in the galaxy.
The upgraded VLA capabilities, with bandwidths of 2 GHz and improved spectral resolution (Perley et al., 2011), have allowed us to address the nature of the low-luminosity H2O masers in NGC 6240 (catalog ) and M51 (catalog ) and to map the distribution of maser spots on the 0.1 arcsec scale.
We adopt cosmological parameters of H0 = 73 km sMpc-1, Λ = 0.73, and M = 0.27. The luminosity distance to NGC 6240 (catalog ) is therefore 103 Mpc (z=0.02448) and 10.6 Mpc (z=0.002) to M51 (catalog ). Thus, 1 arcsec corresponds to a linear scale of 475 pc for NGC6240 and 51 pc for M51. We adopt the optical velocity definition and velocities are calculated with respect to the local standard of rest (LSR).
2 OBSERVATIONS AND DATA REDUCTION
We observed NGC 6240 with the National Radio Astronomy Observatory (NRAO)111The NRAO is operated by Associated Universities, Inc., under a cooperative agreement with the National Science Foundation. VLA in the B configuration on 2012 July 21 (epoch 1) and 2012 August 28 (epoch 2) and observed M 51 in the A configuration on 2012 November 17. Observations were made of 22 GHz H2O maser emission in the 616523 transition, employing 16 intermediate frequencies (IFs) of 16 MHz bandwidth with dual polarization, resulting in a total bandwidth of 256 MHz for each polarization. The total velocity coverage is 3450 km s-1, however, the velocity coverages were not continuous in both observations: there is a 430 MHz frequency gap between IFs 1–8 and IFs 9–16, where IF4 is centered on the systemic velocity of each galaxy. The total observing time for NGC 6240 at each epoch was 2.5 hr and that of M51 was 3 hr. In the NGC 6240 observations, the phase-referencing observations were executed in a sequence of 3 minute scans with 2 minutes on NGC 6240 and 40 s on J1658+0741. For the M51 observation, the phase-referencing was performed in a sequence of 3.75 minute scans with 2 minutes on M51 and 40 s on J1419+5423. Flux density and bandpass calibration were performed using observations of 3C 286. Standard VLA data calibration and editing were made using the NRAO Astronomical Image Processing Software (AIPS). Uncertainties of flux density were estimated in the same method as explained in Hagiwara (2010).
After the phase and flux calibrations and data editing, the continuum emission was subtracted from the spectral-line visibilities using line-free channels prior to the imaging and CLEAN deconvolution of the maser emission. Imaging and CLEANing of the continuum were done separately.
The synthesized beam sizes produced from naturally weighted spectral-line images were 0.380.34 arcsec2 (PA=18) for NGC 6240 and 0.100.09 arcsec2 (PA=3) for M51. The spectral resolution was 125 kHz (1.7 km s-1) per spectral channel for all observations. The rms noise levels of the naturally weighted images at 125 kHz resolution were 1.52.0 mJy beam-1(epoch 1), 0.81.3 mJy beam-1(epoch 2) for NGC 6240 and 1.01.2 mJy beam-1 for M51. The rms noises of the continuum images were about 0.14 mJy beam-1 for NGC 6240, and 0.036 mJy beam-1 for M51, respectively.
3 RESULTS
3.1 NGC 6240
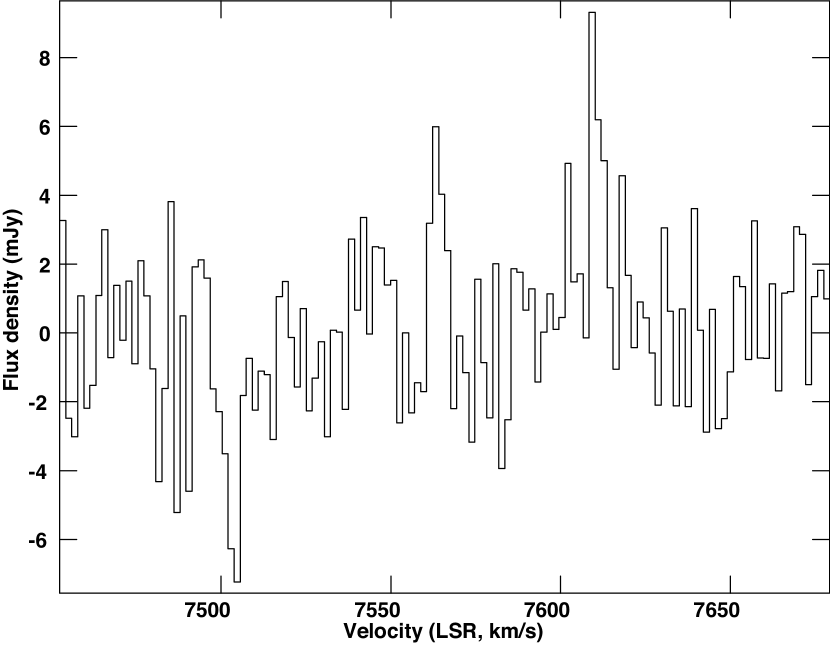
Figure 1 shows two-epoch spectra of the H2O maser emission from the southern nucleus in the velocity range spanning LSR=74507690 km s-1. The total velocity coverages in our observations are LSR 730990 km sand 6590 – 8320 km s-1. The maser line peaking at LSR=7609.3 km sis clearly detected at both epochs, though it is somewhat weaker at the second epoch. This location of this feature was determined with the VLA in 2012 to be coincident with the southern nucleus. A marginally significant feature at LSR=7563.2 km sin the first epoch matches features seen by single-dish measurements in 20002001, and 2005 (see Table 2), but there is no evidence of this feature in the second epoch.
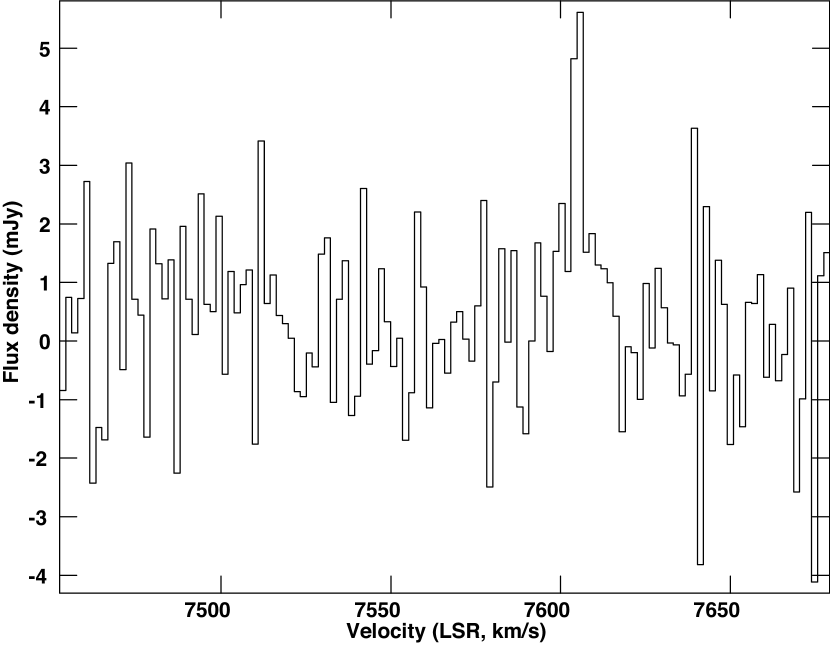
Figure 2 shows the spectra of tentative features peaking at LSR=7158km s, 7372 km s, and 7396 km sand in the southern nucleus. The maser emission also exhibits a broad profile that ranges from LSR 7360 to 7400 km s-1. These features are detected, tentatively, for the first time in the galaxy. No other H2O maser is detected at either epoch above the 3 level of 3 mJy beam-1 in the spectra from the northern nucleus, or at any other point within a field of view 7.7 7.7, centered on the southern nucleus.
Figure 3 shows the 22 GHz continuum image from epoch 1 data, obtained by integrating over the full frequency range after the removal of the maser line emission. The image shows two major radio sources, the southern and northern nucleus, both coinciding with the radio sources at lower frequencies with similar angular resolution (e.g., Carral et al., 1990; Colbert et al., 1994; Beswick et al., 2001). Extended components seen in lower frequency VLA images in the literature (e.g., Colbert et al., 1994; Baan, Hagiwara & Hofner, 2007) were resolved out in our continuum image. The flux densities of the 22 GHz continuum of the two nuclei and H2O maser are summarized in Table 1.
All of the masers detected in our observations remain unresolved at the angular resolution of 0.2, or 100 pc. The position of the 7609 km sfeature is (J2000): 16h52m58886, (J2000): +022403.260, from which all other features reside within 0.1, about a half of the synthesized beam size of our observation. Positional accuracy, without consideration of systematic errors, is /2S/N 0.02, where is the synthesized beam of our observations and S/N is the signal-to-noise ratio of the maser spectra. The position uncertainties considering the position error of the calibrator source (Reid and Honma, 2014) are estimated to be 0.s02 and 0.036.
The positions of these masers coincide with that of the southern nucleus, which is consistent with results of the previous VLA observations (Hagiwara, 2010). The estimation of the relative positional error between the maser and the southern continuum peak (3 pc or less) is considered in Hagiwara et al. (2003) and Hagiwara (2010). A cumulative list of detected H2O maser features in the galaxy, which is revised from the table 2 in Hagiwara (2010), is presented in table 3.2.
Figure 4 shows the time variability of the maser and nuclear continuum flux densities, taking three-epoch VLA data obtained from 2002–2009 (see Figure 3 in Hagiwara (2010). There is a similar decrease, in absolute terms, in the flux densities of the southern nucleus continuum emission and the water maser emission over one decade. With two epochs in 2012 and three earlier epochs, the result is strongly suggestive, but further monitoring is required before a conclusive claim for correlation can be made.
3.2 M51
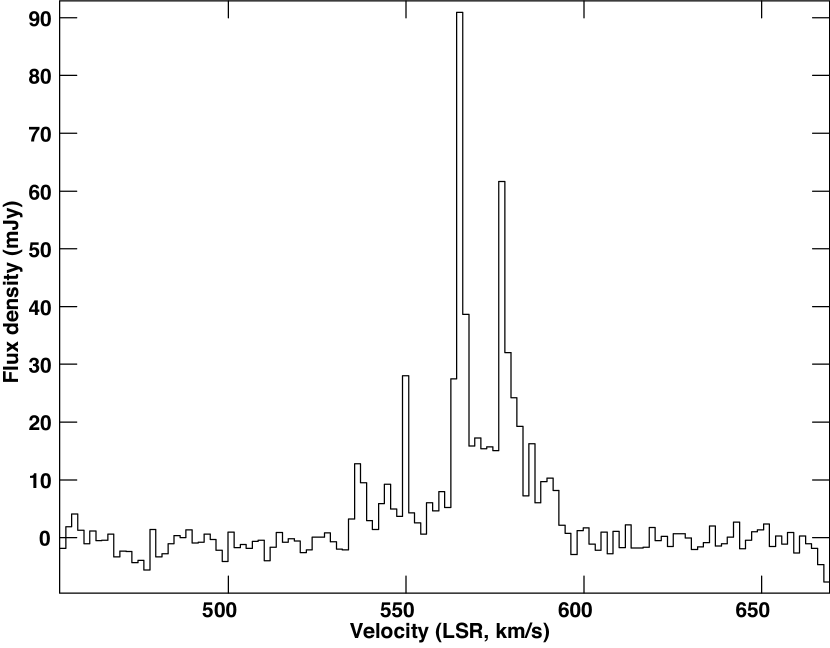
Figure 5 shows the spectrum of the maser at LSR=453.4668.2 km s-1. No maser has been detected outside this range, with the full range searching covering LSR 400 – 1300 km s-1. The detected maser features are redshifted with respect to the galaxy’s systemic velocity of LSR=4723km s(Scoville & Young, 1983). All of the detected maser emission remains unresolved at the synthesized beam size of 0.1 arcsec. The positions of the features in the spectrum are all confined within 0.01 from the position of a feature at LSR= 565.1 km s: (J2000) = 13h29m 52.708s, (J2000) = +471142.810, which is consistent with those of earlier measurements in the VLA A configuration (Hagiwara et al., 2001; Hagiwara, 2007).
A naturally weighted 22 GHz continuum image of M51 is shown in Figure 5. The continuum emission has been detected with an S/N of 6. This is the first reported detection of the 22 GHz radio continuum in M51. The image presents a nuclear source located at (J2000) = 13h29m52708, (J2000) = +471142.812, where the relative errors between the continuum source and the maser are 0”.01–0”.025). Thus, the positions of the unresolved maser sources and continuum emission are located in the same position in the galaxy within errors. The continuum image shows a jet component that is nearly northeast at PA = 158 19, the axis of which is consistent with that on the lower frequency VLA images (Bradley et al., 2004; Dumas et al., 2011). Table 3 provides a summary of radio flux densities and the spectral index of the radio source. In the VLA full-track observation performed in 2003 July, a weak velocity gradient from LSR=554 to 563 km swas identified at PA=155, nearly along the nuclear radio jet (Hagiwara, 2007); however; in our new observation no distinct velocity gradient is apparent. This may be the result of source evolution, though we note that the 2012 epoch had an observing duration of 3 hr as opposed to 8 hr in the 2003 observation, and somewhat poorer () coverage. The spectral sensitivity does not differ significantly from the previous run conducted in 2003 (Hagiwara, 2007).
| Maser (LSR, km s-1) | 22 GHz continuum | |||||||
|---|---|---|---|---|---|---|---|---|
| 7563.2 | 7609.3 | Southern Nucleus | Northern Nucleus | |||||
| (1) | (2) | (3) | (4) | (5) | (6) | (7) | ||
| 2012 Jul 21 | 6.01.5 | 9.71.5 | 9.90.5 | 13.40.7 | 4.1 | 5.50.3 | ||
| 2012 Aug 28 | 2.7a | 5.10.9 | 7.70.4 | 11.9 0.6 | 3.50.2 | 5.40.3 | ||
Note. — Col. (1): observing epoch; col. (2),(3): 22 GHz flux density (mJy) of each maser feature; col. (4)–(7): 22 GHz continuum peak flux (mJy beam-1) and integrated flux density (mJy) of the southern nucleus (S) and northern nucleus (N)
| Epoch | Telescope | Velocity range | Maser velocities | References |
|---|---|---|---|---|
| (yyyy.mm) | (km s, LSR) | (km s-1, LSR) | ||
| 2000.03 | Green Bank | 74007700 | 7565.00.8 | (1) |
| 2001.01 | Green Bank | 65008100 | 7565.60.5 | (1) |
| 2001.05 | Effelsberg | 68507870 | 7565.01.1, 7609.01.1a | (2) |
| 2001.06b | Nobeyama | 67048858 | 7566.40.5 | (3) |
| 2001.12 | Green Bank | 65008100 | 7568.60.7 | (1) |
| 2002.04 | Green Bank | 65008100 | 7567.6, 7612.10.1 | (1) |
| 2002.06 | VLA | 75257665 | 7611.02.6a | (4) |
| 2005.01 | Nobeyama | 64908610 | 7564.40.8 | (5),(6)c |
| 2007.01 | Nobeyama | 64908610 | 7442.0, 7561.50.8 | (6) |
| 2009.01 | VLA | 73707660 | 7491.10.2 | (7) |
| 2012.07 | JVLA | 65938321d | 7563.2, 7609.30.8 | This article |
| 2012.08 | JVLA | 65938321d | 7609.30.8 | This article |
References. — (1)Braatz et al. (2003), (2)Hagiwara et al. (2002), (3)Nakai et al. (2002), (4)Hagiwara et al. (2003), (5)Nakanishi et al. (2008), (6)K.Nakanishi et al. (2015, in preparation), (7)Hagiwara (2010)
4 DISCUSSION
4.1 NGC 6240
From two-epoch observations in 2012 and three earlier epochs from 2002 to 2009, we find that the strength of the maser and continuum emission from the AGNs in the southern nucleus vary in a correlated fashion. This strongly suggests that the maser in the galaxy amplifies the background continuum emission, which is exhibiting flux variability that is consistent with that typically observed from the central engine in AGNs. These observations constitute evidence for the maser in NGC 6240 being a nuclear maser similar to the cases of other H2O megamasers explored to date.
Further observations at VLBI angular resolutions would be required to determine whether the maser is a “disk maser,” tracing an inclined disk located at radii 0.1–1 pc from the central engine (e.g., Greenhill et al., 2009). It is also interesting to note the tentative detections of some new weaker features in the second epoch, whereas the prominent features at LSR= 7563.2 and 7609.3 km shave weakened. However, the emergence of the tentative features at epoch 2 is in contrast with the fact that the 7609 km smaser and the 22 GHz continuum emission weakened in epoch 2.
It is possible that these new features are not amplifying the background continuum but are associated with a starburst activity in the center of the galaxy (Genzel et al., 1998) due to the low-luminosity of these features, which is consistent with star-forming activity (Hagiwara, 2007). Further monitoring of the velocity ranges in which these new tentative features are seen is required to confirm their existence and trace their variability against the nuclear continuum.
All the maser features reported previously in the galaxy were redshifted by 200300 km swith respect to both the systemic velocity of the galaxy (LSR=7304 km s-1) and the HI peak velocity at N1 (7295 km s-1: the “systemic” velocity of the southern nucleus) (Baan, Hagiwara & Hofner, 2007). These redshifted features arise from the southern nucleus but not from the northern nucleus. The tentative detection of the LSR= 7158 km sfeature, which is blue-shifted by 150 km sfrom the systemic, may constitute the first detection of counterpart to the redshifted features. Although NGC 6240 does not display the characteristic profile of maser emission from a rotating disk (with three distinct groups of maser features, one centered close to the systemic velocity and the others offset on either side by up to 1000 km s-1), we note that if the red- and blue-shifted features are interpreted as originating in an edge-on disk (see, e.g., Miyoshi et al., 1995), the implied rotation speed ranges up to 300 km s-1. Accordingly, the possibility of star-forming maser in NGC 6240 is less likely despite the low isotropic luminosity of the maser emission.
As already discussed in Hagiwara (2010), the non-detection of the maser toward the northern nucleus is not surprising even if both nuclei host nuclear masers, because of the very small possibility of the the disks around both nuclei in the galaxy being aligned edge-on to our line of sight.
4.2 M51
One of the most important results in our observations is that the 22 GHz nuclear continuum has been detected at the location of the radio nucleus of M51. This is the first detection of the nuclear continuum source at a frequency higher than 8 GHz, due to the improved VLA sensitivity. Moreover, we find that the location of the maser components coincides with that of the nuclear continuum. This indicates that the maser in M51 is a nuclear maser that is associated with AGN activity, although the maser is classified as a “low-luminosity maser” in Hagiwara (2007). By adopting an 8 GHz flux density of 0.21 mJy that was obtained by VLA A in Table 3, the spectral index, (where ν , with ν being the flux density at frequency ), is 0.10, very flat, assuming no flux variation. According to single-dish measurements in literature the total flux density is 14215 mJy at 22.8 GHz (Klein et al., 1984). The total flux density of 0.4 mJy in our 22 GHz continuum map is clearly much lower, indicating that the source is heavily resolved on these angular scales and that we are seeing only the nucleus of the galaxy.
It is interesting to note that the jet axis that is associated with the nuclear continuum image is consistent with that previously reported at 5 and 8 GHz (Crane & van der Hulst, 1992; Bradley et al., 2004), which confirms our detection and also shows that the velocity gradient detected in the earlier VLA data is seen along this jet axis. From our current data, there is no evidence that the M51 maser is a disk maser surrounding the nucleus of the galaxy at our resolution.
We failed to image the maser velocity gradient of Hagiwara (2010) in this data. The velocity gradient was later imaged by CO (1-0) and CO(2-1) emission at 0.4–0.8 resolution in the nucleus of the galaxy, in good agreement with the velocity range and gradient direction of the maser (Matsushita et al., 2007), although these CO molecular gases are located 1 to the west of the maser or the radio nucleus. The velocity gradient in the previous data is real; however, we do not see the maser gradient in these observations, possibly due to the poorer coverage resulting from the shorter observing time.
The weak off-nuclear blue-shifted emission peaking at LSR= 445 km sthat was detected in the earlier VLA run was not detected in our observation. The blue-shifted maser is not in the nucleus and if the excitation of the maser is due to star-forming activity, it would not be surprising that the maser is weak and variable (e.g., Baudry & Brouillet, 1996).
5 SUMMARY
We report a correlated variation in the strength of the H2O maser and the 22 GHz nuclear continuum emission in the southern nucleus of NGC 6240. The H2O maser in the galaxy is additionally co-located with the nucleus and we conclude the maser is associated with AGN activity and not star formation. Thus, a scenario that argues for the possibility of a star-forming maser in the galaxy has been ruled out by our new observations. Several new minor H2O maser features are detected at low significance toward the southern nucleus of NGC 6240 in the second epoch. More sensitive observations are required to confirm these features.
We also report the first detection of 22 GHz nuclear radio continuum emission in M51. The continuum emission is co-located with the maser position, which indicates that the maser arises from nuclear AGN activity and not from star-forming activity in the galaxy.
The extragalactic H2O masers in both NGC 6240 and M51 show low isotropic luminosity on the order of 1 ☉, which is by two magnitudes lower than that of the water “megamaser,” although it is most likely that the low-luminosity H2O maser in the galaxies is a nuclear maser. The maser most likely amplifies the background radio continuum emission from the host galaxy nucleus. VLBI observations at milliarcsecond angular resolution would be able to reveal the distribution of the maser emission.
References
- Baudry & Brouillet (1996) Baudry, A. & Brouillet, N. 1996, A&A, 316, 188
- Baan, Hagiwara & Hofner (2007) Baan, W. A., Hagiwara, Y., & Hofner, P. 2007, ApJ, 661, 173
- Beswick et al. (2001) Beswick, R. J., Pedlar, A., Mundell, C. G. & Gallimore, J. F. 2001, MNRAS, 325, 151
- Bradley et al. (2004) Bradley, L. D., Kaiser, M. E., Baan, W. A. 2004, ApJ, 603, 463
- Braatz et al. (2003) Braatz, J. A., Wilson, A. S., Henkel, C., Gough, R., & Sinclair, M. 2003, ApJS, 146, 249
- Carral et al. (1990) Carral, P., Turner, J. L., Ho, P. T. P., 1990, ApJ, 362, 434
- Colbert et al. (1994) Colbert, J. M. E., Wilson, A. S. & Bland-Hawthorn, J. 1994, ApJ, 436, 89
- Crane & van der Hulst (1992) Crane, P. C., van der Hulst, J. M., 1992, AJ, 103, 1146
- Depoy, Becklin, & Wynn-Williams (1986) Depoy, D. L., Becklin, E. E., Wynn-Williams, C. G. 1986, ApJ, 307, 116
- Dumas et al. (2011) Dumas, G., Schinnerer, E., Tabatabaei, F. S., Beck, R., Velusamy, T., Murphy, E. 2011, AJ, 141, 41
- Gallimore & Beswick (2004) Gallimore, J. F. & Beswick, R. J. 2004, AJ, 127, 239
- Genzel et al. (1998) Genzel, R., et al. 1998, ApJ, 498, 579
- Greenhill et al. (2009) Greenhill, L. J., et al., 2009, ApJ, 707, 787
- Hagiwara et al. (2001) Hagiwara, Y., Henkel, C., Menten, K. M., Nakai, N. 2001, ApJ, 560, L37
- Hagiwara et al. (2002) Hagiwara, Y., Diamond, P. J., & Miyoshi, M. 2002, A&A, 383, 65
- Hagiwara et al. (2003) Hagiwara, Y., Diamond, P. J., & Miyoshi, M. 2003, A&A, 400, 457
- Hagiwara (2007) Hagiwara, Y. 2007, AJ, 133, 1176
- Hagiwara (2010) Hagiwara, Y. 2010, AJ, 140, 1905
- Hagiwara et al. (2011) Hagiwara, Y., Baan, W. A., & Klöckner, H.-R. 2011, AJ, 142, 17
- Hagiwara et al. (2013) Hagiwara, Y., Miyoshi, M., Doi, A., Horiuchi, S. 2013, ApJ, 768, L38
- Heckman (1980) Heckman, T. M., 1980, A&A, 87, 152
- Henkel et al. (1984) Henkel, C., et al. 1984, A&A, 141, L1
- Herrnstein et al. (1999) Herrnstein, J. R., et al. 1999, Nature, 400, 539
- Humphreys et al. (2005) Humphreys, E. M. L., Greenhill, L. J., Reid, M. J., Beuther, H., Moran, J. M., Gurwell, M., Wilner, D. J., Kondratko, P. T. 2005, ApJ, 634, L133
- Ho et al. (1987) Ho, P. T. P., et al. 1987, ApJ, 320, 663
- Klein et al. (1984) Klein, U., Wielebinski, R., & Beck, R. 1984, A&A, 135, 213
- Komossa et al. (2003) Komossa, S., Burwitz, V., Hasinger, G., Predehl, P., Kaastra, J.S. & Ikebe, Y. 2003, ApJ, 582, L15
- Matsushita et al. (2007) Matsushita, S., Muller, S., and Lim, J. 2007, A&A, 468, L49
- Miyoshi et al. (1995) Miyoshi, M. Moran, J., Herrnstein, J., Greenhill, L., Nakai, N., Diamond, P., Inoue, M. 1995, Nature, 373, 127
- Nakai et al. (2002) Nakai, N., Sato, N., & Yamauchi, A. 2002, PASJ, 54, L27
- Nakanishi et al. (2008) Nakanishi, K., et al., 2008, in Mapping the Galaxy and Nearby Galaxies, Astrophysics and Space Science Proceedings, ed. K.Wada & F.Combes (Springer, New York), 364
- Perley et al. (2011) Perley, R. A., Chandler, C. J., Butler, B. J., & Wrobel, J. M. 2011, ApJ, 739, L1
- Reid and Honma (2014) Reid, M. J., Honma, M. 2014, ARA&A, 52, 339
- Risaliti et al. (2006) Risaliti, G., et al. 2006, ApJ, 637, L17
- Sanders et al. (1988) Sanders, D. B., Soifer, B. T., Elias, J. T., et al. 1988, ApJ, 325, 74
- Scoville & Young (1983) Scoville, N., & Young, J. S. 1983, ApJ, 265, 148