The Fornax Deep Survey with VST. I.
The extended and diffuse stellar halo of NGC 1399 out to 192 kpc.
Abstract
We have started a new deep, multi-imaging survey of the Fornax cluster, dubbed Fornax Deep Survey (FDS), at the VLT Survey Telescope. In this paper we present the deep photometry inside two square degrees around the bright galaxy NGC 1399 in the core of the cluster. We found that the core of the Fornax cluster is characterised by a very extended and diffuse envelope surrounding the luminous galaxy NGC 1399: we map the surface brightness out to 33 arcmin ( kpc) from the galaxy center and down to mag arcsec-2 in the band. The deep photometry allows us to detect a faint stellar bridge in the intracluster region on the west side of NGC 1399 and towards NGC 1387. By analyzing the integrated colors of this feature, we argue that it could be due to the ongoing interaction between the two galaxies, where the outer envelope of NGC 1387 on its east side is stripped away. By fitting the light profile, we found that it exists a physical break radius in the total light distribution at arcmin ( kpc) that sets the transition region between the bright central galaxy and the outer exponential stellar halo. We discuss the main implications of this work on the build-up of the stellar halo at the center of the Fornax cluster. By comparing with the numerical simulations of the stellar halo formation for the most massive BCGs (i.e. ), we find that the observed stellar halo mass fraction is consistent with a halo formed through the multiple accretion of progenitors with stellar mass in the range M⊙. This might suggest that the halo of NGC 1399 has also gone through a major merging event. The absence of a significant number of luminous stellar streams and tidal tails out to 192 kpc suggests that the epoch of this strong interaction goes back to an early formation epoch. Therefore, differently from the Virgo cluster, the extended stellar halo around NGC 1399 is characterised by a more diffuse and well-mixed component, including the ICL.
1 Introduction
Deep and large-scale multi-band imaging are crucial to study the galaxy outskirts, out to hundreds of kiloparsecs, where the imprints of the mass assembly reside: these are the regions of the stellar halos. Under the hierarchical accretion scenario, galaxies at the center of the clusters continue to undergo active mass assembly and their halos are still growing in the present epoch: stellar halos and the diffuse intracluster light (ICL) results from the stripping of stars off of the cluster members by minor mergers and dynamical harassment (De Lucia & Blaizot, 2007; Puchwein et al., 2010; Cui et al., 2014).
Observations show that stellar halos can be made of multiple stellar components, can have complex kinematics and host substructures, in the form of shells and tidal tails, which indicate gravitational interactions, like merging and/or accretion, in the formation history of a galaxy (see Bender et al., 2015; Longobardi et al., 2015, and references therein). The light distribution of the stellar halos can appear as a different component at large radii with respect to the inner light profile, showing an exponential decrease (Seigar et al., 2007; Donzelli et al., 2011), or, alternatively, they result as shallower outer region of the whole light profile, which can be well fitted by a single Sersic law with a high value of the exponent, , (Bender et al., 2015). The relics of the interactions, such as tails, shells or streams, are also very faint, with a typical surface brightness below mag arcsec-2. Therefore, their detection requires very deep imaging and a careful data reduction, able to perform the sky subtraction with an accuracy of a few percent.
In the recent years, a big effort was made to develop deep photometric surveys aimed to study galaxy structures up to the faintest levels of surface brightness, which reveal such a kind of low luminosity structures and trace the stellar halos at very large distances from the galaxy center (Mihos et al., 2005; Janowiecki et al., 2010; Martínez-Delgado et al., 2010; Roediger et al., 2011; Ferrarese et al., 2012; Duc et al., 2015; van Dokkum et al., 2014; Muñoz et al., 2015; Trujillo & Fliri, 2015). Recently, deep images of the Virgo cluster have revealed several faint ( mag arcsec-2) streams of ICL among the galaxy members and made it possible to map the stellar halos of the bright cluster galaxies (BCGs) at very large distances from the center (Janowiecki et al., 2010). In particular, the halo of M87 is traced out to about 150 kpc (Mihos, 2015). A steep color gradient towards bluer colors is measured in the halo regions, suggesting a significant contribution of metal-poor stars in its outskirts. In this context, the VEGAS survey, an ongoing multi-band survey of early-type galaxies in the Southern hemisphere (Capaccioli et al., 2015), is producing competitive results. In particular, for the cD galaxy NGC 4472 (in the Virgo cluster) genuine new results concern the detection of an intracluster light tail between , in the range of surface brightness of 26.5 - 27.6 mag/ arcsec2 in the band.
For galaxies in the local universe ( Mpc), the properties of the stellar halos can also be addressed using discrete tracers such as globular clusters (GCs) and planetary nebulae (PNe). Observations show that the red GCs populations have number density profile consistent with that of the stars of the parent galaxy, while the blue GCs are spatially more extended in the intra-cluster space and they trace the metal-poor component of the halo (Forbes et al., 2012; Pota et al., 2013; Durrell et al., 2014; Hilker et al., 2015; Cantiello et al., 2015). In the Hydra cluster, the location of blue GCs coincides with a group of dwarf galaxies under disruption, suggesting a young stellar halo that is still forming (Arnaboldi et al., 2012; Hilker et al., 2015). In this case, this interpretation is further supported by kinematic measurements. In M87, the kinematics of PNe, their -parameter and the shape of the luminosity function, allow to separate the halo component from the ICL population (Longobardi et al., 2015a). As stressed by Bender et al. (2015), deep photometry alone is not enough to recognise the structure of the stellar halo, and kinematics measurement are necessary when possible. In particular, the possibility to infer the variation of the orbital distribution of stars, PNe and GCs (e.g. Gerhard et al., 2001; Romanowsky et al., 2009; Napolitano et al., 2009, 2011, 2014; Pota et al., 2015) in the galaxy haloes is a strong observational test for galaxy formation scenarios that can be compared with predictions of hydrodynamical simulations (e.g. Wu et al., 2014).
From the theoretical side, semi-analytic models combined with cosmological N-body simulations have become very sophisticated, with detailed predictions about the structure of stellar halos, the amount of substructure, the mass profiles, metallicity gradients, etc. (Cooper et al., 2013; Pillepich et al., 2014, e.g.), in various types of environment. Recent studies have demonstrated that the overall structure of stellar halos, their stellar populations and the properties of their dynamical substructure directly probe two fundamental aspects of galaxy formation in the CDM model: the hierarchical assembly of massive galaxies and their dark matter halos, and the balance between in situ star formation and accretion of stars through mergers (Cooper et al., 2013, 2015a, 2015b; Pillepich et al., 2015).
The rich environments, clusters and groups of galaxies, are the ideal laboratory to probe the physical processes leading to the formation of the stellar halos and the ICL. In this framework, we are performing a deep multiband (,, and ) survey of the nearby Fornax cluster, at the VLT Survey Telescope (VST), situated at the Paranal observatory of the European Southern Observatory. The Fornax Deep Survey (FDS) with VST aims to cover the whole Fornax cluster out to the virial radius (Drinkwater et al., 2001), with an area of about square degrees around the central galaxy NGC 1399, including the region where NGC 1316 is located. The FDS will provide an unprecedented view of the structures of the cluster members, ranging from giant early-type galaxies to small spheroidal galaxies. The multi-band deep images will allow us to map the light distribution and colors of cluster galaxies out to 8-10 effective radii, in order to study the inner disks and bars, the faint stellar halo, including the diffuse light component, and the tidal debris as signatures of recent cannibalism events. Moreover, FDS will also give a full characterisation of small stellar systems around galaxies, as globular clusters (GCs) and ultra-compact dwarf galaxies (UCDs).
A detailed description of the FDS observations, data reduction and analyzis, and scientific goals is the subject of a forthcoming paper. In this work, it’s urgent to present the first results of the FDS, focused on the bright cluster member NGC 1399, which is the cD galaxy in the core of Fornax cluster. This galaxy has been studied in detail in a wide wavelength range, from radio to X-ray. NGC 1399 is characterised by a large number of compact stellar systems (GCs and UCDs), for which several studies have provided the number density distribution and stellar population estimates (Dirsch et al., 2003; Mieske et al., 2004; Bassino et al., 2006; Schuberth et al., 2010; Puzia et al., 2014; Voggel et al., 2015).
The photometry and kinematics of the inner and brighter regions of the galaxy resemble those for a typical elliptical galaxy (Saglia et al., 2000). The 2-dimensional light distribution of the central brightest regions of the galaxy appear very regular and round in shape (Ferguson et al., 1989). The most extended light profiles where published by Schombert (1986) in the V band and those by Caon et al. (1994) in the B band, mapping the surface brightness out to arcmin ( kpc) and arcmin ( kpc), respectively. The most extended kinematics of stars (out to arcsec) was derived by Saglia et al. (2000): it shows a small rotation ( km/s) and a high stellar velocity dispersion in the center ( km/s), which decreases at larger radii and remains constant at 250-270 km/s. At larger radii, out to arcmin, the kinematics is traced by GCs and PNe (Schuberth et al., 2010; McNeil et al., 2010). The kinematics of red and blue GCs are distinct, with red GCs having velocity dispersion consistent with that of stars, while blue GCs are more erratic, showing an higher velocity dispersion, km/s, (Schuberth et al., 2010). The velocity dispersions of the PNe are consistent with the values derived by the stars kinematics and with those for the red GCs (Napolitano et al., 2002; McNeil et al., 2010). The X-ray data have shown the presence of a hot gaseous halo associated to NGC 1399, which extends out to about 90 kpc (Paolillo et al., 2002). It appears very asymmetric, consisting of three components which dominate at different scales: the central bright part, coincident with the peak of light, the ’galactic’ halo that extends out to arcmin, which is offset toward the west with respect to the optical galaxy centroid, and, on larger scales, the ’cluster’ halo that is elongated in the opposite direction. The galactic halo is very inhomogeneous, showing the presence of several cavities and arc-like features (see Fig.3 and 6 in Paolillo et al., 2002). Differently from the compact stellar systems and X-ray emission, the light distribution and colors in the faint outskirts of NGC 1399 are still unexplored. As part of the FDS, in this paper we present the analyzis of the deep photometry performed in the and bands inside two square degrees around NGC 1399 in order to unveil the stellar halo of this galaxy at the largest galactocentric distances and in unexplored range of surface brightnesses.
In the following, we adopt a distance for NGC 1399 of D=19.95 Mpc (Tonry et al., 2001), which yields an image scale of 96.7 parsecs/arcsec.
2 Observations, Data Reduction and Analysis
The ongoing FDS observations are part of the Guaranteed Time Observation surveys, FOCUS (P.I. R. Peletier) and VEGAS (P.I. M. Capaccioli, Capaccioli et al., 2015) being performed at the ESO VLT Survey Telescope (VST). VST is a 2.6-m wide field optical survey telescope, located at Cerro Paranal in Chile (Schipani, 2012). VST is equipped with the wide field camera OmegaCam, spanning a degree2 field of view, in the optical wavelength range from 0.3 to 1.0 micron (Kuijken, 2011). The mean pixel scale is 0.21 arcsec/pixel.
The observations presented in this work were collected during a visitor mode run from 11 to 23 of November 2014 (runID: 094.B-0496[A]). Images are in the , , and bands. All images were acquired in dark time. They cover five fields of 1 deg2, one of them centerd on the core of the Fornax cluster (, ). Observations were obtained by using a step-dither observing sequence, consisting of a cycle of short exposures, one centerd on the core of the Fornax cluster and others on 3 adjacent fields all around it ( degree) on the SW and NW side. This approach, already adopted in other photometric surveys (Ferrarese et al., 2012), allows a very accurate estimate of the sky background around bright and extended galaxies.
For each field we have obtained 76 exposures (of 150 sec each) in the band, 54 in the and bands, and 35 in the band, giving a total exposure time of 3.17 hrs in the band, 2.25 hrs in the and bands and and of 1.46 hrs in the bands. The average seeing during the observing run ranged between 0.6 and 1.1 arcsec.
The data reduction has been performed with the VST-Tube imaging pipeline: a detailed description of it, including calibrations and error estimate, is given by Capaccioli et al. (2015). The observing strategy adopted for this data-set allows to derive an average sky image, from exposures taken as close as possible in space and time, to the scientific ones. The average sky frame is derived for each observing night, then it is scaled and subtracted off from each science frame.
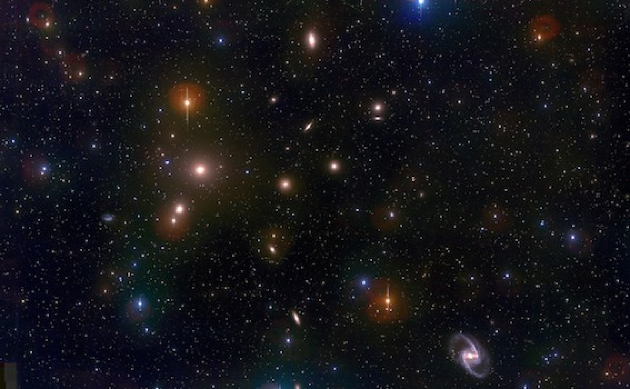
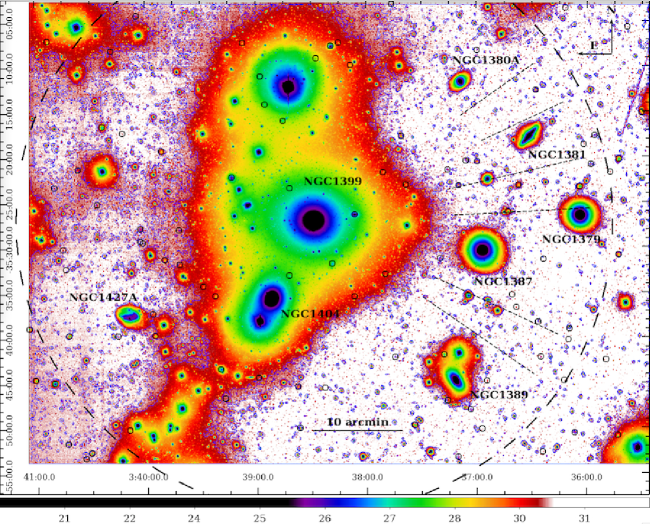
The color composite mosaic (from the , and bands) of the central degrees2 around the central cD galaxy NGC 1399 is shown in Fig. 1. In this work we concentrate our analysis on the and band images of this region, in order to study the light distribution of the stellar halo and the diffuse ICL component. In a forthcoming paper, where we will also present the full dataset of the FDS observations, we will show the photometry and structure of all the bright galaxies in the whole mosaic, including the 2-dimensional model of the light distribution (Iodice et al., in preparation).
2.1 Surface Photometry
One of the goals of the FDS is to map the surface brightness and color profiles out to the very faint outskirts of the cluster member galaxies (up to about 8-10 effective radii ). To this aim, the crucial step is to account for all the effects that can contribute to the sky brightness with the highest accuracy. As mentioned in the previous section, data were acquired in completely dark nights. By looking at the 100 micron image available at the NASA/IPAC Infrared Science Archive we have checked that the region of the Fornax cluster is almost devoid of cirrus, thus cirrus do not contaminate the images. Other possible sources that can contribute to the sky brightness are the extragalactic background light, the zodiacal light and the terrestrial airglow (Bernstein et al., 2002). The zodiacal light decreases in intensity with distance from the Sun, it is very faint at low ecliptic latitudes (Bernstein et al., 2002). Therefore, considering the ecliptic latitude of the Fornax cluster and the low airmass value during the observations (), the contribution by the zodiacal light and also of the terrestrial airglow are very low. Given that, the small contribution by the smooth components listed above to the sky brightness is taken into account by the sky frame derived for each observing night and then subtracted off from each science frame (see Sec. 2). Since each sky frame is taken on a field close in distance to the target, and taken close in time, the average value of all the smooth sources listed above is estimated in that way, thus only a possible differential component could remain in the sky-subtracted science frame. To estimate any residuals after the subtraction of the sky frame that can take into account also such a differential effects, we proceeded as follows. On the whole sky-subtracted mosaic, in each band, after masking all the bright sources (galaxies and stars) and background objects, we extracted the azimuthally-averaged intensity profile with the IRAF task ELLIPSE. The fit is performed in elliptical annuli, centerd on NGC 1399, with fixed Position Angle (P.A.) and ellipticity (), given from the isophotes at arcmin, where degrees and . The major axis increases linearly with a step of 100 pixels out to the edges of the frame, i.e. out to about 100 arcmin, excluding the border that is characterised by a larger noise. This method allows us i) to measure any residual fluctuations111 The residual fluctuations in the sky-subtracted images are the deviations from the the background in the science frame with respect to the average sky frame obtained by the empty fields close to the target. Therefore, by estimating them, we obtain an estimate on the accuracy of the sky-subtraction step. in the sky-subtracted images and then take them into account in the error estimate of the surface brightness, and ii) to estimate the distance from the galaxy center where the galaxy’s light blends into the background at zero counts per pixel, on average. This method was firstly suggested by Pohlen & Trujillo (2006) to study the light profiles of spiral galaxies and also adopted by Iodice et al. (2014) on the deep VISTA wide-field images of NGC 253.
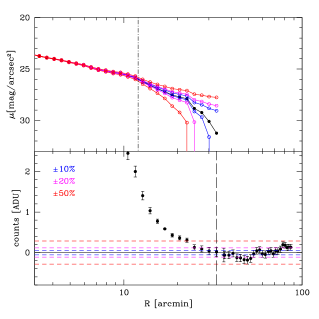
From the intensity profiles, we estimated the outermost radius, from the center of the galaxy, where counts are consistent with those from the average background level. Such a value is the residual by the subtraction of the sky frame, thus it is very close to zero. The radius where the galaxy’s light blends into this level sets the surface brightness limit of the VST light profiles and gives an estimate on the accuracy of the sky subtraction. In the bottom panel of Fig. 2 we show the intensity profile in the band, centerd on NGC 1399 and extending out to the edge of the mosaic, as a function of the semi-major axis. We derived that for arcmin ( kpc) we are measuring the residual fluctuations of the sky. The error on the average value is 0.11 counts. The fluctuations of the background level are less than 0.2 counts. The same approach is adopted in the band and it gives a limiting radius of arcmin, an error on the average value of 0.2 and fluctuations of the background level that are less than 0.4 counts.
The isophotal analysis of NGC 1399 is performed by using the ELLIPSE task out to the limiting radii estimated above, where the semi-major axis length is sampled with a variable bin. We derived the azimuthally averaged surface brightness profiles (see Fig. 2 and Fig. 3), as well as the ellipticity and P.A. profiles (see Fig. 4), as function of the semi-major axis. The surface brightness profiles extend down to mag arcsec-2 and mag arcsec-2, in the and bands respectively. According to Capaccioli et al. (2015) and Seigar et al. (2007), the error estimates222The uncertainty in the surface brightness is calculated with the following formula: , where , with N is the number of pixels used in the fit, is the rms on the sky background and is the error on the photometric calibration (Capaccioli et al., 2015; Seigar et al., 2007). on the surface brightness magnitudes take the uncertainties on the photometric calibration ( mag) and sky subtraction ( counts) into account. We noticed that, for a large area of the mosaic ( to arcmin from the galaxy center) the fluctuations on the background level are not larger the 10% (see bottom panel of Fig. 2). While, on a smaller range of radii, for arcmin and for arcmin from the galaxy center, the deviations from the average zero-level of the background affect by about the 20% the surface brightness for mag arcsec-2 and mag arcsec-2. Therefore, to adopt a conservative approach the error estimate on the sky subtraction takes into account the largest values of about 20% in the residuals, even if it is worth stressing that this is an upper limit and that this value is smaller, on average.
Before discussing the light profiles and the 2-dimensional light and color distribution (see next section), we present here some tests on the reliability of our results.
We noticed that the light profiles show a change in the slope at arcmin ( kpc) and at mag arcsec-2 (see Fig. 3). In a logarithmic scale this is quite evident. At this break radius the light profiles become steeper. The relatively high surface brightness level at which the change of slope is observed suggests that it should not be due to wrong estimate of the sky level. Nevertheless, we have checked this as follows. In the left panel of Fig. 2 we show how much the light profile changes by accounting for a sky level , and higher or lower the average background level. Even if the average sky level was wrong by the change in the slope would be still present and only the outer points (at arcmin) would be affected. To obtain a shallower profile from arcmin, of about more than 2 mag arcsec-2, the sky level would have to be lower. Anyway, also in this case, for arcmin a slope variation in the light profile is still evident. By looking at the bottom panel of the Fig. 2, this large difference can be excluded since the observed background level out the edge of the mosaic is clearly higher.
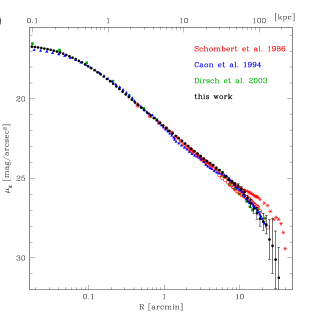
A further check comes by comparing the light profiles obtained from the VST data with literature data for NGC 1399. All the light profiles from the literature were shifted to the -band profile, by using the transformations from Fukugita et al. (1996). The most extended light profiles published in the optical bands for NGC 1399 are from Schombert (1986), Caon et al. (1994) and Dirsch et al. (2003) and they are compared with the VST profile in the band in the right panel of Fig. 2. On average, the agreement is quite good. The light profile by Caon et al. (1994) extends out to 14 arcmin. It was obtained along the major axis of NGC 1399 in the B band and this causes some differences, between the two profiles, that are evident for arcmin. A change in the slope is observed at the same radius ( arcmin) as the one derived from the VST -band profile (see right panel of Fig. 2). The light profile published by Dirsch et al. (2003) (in the R band) is not an azimuthally average but it is derived by measuring the surface brightness around all targeted GCs sources within an annulus between 8 and 11 arcsec. Compared to the VST profile, the agreement is very good. Even if it is less extended and does not reach the same faint surface brightness levels as our data, a drop is still observed for arcmin. The most extended light profile ( arcmin) available in literature is that from Schombert (1986) in the V band. It is consistent with the VST profile out to arcmin. As previously argued by Dirsch et al. (2003), the discrepancy of this profile from all others might be due to an overestimated background and/or additional light from the bright objects close to NGC 1399, that were not completely masked. Indeed, if we correct the background level for the profiles published by Schombert (1986) of about the , it becomes fully consistent with the other results (see open red circles in the right panel of Fig. 2).
3 Results: Light and color distribution out to 192 kpc
In Fig. 5 we show the the sky-subtracted VST image in the band centerd on NGC 1399, plotted in surface brightness levels, where the outermost isophote at arcmin ( kpc) is overlaid. In order to highlight the low surface brightness structures we performed a gaussian smoothing with a radius of 20 pixels.
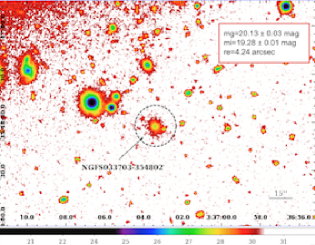
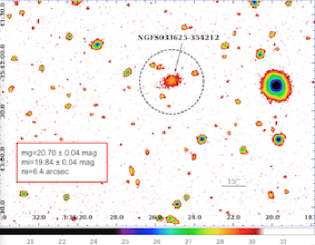
At these large distances we are mapping the faint stellar outskirts of NGC 1399, which encloses most of the bright galaxies in the core of the Fornax cluster. On this image we have identified the whole sample of the dwarf population in the Fornax cluster observed in the DECAM images, published by Muñoz et al. (2015). As an extra-check of the detection limit of the VST data, we provide in Fig. 6 the enlarged portion of the mosaic in the band where two dwarf galaxies among the faintest and new objects discovered by Muñoz et al. (2015) are located. We selected two examples, one nucleated and one non-nucleated dwarf, which appear clearly detectable also in the VST.
3.1 The low surface brightness substructures in the outskirts of NGC 1399
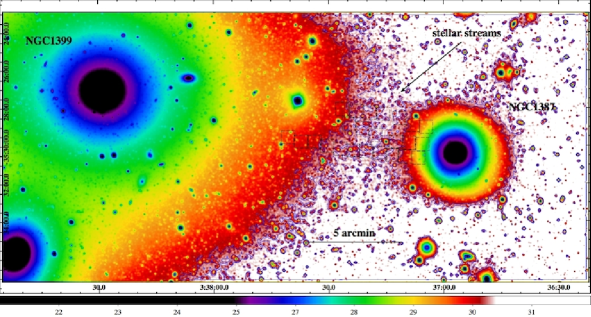
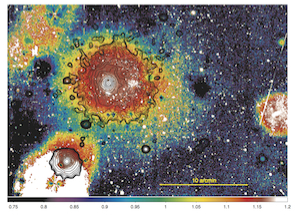
In the region between NGC 1399 and NGC 1387 we detect a ”bridge-like” stellar stream. This feature is much more evident in the enlarged image shown in Fig. 7 (top panel): it appears to be made by several filamentary structures that connect the two galaxies. They are about 5 arcmin long ( kpc) and cover an area of about 4.5 arcmin ( kpc). They have an average surface brightness of mag arcsec-2 ( mag arcsec-2). Also the isophotes of NGC 1387 are not symmetric with respect to the galaxy center, appearing more elongated toward the SW.
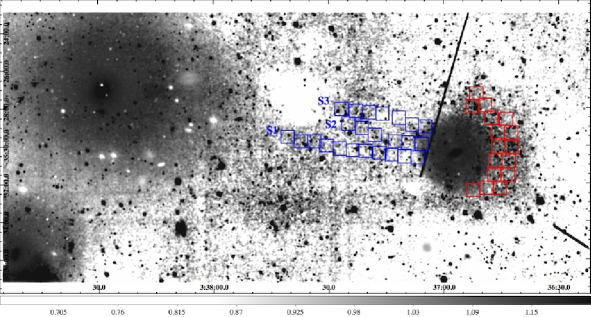
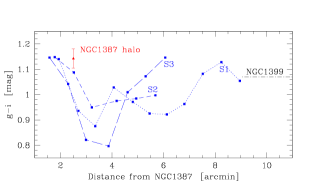
The color map in the area of the stellar streams, shown in the bottom panel of Fig. 7, shows that, on average, the stellar bridge is bluer than the two close galaxies. The asymmetry in the SW of NGC 1387 is a very extended arc-like region with redder colors. We derived the average colors in several regions covering the three main filaments in the stellar bridge (see boxes in Fig. 7) and in the red arc on the west side of NGC 1387 (see red boxes in the bottom panel of Fig. 7). Results are plotted in Fig. 8. We found that in the middle region of the stellar bridge the mag. This value is about mag bluer than the average colors in the regions closer to NGC 1399 and NGC 1387, which are about 1.08 and 1.14 mag, respectively (see Fig. 8). Given the very low level of the surface brightness, the stellar bridge and the features identified in the color map were unknown in the previous works.
The existence of a stellar stream towards NGC 1387 was already proposed by Bassino et al. (2006) based on their study of the projected distribution of the blue GCs (see Fig.9 of that paper) and recently confirmed by D’Abrusco et al. (2016) using our FDS data (see Fig. 3 and Fig. 4 of that paper). The system of stellar streams detected in this work match very well in space and size the bridge detected in the blue GCs spatial distribution.
Differently from the GCs, the spatial distribution of the dwarf galaxies do not show any evident correlation with the stellar stream between NGC 1399 and NGC 1387 (see Fig. 5). This cannot be considered as a definitive conclusion since we cannot exclude the presence of undetected faint and diffuse dwarfs inside the stellar streams (this aspect will be further investigated in a dedicated work on the FDS data).
The stellar bridge could be the sign of an ongoing interaction between the two galaxies. This aspect is discussed in detail in Sec. 4.
3.2 Isophote analysis
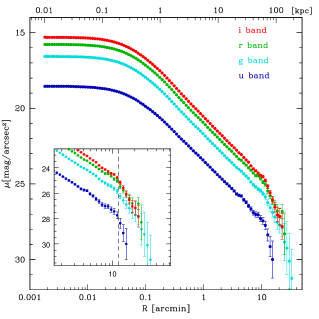
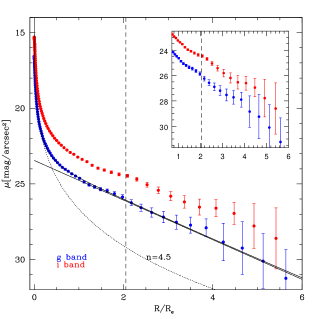
The azimuthally averaged light profiles of NGC 1399 in the , , and bands are shown in the left panel of Fig. 3. The light profile in the band is the most extended, out to 33 arcmin ( kpc) from the galaxy center, and the deepest, down to mag arcsec-2 ( mag arcsec-2). In the band, we reach the faint level of mag arcsec-2 at arcmin (see Fig. 3). As pointed out in the previous section, the -band light profile shows a slope variation at arcmin ( kpc) and at mag arcsec-2 ( mag arcsec-2), which is quite evident when plotted logarithmically. This is a common feature in the light profiles of all other bands, where for they are steeper.
By integrating the growth curve of the azimuthally averaged profiles, the total magnitudes inside 33 arcmin in the band and 27 arcmin in the band are mag and mag ( mag), respectively. Values were corrected for the Galactic extinction by using the absorption coefficient and derived according to Schlegel et al. (1998). The absolute magnitude in the band is mag, therefore the total luminosity is . The effective radii are arcmin, in the band, and arcmin and band. The above values for the effective radii are larger than that given by Caon et al. (1994), which is arcmin: this is the effect of a more extended light profile in the VST -band images (see right panel of Fig. 2). We derived the effective radius integrating the grow curve out the last data point in the Caon et al. (1994) profile, i.e. arcmin, and we have obtained arcmin, which is consistent with the already published value. According to the estimates given above, the surface brightness profiles in and bands extend out to about (see right panel of Fig. 3).
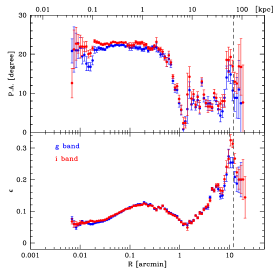
The Position Angle (P.A.) and ellipticity (, where is the axial ratio of the ellipses) of the isophotes change towards larger radii (see Fig. 4). Inside 0.5 arcmin, isophotes are almost round () and the P.A. is constant at about 22 degrees. For arcmin a large twisting is observed: the P.A. decreases by about 20 degrees. At larger radii, for arcmin, the ellipticity increases and reaches a maximum of in correspondence of the break radius, while the P.A. remains constant at degrees and it also shows a peak ( degrees) at . Thus, for arcmin, the light distribution tends to be more flattened and elongated towards the SW direction than in the inner regions.
3.3 Light profiles at several P.A.s
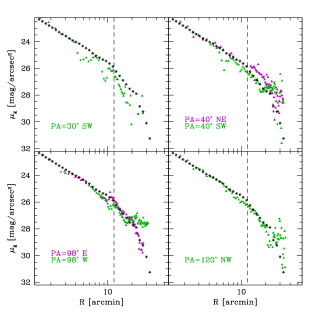
The steeper behaviour of the outer profile is confirmed by the light profiles extracted along several position angles: at P.A.=98 degrees, which correspond to the major axis of the outer component (for , see Fig. 4), and other 3 intermediate directions at P.A.=30 degrees, P.A.=40 degrees and P.A.=120 degrees. The surface brightness is computed in a sector of ten degrees wide and corrected for the flattening. Results are shown in Fig. 9. Profiles on the NE side at P.A.=30 degrees and on the SE side at P.A.=30 degrees are not included in the plot since most of the regions out to 5 arcmin fall in the masked areas.
We found that the light distribution of the fainter outskirts at has on average the same light profile at different position angles. In particular, even taking into account the larger scatter than the azimuthally averaged profile, at all P.A.s the light profiles show a change in the slope for . On the West side, for arcmin an excess of light is measured at P.A. degrees, where mag arcsec-2 ( mag arcsec-2), which is two magnitudes brighter than the light at the correspondent radii on the East side. This region is the intracluster area among NGC 1387, NGC 1379 and NGC 1381, where also D’Abrusco et al. (2016) find an excess of intracluster GCs. On the same side, at P.A. degrees (NW) a peak in the surface brightness is observed at arcmin, with mag arcsec-2 ( mag arcsec-2): on the image, this is the region between NGC 1381 and NGC 1380B. Similar features are observed on the SW side, at P.A. degrees, with mag arcsec-2 ( mag arcsec-2) for arcmin, almost one magnitude brighter than the NW profile at the same radii: at this distance from NGC 1399 we are mapping the light between NGC 1389 and NGC 1387. As discussed in Sec. 2.1, at these faint surface brightness, small fluctuations of the residual sky level could account for such kind of effect, which might become even more significant on a smaller area than a large elliptical annulus. Even if no definitive conclusion can be drawn at this point, since we are mapping regions where the surface brightness values are comparable with the sky fluctuations, it is important to note that such ”excess” of light is measured on the West side of the cluster core where most of the galaxies are located, while, on the East side, inside the same radius, only the dwarf irregular galaxy NGC 1427A is present (see Fig. 1 and Fig. 5).
In a forthcoming paper we show the analysis of the light distribution for all the bright galaxies in the core of the Fornax cluster, therefore, after modelling it and subtract off from the whole image, we could address wether those light excesses are still present in this regions or, alternatively, they are just the overlapping stellar halos of these galaxies.
3.4 Color profiles and color map
The , and color profiles are shown in Fig. 10. The center of the galaxy is red, with mag and mag. A strong gradient towards bluer values is observed in the color profile, where mag for arcmin. In the same range of radii, the difference in the and the values is only mag. Close to the break radius, all the color profiles show a bump of about 0.1-0.2 magnitude redder than the central values.
For , has almost the same value as the inner radii, i.e. . The colors seem to be bluer, since mag, while the are redder up to 1 magnitude. This effect can be explained as a gradient in metallicity (see e.g. Peletier et al., 1990).
In Fig. 11, we show the color map centered on NGC 1399. In the inner regions, at arcmin from the center, there is an extended red tail ( mag) on the West side of the galaxy. This could be a sign of a recent minor merging event. At the same distance from the center ( arcmin) and on the same side (west), Coccato et al. (2013) found asymmetries in the kinematics traced by GCs: a recent accretion of a dwarf galaxy was given as a possible explanation of this feature. For , the color map appears asymmetric with respect to the center, it is more extended and redder on the SW side, where mag. By comparing the X-ray density contours to the color map, we found a surprising correspondence between the morphology and extension of the ’galactic’ X-ray halo (see Paolillo et al., 2002) on the west side of the galaxy and the color asymmetries observed in the stellar light. In particular, X-ray contours match with the shape of the red tail observed in the inner regions of the galaxy on the west side.

3.5 Profile fitting: the exponential halo around NGC 1399
As pointed out in Sec. 1, several recent works have shown that the light profiles of BCGs are not uniquely and well fitted by a single Sersic profile, where the intensity , but in several cases a second component is needed to fit the outer stellar halo (Seigar et al., 2007; Donzelli et al., 2011; Arnaboldi et al., 2012). For NGC 1399, Schombert (1986) tried to fit the light profile with a single component, using the de Vaucouleur’s law: the best fit matches very well only the inner and brighter regions of the galaxy for arcmin. As discussed above, the azimuthally averaged light profiles of NGC 1399 (in both and bands) have an extended steeper behaviour for (see right panel of Fig. 3), which clearly requires a fit with two components. Therefore, we adopted a Sersic law (Sersic, 1963), given by the equation
| (1) |
which accounts for the inner and most luminous part of the galaxy, plus an outer exponential function given by
| (2) |
In the above formulae is the galactocentric distance, and are the effective radius and effective surface brightness respectively, (see Caon et al., 1993), and are the central surface brightness and scale length of the exponential component.
We performed a least-square fit of the azimuthally averaged surface brightness profile in the band, for arcmin, to exclude the power-law core of the galaxy. The structural parameters that give the best fit are the following: mag arcsec-2 ( mag arcsec-2), arcsec ( kpc), , mag arcsec-2 ( mag arcsec-2), arcsec ( kpc) and results are shown in the right panel of Fig. 3. The total -band magnitude of the exponential component, corrected for the galactic extinction (see Sec. 3), is mag. Thus, compared to the total magnitude of the whole system (see Sec. 3), it contributes about 60% of the total light, where the ratio is .
The above parameters are within the range of values derived by Donzelli et al. (2011) for the 205 BCGs having double component profiles. In particular, the scale length of the exponential component measured for NGC 1399 is comparable with the average value of 25 kpc found for this large sample of galaxies.
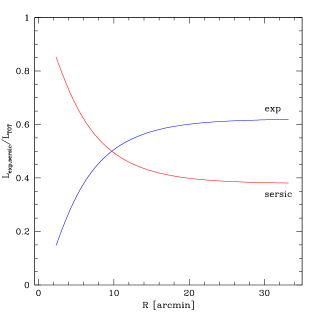
From the best fit, we derived the total luminosity of the Sersic component and of the exponential one as function of the radius. In Fig. 12 are plotted the relative fraction of the two components with respect to the total light profile: the inner Sersic component dominates the light distribution inside arcmin (), where the contribution to the total light is about the 90%. At arcmin, the two components contribute by the 50% to the total light. This is consistent with the previous fit performed by Schombert (1986), where a de Vaucouleur’s law reproduces very well the light distribution inside 10 arcmin. The exponential component in NGC 1399 is the dominant ones for arcmin, i.e. outside .
The striking result of this analysis is that the break radius, identified by a ”visual inspection” of the light profiles, is a physical scale separating the regions where the main galaxy and the stellar halo dominate. We had already commented that the transition between the two components occurs at the same radius where the ellipticity and P.A. of the isophotes become flattened and misaligned (see Fig. 4). Hence one can argue that the bright inner regions are almost spherical and the exponential component is more flattened, implying a different formation mechanism.
4 Discussion: tracing the build-up history of the extended halo at the center of the Fornax cluster
We have obtained a new deep mosaic of the Fornax cluster with VST, in the , , and bands, which covers an area of about square degrees around the central galaxy NGC 1399 (see Fig. 1). In this paper we focused on the light distribution in the and bands inside 2 square degrees around NGC 1399. The large mosaic obtained with the 1 deg2 field-of-view pointings of OmegaCam and the large integration time allow us to map the surface brightness out to 33 arcmin ( kpc) from the galaxy center in the band (see Fig. 3). At these large distances we are mapping the faint outskirts of NGC 1399, down to mag arcsec-2 ( mag arcsec-2): the stellar envelope, central galaxy plus ICL, encloses most of the bright galaxies in the core of the Fornax cluster (see Fig. 5).
The main results given by the analysis of the light distribution down to the above levels of surface brightness are the following:
-
1.
we detected a ”bridge-like” stellar stream in the region between NGC 1399 and the nearby early-type galaxy NGC 1387 (see Fig. 7). It is very faint, with mag arcsec-2 ( mag arcsec-2), and it is about 5 arcmin wide ( kpc). Given the very low level of the surface brightness, this structure was unknown in the previous works;
-
2.
the azimuthally averaged light profile in the band is consistent with the presence of two main components: the bright central part of NGC 1399, which contributes about 90% of the light inside 1 arcmin (i.e. ) and it is well fitted by a Sersic law with , and an exponential outer component from arcmin, which contributes to about 60% to the total galaxy light and extends out to about (see Fig. 3). The break radius at arcmin is a physical scale separating the regions where the two components dominate.
In this section we discuss the main implications of these results on the build-up history of the center of the Fornax cluster.
4.1 What about the origin of the bridge-like stellar stream in the halo region between NGC 1399 and NGC 1387?
Stellar streams of comparable low surface brightness and extension as detected in the outskirts of NGC 1399 are also observed in the halo of several galaxies. Results by the pilot survey of tidal streams published by Martínez-Delgado et al. (2010), as well as those detected around galaxies in the SDSS DR7 archive by Miskolczi et al. (2011) suggest that several morphologies exist for such a faint stellar structures, like great circles, spikes, very long tails or also mixed type of streams. The morphology and stellar population of the stellar streams is strictly related to which kind of gravitational interaction make them and the nature of the galaxies involved in it. As discussed by Duc et al. (2015), the material expelled from a galaxy, which is interacting with a companion massive enough to perturb it, produces a tidal tail having similar age and metallicity (i.e. colors) to those measured in the parent galaxy. On the other hand, when a low mass galaxy is disrupting in the halo of a massive object it produce a tidal stream, made of material different from that in the massive galaxy. The system of NGC 2698/99 in the ATLAS3D sample is an example of a tidal interaction producing tails, which also shows a luminous bridge of stars between the two galaxies (see Fig. 21 in Duc et al., 2015, paper).
As mentioned in Sec. 3, the stellar bridge-like structure detected between NGC 1399 and NGC 1387 could be the sign of an ongoing interaction between the two galaxies. The deep images taken at VST show that NGC 1387 has asymmetric isophotes at low surface brightness levels ( mag arcsec-2), which appear more elongated towards the west side. These features are quite evident in the color map, where the galaxy shows a red arc-like structure on this side (see bottom panel of Fig. 7). The projected distribution of the blue GCs by Bassino et al. (2006) also shows a bridge between NGC 1387 and NGC 1399, that is, very recently, confirmed by D’Abrusco et al. (2016) on the VST data. These features match very well in space and size the bridge of stellar streams detected in the light distribution.
Bassino et al. (2006) claimed that the observed stream of the blue GCs might be caused by a tidal stripping from the outer envelope of NGC 1387 by NGC 1399. This idea was supported by the low number of the blue GCs around NGC 1387 with respect to that of red GCs. According to this scenario, the east side of NGC 1387’s envelope is stripped away by NGC 1399 and creates the stellar bridge observed between the two galaxies. The red arc on the west side of the galaxy is the surviving part of that envelope. A hint in favour of this hypothesis comes from the comparison between the average colors measured in the stellar bridge and in the halo of NGC 1387. We found that the average color in the middle region of the stellar bridge is only mag bluer than the average colors in the arc on the west side of NGC 1387, where mag (see Fig. 8). Taking into account the uncertainties on the color estimates at these level of surface brightness (see Fig. 10), the values derived above are all consistent. Anyway, the color difference between the surviving red part and the blue stripped part might mean a difference in their origin. Kinematics and numerical simulations will shed light on the interaction between these two galaxies.
4.2 Which kind of physical structure is the outer exponential component in NGC 1399?
By looking at the light profiles derived for NGC 1399, out to about 192 kpc from the center, it resembles those typically observed for disk galaxies, having a very bright central component and an outer exponential one (see Fig. 3). In this case, NGC 1399 would be a giant S0-like galaxy with a very faint and diffuse face-on disk (, see Fig. 4), never known in literature. In order to prove such an hypothesis it is necessary to gather observational and dynamical characteristics for this structure and check if they are consistent with a stellar disk. To do this, we used the photometry presented in this work and the published kinematical data. By the best fit of the light profile in the band, the exponential component has a central surface brightness mag arcsec-2 ( mag arcsec-2 in the band) and a scale length arcsec ( kpc). By comparing these values with the typical ones obtained for a large sample of disk galaxies from SDSS data, in the plane, they are located along the slope of the constant disk luminosity but in the void region of very low surface brightness galaxies and with a very large disk, (see Fig. 1 in van der Kruit & Freeman, 2011, and reference therein). In particular, disk galaxies with a mass comparable to that of NGC 1399, i.e. , have an average scale length of kpc, and the central surface brightness in the band is the range mag arcsec-2. Thus, the ”disk” in NGC 1399 would be one magnitude fainter and ten times more extended than any other observed disk in the local universe.
The photometry alone is not enough to exclude the ”disk” nature for this component, because we need to prove that such a very faint and enormous disk should be dynamically stable. According to Toomre’s criterion (Toomre, 1964), the stability of a galactic disk depends on the stellar velocity dispersion , the epicyclic frequency and the local surface density , where the parameter . The most extended stellar kinematics for NGC 1399 reaches a distance of arcsec ( kpc) (Saglia et al., 2000), thus it does not map the regions of the exponential component. At these large radii, the kinematics is traced by GCs and planetary nebulae (PNe), out to arcmin (Schuberth et al., 2010; McNeil et al., 2010), thus almost out to the region of the break. The kinematics of red and blue GCs are distinct. The kinematics of the red GCs is consistent with that of the stars in the inner regions of NGC 1399, while blue GCs are more erratic, showing a higher velocity dispersion ( km/s) than the red GCs (Schuberth et al., 2008, 2010). Schuberth et al. (2008) analyzed the GCs kinematics and their irregularities out to 35 arcmin: they found an increase of the velocity dispersion of the blue GCs beyond 20 arcmin. The maximum rotation velocity of stars was about 40 km/s inside 9.4 kpc, while those for blue GCs is about 110 km/s at kpc. Therefore, the blue GCs are the only traces of the kinematics in the region of the exponential component. Assuming as average value of the rotation velocity km/s (corrected for inclination) and as velocity dispersion km/s for the blue GCs, we estimate the parameter at the break radius arcmin ( kpc), where the exponential component starts to dominate the light, and at the last measured point in the surface brightness profiles arcmin ( kpc). The local surface density is derived by the surface brightness profile at these radii by using a mass-to-light ratio at arcmin and at arcmin. These are derived by using the total mass given by the GCs dynamics (see Fig.19 in Schuberth et al., 2008) and the total luminosity integrated at the same radii from the VST band profile. Given that, we find and , thus over the whole extension of the exponential component. This analysis allows us to conclude that such a faint and large exponential component cannot be a dynamically-supported disk. Therefore, we associate the light of inner component to the bright cluster member NGC 1399 and the extended outer component to its stellar halo. The system galaxy plus halo has a total magnitude in the band of 8.57 mag (see Sec. 3), therefore it has total luminosity L⊙. According to the M/L ratio at 192 kpc estimated above, we found that this system has a total mass M M⊙.
4.3 What is the vision from other dynamical tracers in the halo region?
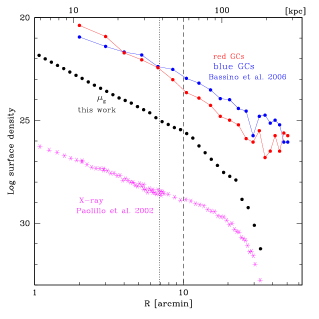
The large-scale study of the GCs in NGC 1399 published by Dirsch et al. (2003) and Bassino et al. (2006) provide the color and spatial distribution up to the projected distance of 52 arcmin. They found that the blue GCs dominate in the outer regions and their radial distribution show a slope change at arcmin, while the red GCs have a single power law profile on the entire range of radii (see Fig. 13). The radial distribution of the red GCs follows the slope of the surface brightness out to the break radius, while the blue GCs do not seem to match the steep light profile for , being shallower.
The X-ray halo of NGC 1399 extends out to about 90 kpc and it is very asymmetric; Paolillo et al. (2002) noted the presence of several components: the ’galactic’ halo extends out to arcmin and is offset toward the west with respect to the optical galaxy centroid, while on larger scales the ’cluster’ halo is elongated in the opposite direction. The transition between the ’galactic’ and ’cluster’ X-ray density profile occurs at arcmin, which is consistent with the value where the blue GCs radial distribution starts to dominate over the red GC component, and it is a few arc minutes smaller than the break radius identified in the light distribution (see Fig. 13).
As a conclusion of the cross-analysis with different tracers we find that there is a ”transition” region (very close in radius) where the light distribution, the blue GCs and the X-ray density profile show a different slope with respect to the inner regions (see Fig. 13). In correspondence of this region the kinematics of blue GCs is different from that of the red GCs, which is consistent with that of the stars in the inner regions, while the analysis of the X-ray emitting gas supports the presence of different dynamical components. Moreover, as pointed out in Sec. 3, the 2D density distributions of stars, blue GCs and X-ray consistently show an asymmetry on the west side, toward the nearby early-type galaxy NGC 1387.
The above results confirm those derived by Hilker et al. (1999) that adopted a similar approach. By comparing the light distribution in NGC 1399, down to about 24 mag arcsec-2 in the V band, with the surface density of GCs and X-ray, and with the surface brightness of dE/dS0 galaxies, they found that the profile slopes of the blue GCs population, X-ray and the cD halo light are very similar in extension and slope. As suggested by Hilker et al. (1999), the agreement in the above properties might suggest that these components share a common history.
4.4 What do theoretical studies on the halo formation predict for the shape of the light profile?
According to Cooper et al. (2013), the break radius in the total stellar mass density sets the transition region in the galaxy halo between the stars formed in situ to those captured from accretion events. The shape of the light profile for could be indicative of which kind of accretion mechanism shaped the galaxy halo in the past. As discussed by Deason et al. (2013), when plotted in logarithmic scale, some outer light profiles are steeper, named as ”broken”, in contrast to others that show an ”excess of light” at large radii. The broken profiles are generally associated to short and more recent accretion, possibly unmixed as they trace the orbit of the accretion, while the shallower profiles could result from minor merging events taking place over long timescales, showing a larger degree of mixing. To produce such a kind of broken profile, simulations found that the accreted material from satellites has similar apocenters or, alternatively, it results from the accretion of a massive satellite (Deason et al., 2013). As investigated by Deason et al. (2013), the Milky Way also shows a broken profile of its stellar halo, and a break is detected at about 20-30 kpc from the center. On the other hand, no break is detected in the halo profile of M31. The kinematics can discriminate between the two cases, since if a massive satellite was accreted, the metal-rich population of the accreted stars shows a peak in the velocity dispersion at .
In the case of NGC 1399, the light profile deviates from a smooth Sersic profile, with , for arcmin, showing a steeper exponential profile with a scale length arcmin ( kpc, see right panel of Fig. 3). Similar to NGC 1399, also the BCGs studied by Seigar et al. (2007) have a stellar halo with an exponential light profile. Differently from NGC 1399, the light profile of M87 is shallower with increasing radius and it was reasonably well-fitted by either a single Sersic law or a double (Janowiecki et al., 2010). As found from Bender et al. (2015), also the light distribution of the cD galaxy NGC 6166 in Abell 2199 is well fitted by a single Sersic law with a high value of the exponent (), therefore it appears shallower towards outer regions. According to the theoretical predictions, the differences in the halo profiles can reflect a different assembly history of this component in the BCGs. In NGC 1399, as discussed above, the regions after the break radius are purely explored with any kinematical tracers. The only information is close to the break radius and indicates that a peak in the velocity dispersion is observed in the metal-poor blue GCs (Schuberth et al., 2008), but this is not enough to draw any conclusion on this point.
Therefore, based only on the new deep photometry, we might address some points useful for the interpretation in the context of the stellar halo formation scenarios, which are not conclusive and need to be confirmed by a kinematical analysis.
First, one should take into account that the exponential stellar halo in NGC 1399 is the dominant component almost everywhere outside the and it contributes to about the 60% of the total light. Thus, it might be reasonably to think that the material forming this component could be stripped by a massive satellite, during a close passage around NGC 1399. Previous observational studies on NGC 1399 strongly suggests that the core of the Fornax cluster underwent merging events, which led to the accretion of the majority of blue GCs (Schuberth et al., 2010). If any kind of gravitational interaction happened in a recent epoch, we should found signs of it, in the form of tidal tails or streams, in the light distribution. Therefore, the frequency and the spatial distributions of such a features are strong constraints on the timescale and orbits of the accretion event, respectively.
Differently from the Virgo cluster, the deep images of the core of the Fornax cluster do not reveal bright and extended structures of this type, except for the red tail detected at arcmin and the faint streams towards NGC 1387 (see Sec. 3, Fig. 7). This remains valid even considering that the Virgo cluster is about 3 Mpc closer, thus the faint structure in the light distribution detected in the Fornax cluster would have an absolute magnitude of only mag brighter. On the other hand, at the same faint level of surface brightness, around the giant bright galaxies M49, M86 and M87 several tidal tails are detected, some of them very extended, up to 100 kpc (Mihos et al., 2005; Rudick et al., 2010; Janowiecki et al., 2010; Longobardi et al., 2015; Capaccioli et al., 2015). This observational fact might suggest that we are tracing two different epochs of the halo assembly in the two clusters: the Fornax cluster could be in a more dynamically evolved phase (Grillmair et al., 1994; Jordan et al., 2007), where most of the gravitational interactions between galaxies have already taken place and streams and tails are already dispersed into the intracluster medium or/and are below the observable surface brightness level.
4.5 Stellar halo mass fraction in NGC 1399: observations versus theoretical predictions
By fitting the light profile, we found that exists a physical break radius in the total light distribution at arcmin ( kpc) that sets the transition region between the bright central galaxy and the outer exponential halo, and that the stellar halo contributes for 60% of the total light of the galaxy (Sec. 3.5).
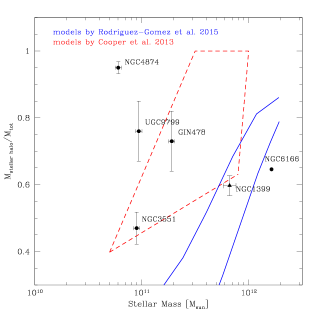
In order to estimate the stellar mass fraction of the halo for NGC 1399, we need to account for the stellar mass-to-light ratio value for both the central galaxy and the halo. The color profiles shown in Fig. 10 suggest that the stellar halo (for arcmin) has color similar to those measured in the central galaxy, thus we can assume a similar stellar M/L for both components. According to an average , from the stellar population synthesis model (Vazdekis et al., 2012; Ricciardelli et al., 2012), using a Kroupa IMF, M/L. Therefore, the total stellar mass of the whole system, galaxy plus halo, is M M⊙, while the stellar mass in the halo is M M⊙. The stellar mass fraction is the same we found for the light, which is . As shown in Fig. 14, this value is comparable with those derived for other BCGs with total stellar mass similar to NGC 1399, which varies from 0.47 to 0.9 for the galaxies in the sample studied by Seigar et al. (2007), and it is about 0.65 for the bright BCG NGC6166 (Bender et al., 2015).
The observed halo mass fraction for NGC 1399 and for other published data are compared with the predictions from numerical simulations by Cooper et al. (2013), for galaxies with a dark halo virial mass within the range , and from the Illustris hydrodynamic cosmological simulations by Rodriguez-Gomez et al. (2015). According to the dynamical models performed by Schuberth et al. (2010), the virial mass for NGC 1399 is in the range . On average, taking into account the uncertainties in M/L estimate, the stellar mass fraction derived for the halo of NGC 1399 fully agrees with those predicted by the Illustris simulations, while it is at the lower limits of those by Cooper et al. (2013). The stellar mass fractions of the halos in the less luminous BCGs studied by Seigar et al. (2007) are more consistent with simulations, except for NGC 4874, where deviations could be due to a wrong estimate of the M/L ratio and/or of the halo stellar mass fraction. On the other hand, the brightest galaxy of the selected sample, NGC 6166, is far from the theoretical predictions: this could be due to an unexplored regions in the simulations, since Fig.12 in Cooper et al. (2013) shows that there are no values for an halo stellar mass larger than M⊙. We noticed that the region of the stellar halo mass fraction larger 0.8 seems devoid of observed stellar halos. The same effect seems to be also present in the same diagram obtained by Trujillo & Fliri (2015) (see Fig.12 of that paper), where the stellar mass fractions derived for less massive galaxies (in the range ) occupy the bottom half part of the region given by theoretical predictions. In both cases, this could be to an incomplete sample. Anyway, this aspect needs to be further investigated on both observational and theoretical side.
Assuming that the stellar halo has been formed by accretion then we find consistency with simulations. This means that 60% of the total light we measured in the core of the Fornax cluster for kpc is formed via multiple accretion events. According to Cooper et al. (2013), the stellar mass of accreted satellites for halos of the most massive galaxies (i.e. ) varies in the range M⊙. While the lower limit of this interval is consistent with the typical mass for ultra compact dwarf galaxies (Chilingarian et al., 2011), the upper limit is that for a brighter and larger object. This might suggest that the halo of NGC 1399 has also gone through a major merging event. Given the absence of any tidal tail in the deep VST images, the epoch of this strong interaction goes back to an early formation epoch. For comparison, the total stellar mass of NGC 1387, which is interacting with NGC 1399 (see Sec. 4.1), is about M⊙, assuming a M/L similar to that derived for NGC 1399, or even higher considering that NGC 1387 has on average redder colors than NGC 1399 (Iodice et al. in preparations).
The Illustris hydrodynamic cosmological simulations by Rodriguez-Gomez et al. (2015) also predict a transition radius at which the halo component starts to dominate over the stars formed in-situ. Such a radius is a function of the total mass of the galaxy, ranging from effective radii for medium-sized galaxies ( M⊙) to a fraction of the effective radius for very massive galaxies ( M⊙). For NGC 1399, the total stellar mass is M M⊙ and the break radius in term of effective radius of the light distribution is (see Sec. 3.2). Such a value is comparable with the predictions from Illustris simulations on the break radius, which varies from for the most massive galaxies (stellar masses M⊙) to for galaxies with stellar mass of M⊙.
4.6 Halo vs ICL
The presence of ICL in nearby clusters was established by several works in the recent years (see Zibetti, 2008, as review). As mentioned in the Sec. 1, the extended stellar halo in BCGs and the intracluster stellar component overlap and, therefore, it is hard to separate each contribution by deep photometry alone. Surface photometry indicates that the ICL surface brightness is detected in the range between to mag arcsec-2 in band, and it declines more steeply than the light profile of the galaxies in the cluster. The contribution of the ICL to the total light of most clusters is about (Gonzalez et al., 2005; Zibetti et al., 2005). On average, this component is more elongated than the BCG and the major axes of BGCs and the ICL are almost aligned ( degrees), even if higher degrees of misalignments are also measured in some cases. The deep imaging of the Virgo cluster shows that other than the numerous thin ICL streams, part of this component is in a more diffuse form, locked in the extended halo around M87, traced up to 150 kpc (Mihos, 2015).
For NGC 1399, the deep VST photometry allows us to map the surface brightness levels typical for the ICL contribution. The azimuthally averaged surface brightness profile derived in this work shows a steeper exponential decline for mag arcsec-2 (i.e. mag arcsec-2 since ) and it reaches a mag arcsec-2 at kpc from the analyz (see Fig. 3). As discussed in detail in the previous sections, this component is the stellar halo around NGC 1399, which is very extended and contributes to about 60% of the total light. We may suppose that part of this huge amount of light comes from the contribution of the ICL, which could vary from 10% to 30% as was estimated in other cluster of galaxies (Gonzalez et al., 2005; Zibetti et al., 2005).
A hint for extra-light is detected from the light profiles extracted at several P.A.s, in the regions between galaxies on the west side (see Sec. 3 and Fig. 9), in the range of surface brightnesses mag arcsec-2 and for arcmin. At fainter level of surface brightnesses, the stellar bridge between NGC 1399 and NGC 1387 is about mag arcsec-2 brighter than the average value of the diffuse component ( mag arcsec-2, see Fig. 8). As found in other BCGs (Gonzalez et al., 2005; Zibetti et al., 2005), the ellipticity and P.A. profiles of the stellar envelope show that it is flatter with respect to the inner galaxy light and both are misaligned by about 10 degrees (see Fig. 4).
However, photometry alone does not allow us to separate the gravitationally bound part of NGC 1399’s very extended stellar halo from that of the intracluster light. There is a hint from the kinematics of the GCs for a higher velocity dispersion of the blue population at large radii of about 20 arcmin (Schuberth et al., 2010), but this point needs further confirmation with new data. Therefore, at this stage, no definitive conclusion can be drawn and kinematical studies are crucial to disentangle the bound and unbound components in the stellar halo of NGC 1399.
5 Summary
In conclusion, the most important and first results of the Fornax Deep Survey with VST can be summarised as follows:
-
1.
deep photometry allowed us to detect the faint stellar counterpart of the blue GCs stream in the intracluster region on the west side of NGC 1399 and towards NGC 1387. By analyzing the integrated colors of this feature, we claim that it could be explained by the ongoing interaction between the two galaxies, where the outer envelope of NGC 1387 on its east side is stripped away;
-
2.
in the core of the Fornax cluster a very extended envelope surrounding the luminous galaxy NGC 1399 is present. This component, which is well fitted by an exponential law, comprises 60% of the total integrated light out to 192 kpc, included the ICL fraction;
-
3.
The surface brightness profile of NGC 1399 shows a physical break radius in the total light distribution at arcmin ( kpc), i.e. , that sets the transition region between the bright central galaxy and the stellar halo. Such a value is comparable with the predictions from Illustris simulations on the break radius for galaxies in the range of stellar masses M⊙;
-
4.
comparing with the numerical simulations of stellar halo formation for the most massive BCGs (i.e. ), we found that the observed stellar halo mass fraction is consistent with a halo formed through the multiple accretion of progenitors having stellar masses in the range M⊙. This might suggest that the halo of NGC 1399 has also went through a major merging event.
-
5.
The absence of a significant number of luminous stellar streams and tidal tails between the galaxies in the core of the Fornax cluster suggests that the epoch of this strong interaction goes back to an early formation epoch. Thus, the extended stellar halo around NGC 1399 is characterised by a more diffuse and well-mixed component, including the ICL, with respect to that of M87 or M49 in the Virgo cluster (Mihos et al., 2005; Capaccioli et al., 2015). This is an indication that the Fornax cluster could be in a more dynamically evolved phase than the Virgo cluster.
References
- Arnaboldi et al. (2012) Arnaboldi, M. and Ventimiglia, G. and Iodice, E. et al., 2012, A&A, 545, 37
- Bassino et al. (2006) Bassino, L. P. and Faifer, F. R. and Forte et al., 2006, A&A, 451, 789
- Bender et al. (2015) Bender, R. and Kormendy, J. and Cornell, M. E. and Fisher, D. B., 2015, ApJ, 807, 56
- Bernstein et al. (2002) Bernstein, R. A. and Freedman, W. L. and Madore, B. F., 2002, ApJ, 571, 85
- Cantiello et al. (2015) Cantiello, M. and Capaccioli, M. and Napolitano, N. et al. 2015, A&A, 576, 14
- Capaccioli et al. (2015) Capaccioli, M. and Spavone, M. and Grado, et al. 2015, A&A, in press
- Caon et al. (1993) Caon, N. and Capaccioli, M. and D’Onofrio, M. 1993, MNRAS, 265, 1013
- Caon et al. (1994) Caon, N. and Capaccioli, M. and D’Onofrio, M. 1994, A&AS, 106, 199
- Chilingarian et al. (2011) Chilingarian, I. V. and Mieske, S. and Hilker, M. et al. 2011, MNRAS, 412, 1627
- Coccato et al. (2013) Coccato, L. and Arnaboldi, M. and Gerhard, O. 2013, MNRAS, 436, 1322
- Cooper et al. (2013) Cooper, A. P. and D’Souza, R. and Kauffmann et al. 2013, MNRAS, 434, 3348
- Cooper et al. (2015a) Cooper, A. P. and Parry, O. H. and Lowing, B. et al. 2015, MNRAS, 454, 3185
- Cooper et al. (2015b) Cooper, A. P. and Gao, L. and Guo, Q. et al. 2015, MNRAS, 451, 2703
- Cui et al. (2014) Cui, W. and Murante, G. and Monaco, P. et al. 2014, MNRAS, 437, 816
- D’Abrusco et al. (2016) D’Abrusco, R. and Cantiello, M. and Paolillo et al. 2016, ApJ, submitted
- De Lucia & Blaizot (2007) De Lucia, G. and Blaizot, J. 2007, MNRAS, 375, 2
- Deason et al. (2013) Deason, A. J. and Belokurov, V. and Evans et al. 2013, ApJ, 763, 113
- Dirsch et al. (2003) Dirsch, B. and Richtler, T. and Geisler, et al. 2003, AJ, 125, 1908
- Donzelli et al. (2011) Donzelli, C. J. and Muriel, H. and Madrid, J. P., 2011, ApJS, 195, 15
- Drinkwater et al. (2001) Drinkwater, M. J. and Gregg, M. D. and Colless, M. 2001, ApJ, 548, L139
- Duc et al. (2015) Duc, P.-A. and Cuillandre, J.-C. and Karabal, E. et al. 2015, MNRAS, 446, 120
- Durrell et al. (2014) Durrell, P. R. and Côté, P. and Peng, E. W. et al. 2014, ApJ, 794, 103
- Ferguson et al. (1989) Ferguson, H. C. 1989, AJ, 98, 367
- Ferrarese et al. (2012) Ferrarese, L. and Côté, P. and Cuillandre et al. 2012, ApJS, 200, 4
- Forbes et al. (2012) Forbes, D. A. and Ponman, T. and O’Sullivan, E. 2012, MNRAS, 425, 66
- Fukugita et al. (1996) Fukugita, M. and Ichikawa, T. and Gunn, J. E. et al. 1996, AJ, 111, 1748
- Gerhard et al. (2001) Gerhard, O. and Kronawitter, A. and Saglia, R. P. 2001, AJ, 121, 1936
- Gonzalez et al. (2005) Gonzalez, A. H. and Zabludoff, A. I. and Zaritsky, D. 2005, ApJ, 618, 195
- Grillmair et al. (1994) Grillmair, C. J. and Freeman, K. C. and Bicknell, G. V. et al. 1994, ApJ, 422, L9
- Hilker et al. (1999) Hilker, M. and Infante, L. and Richtler, T. 1999, A&AS, 138, 55
- Hilker et al. (2015) Hilker, M. and Barbosa, C. E. and Richtler, T. et al. 2015, IAU Symposium, 309, 221
- Janowiecki et al. (2010) Janowiecki, S. and Mihos, J. C. and Harding et al. 2010, ApJ, 715, 972
- Jordan et al. (2007) Jordán, A. and Blakeslee, J. P. and Côté, P. et al. 2007, ApJS, 169, 213
- Kormendy et al. (2009) Kormendy, J. and Fisher, D. B. and Cornell et al. 2009, ApJS, 182, 216
- Kuijken (2011) Kuijken, K., 2011, The Messenger, vol. 146, pag. 8-11
- Iodice et al. (2014) Iodice, E. and Arnaboldi, M. and Rejkuba, et al. 2014, A&A, 567, 86
- Longobardi et al. (2015a) Longobardi, A. and Arnaboldi, M. and Gerhard, O. and Hanuschik, R. 2015, A&A, 579, 135
- Longobardi et al. (2015) Longobardi, A. and Arnaboldi, M. and Gerhard et al. 2015, A&A, 579, L3
- Martínez-Delgado et al. (2010) Martínez-Delgado, D. and Gabany, R. J. and Crawford et al. 2010, AJ, 140, 962
- McNeil et al. (2010) McNeil, E. K. and Arnaboldi, M. and Freeman et al., 2010, A&A, 518, A44
- Mihos et al. (2005) Mihos, J. C. and Harding, P. and Feldmeier et al. 2005, ApJ, 631, L41
- Mihos (2015) Mihos, J. C. 2015, arXiv-1510.01929
- Mieske et al. (2004) Miskolczi, A. and Bomans, D. J. and Dettmar, R.-J. 2011, A&A, 536, 66
- Miskolczi et al. (2011) Mieske, S. and Hilker, M. and Infante, L. 2004, A&A, 418, 445
- Muñoz et al. (2015) Muñoz, R. P. and Eigenthaler, P. and Puzia, T. H. et al. 2015, ApJ, 813, L15
- Napolitano et al. (2002) Napolitano, N. R. and Arnaboldi, M. and Capaccioli, M. 2002, A&A, 383, 791
- Napolitano et al. (2009) Napolitano, N. R. and Romanowsky, A. J. and Coccato, L. et al. 2009, MNRAS, 393, 329
- Napolitano et al. (2011) Napolitano, N. R. and Romanowsky, A. J. and Capaccioli, M. et al. 2011, MNRAS, 411, 2035
- Napolitano et al. (2014) Napolitano, N. R. and Pota, V. and Romanowsky, A. J. et al. 2014, MNRAS, 439, 659
- Paolillo et al. (2002) Paolillo, M. and Fabbiano, G. and Peres, G. and Kim, D.-W. 2002, ApJ, 565, 883
- Peletier et al. (1990) Peletier, R. F. and Davies, R. L. and Illingworth, G. D. et al. 1990, AJ, 100, 1091
- Pillepich et al. (2015) Pillepich, A. and Madau, P. and Mayer, L. 2015, ApJ, 799, 184
- Pillepich et al. (2014) Pillepich, A. and Vogelsberger, M. and Deason, A. et al. 2014, MNRAS, 444, 237
- Pohlen & Trujillo (2006) Pohlen, M. and Trujillo, I. 2006, A&A, 454, 759
- Pota et al. (2013) Pota, V. and Forbes, D. A. and Romanowsky, A. J. et al. 2013, MNRAS, 428, 389
- Pota et al. (2015) Pota, V. and Romanowsky, A. J. and Brodie, J. P. et al. 2015, MNRAS, 450, 3345
- Puchwein et al. (2010) Puchwein, E. and Springel, V. and Sijacki, D. and Dolag, K. 2010, MNRAS, 406, 936
- Puzia et al. (2014) Puzia, T. H. and Paolillo, M. and Goudfrooij, P. et al. 2014, ApJ, 786, 78
- Ricciardelli et al. (2012) Ricciardelli, E. and Vazdekis, A. and Cenarro, A. J. et al. 2012, MNRAS, 424, 172
- Rodriguez-Gomez et al. (2015) Rodriguez-Gomez, V. and Pillepich, A. and Sales, L. V. et al. 2015, MNRAS, in press, arXiv-1511.08804
- Roediger et al. (2011) Roediger, J. C. and Courteau, S. and MacArthur, L. A. and McDonald, M. 2011, MNRAS, 416, 1996
- Romanowsky et al. (2009) Romanowsky, A. J. and Strader, J. and Spitler, L. R. et al. 2009, AJ, 137, 4956
- Rudick et al. (2010) Rudick, C. S. and Mihos, J. C. and Harding, P. et al. 2010, ApJ, 720, 569
- Saglia et al. (2000) Saglia, R. P. and Kronawitter, A. and Gerhard, O. and Bender, R. 2000, AJ, 119, 153
- Schipani (2012) Schipani, P. and Noethe, L. and Arcidiacono, C. et al. 2012, Journal of the Optical Society of America A, Vol.29, p.1359
- Schlegel et al. (1998) Schlegel, D. J. and Finkbeiner, D. P. and Davis, M. 1998, ApJ, 500, 525
- Schombert (1986) Schombert, J. M. 1986, ApJS, 60, 603
- Schuberth et al. (2008) Schuberth, Y. and Richtler, T. and Bassino, L. and Hilker, M. 2008, A&A, 447, 9
- Schuberth et al. (2010) Schuberth, Y. and Richtler, T. and Hilker, M. et al. 2010, A&A, 513, 52
- Seigar et al. (2007) Seigar, M. S. and Graham, A. W. and Jerjen, H. 2007, MNRAS, 378, 1575
- Sersic (1963) Sérsic, J. L. 1963, Boletin de la Asociacion Argentina de Astronomia La Plata Argentina, Vol. 6, p.41
- Tonry et al. (2001) Tonry, J. L. and Dressler, A. and Blakeslee, J. P. et al. 2001, ApJ, 546, 681
- Toomre (1964) Toomre, A. 1964, ApJ, 139, 1217
- Trujillo & Fliri (2015) Trujillo, I. and Fliri, J. 2015, arXiv-1510.04696
- van der Kruit & Freeman (2011) van der Kruit, P. C. and Freeman, K. C., 2011, ARA&A, 49, 301
- van Dokkum et al. (2014) van Dokkum, P. G. and Abraham, R. and Merritt, A. 2014, ApJ, 782, L24
- Vazdekis et al. (2012) Vazdekis, A. and Ricciardelli, E. and Cenarro, A. J. et al. 2012, MNRAS, 424,157
- Voggel et al. (2015) Voggel, K. and Hilker, M. and Richtler, T. 2015, A&A, in press, arXiv-1510.05010
- Wu et al. (2014) Wu, X. and Gerhard, O. and Naab, T. et al. 2014, MNRAS, 438, 2701
- Zibetti et al. (2005) Zibetti, S. and White, S. D. M. and Schneider, D. P. et al. 2005, MNRAS, 358, 949
- Zibetti (2008) Zibetti, S. 2008, IAU Symposium Vol.244, p.176, arXiv-0709.0659