Commissioning of a dual-phase xenon TPC at Nikhef
Abstract
A dual-phase xenon time-projection chamber was built at Nikhef in Amsterdam as a direct dark matter detection R&D facility. In this paper, the setup is presented and the first results from a calibration with a 22Na gamma-ray source are presented. The results show an average light yield of () photoelectrons/ (calculated to and zero field) and an electron lifetime of . The best energy resolution is ()% at an energy of . This was achieved using a combination of the scintillation and the ionization signals. A photomultiplier tube gain calibration technique, based on the electroluminescence signals occurring from isolated electrons, is presented and its advantages and limitations are discussed.
keywords:
xenon , TPC , gain calibration , PMT , single electron , dark matter1 Introduction
There is considerable evidence from astrophysical observations that there is more mass in the universe than can be accounted for with only standard model particles [1, 2, 3]. The most popular theory that explains this discrepancy introduces dark matter particles called WIMPs [4]. In past years, the sensitivity of direct dark matter search experiments has increased by orders of magnitude, lead by the development of large dual-phase xenon time-projection chambers (TPCs) [5, 6, 7]. In the context of dark matter research, a small-scale liquid xenon TPC, called XAMS (Xenon Amsterdam), has been designed, built and commissioned at Nikhef in Amsterdam. The setup described in this work is similar to small-scale dual-phase xenon setups, such as described in [8, 9, 10].
Dual-phase TPCs detect a particle interaction using two distinct signals. The first comes from excitations and recombined electron-ion pairs. Bound excited states of two atoms form, and subsequent decays of these excitons causes scintillation light that is detected by photomultiplier tubes (PMTs). This signal is called S1. The second signal is caused by ionization electrons that do not recombine with ions. These are drifted up by an electric field and extracted by a second, stronger field into the gas phase, where secondary scintillation (S2) is caused and measured by the same PMTs. The drift time between these signals is proportional to the interaction depth (z). In addition to this, the ratio of S2/S1 provides a powerful discrimination between electronic and nuclear recoils. In large-scale TPCs, such as XENON100 [11] and LUX [12], the light distribution of the S2 in the PMTs gives the coordinates in the plane of the PMTs, so that a three-dimensional resolution is obtained.
This article has the following structure. In section 2, the XAMS setup and the TPC are introduced. Section 3 discusses the data processing and gives results based on the main S1- and S2-signals. In section 4, S2-signals from single electrons are analyzed and a PMT calibration technique based on these signals is presented. In section 5, we give a summary of the analyses in these sections.
2 The XAMS setup
2.1 The XAMS TPC
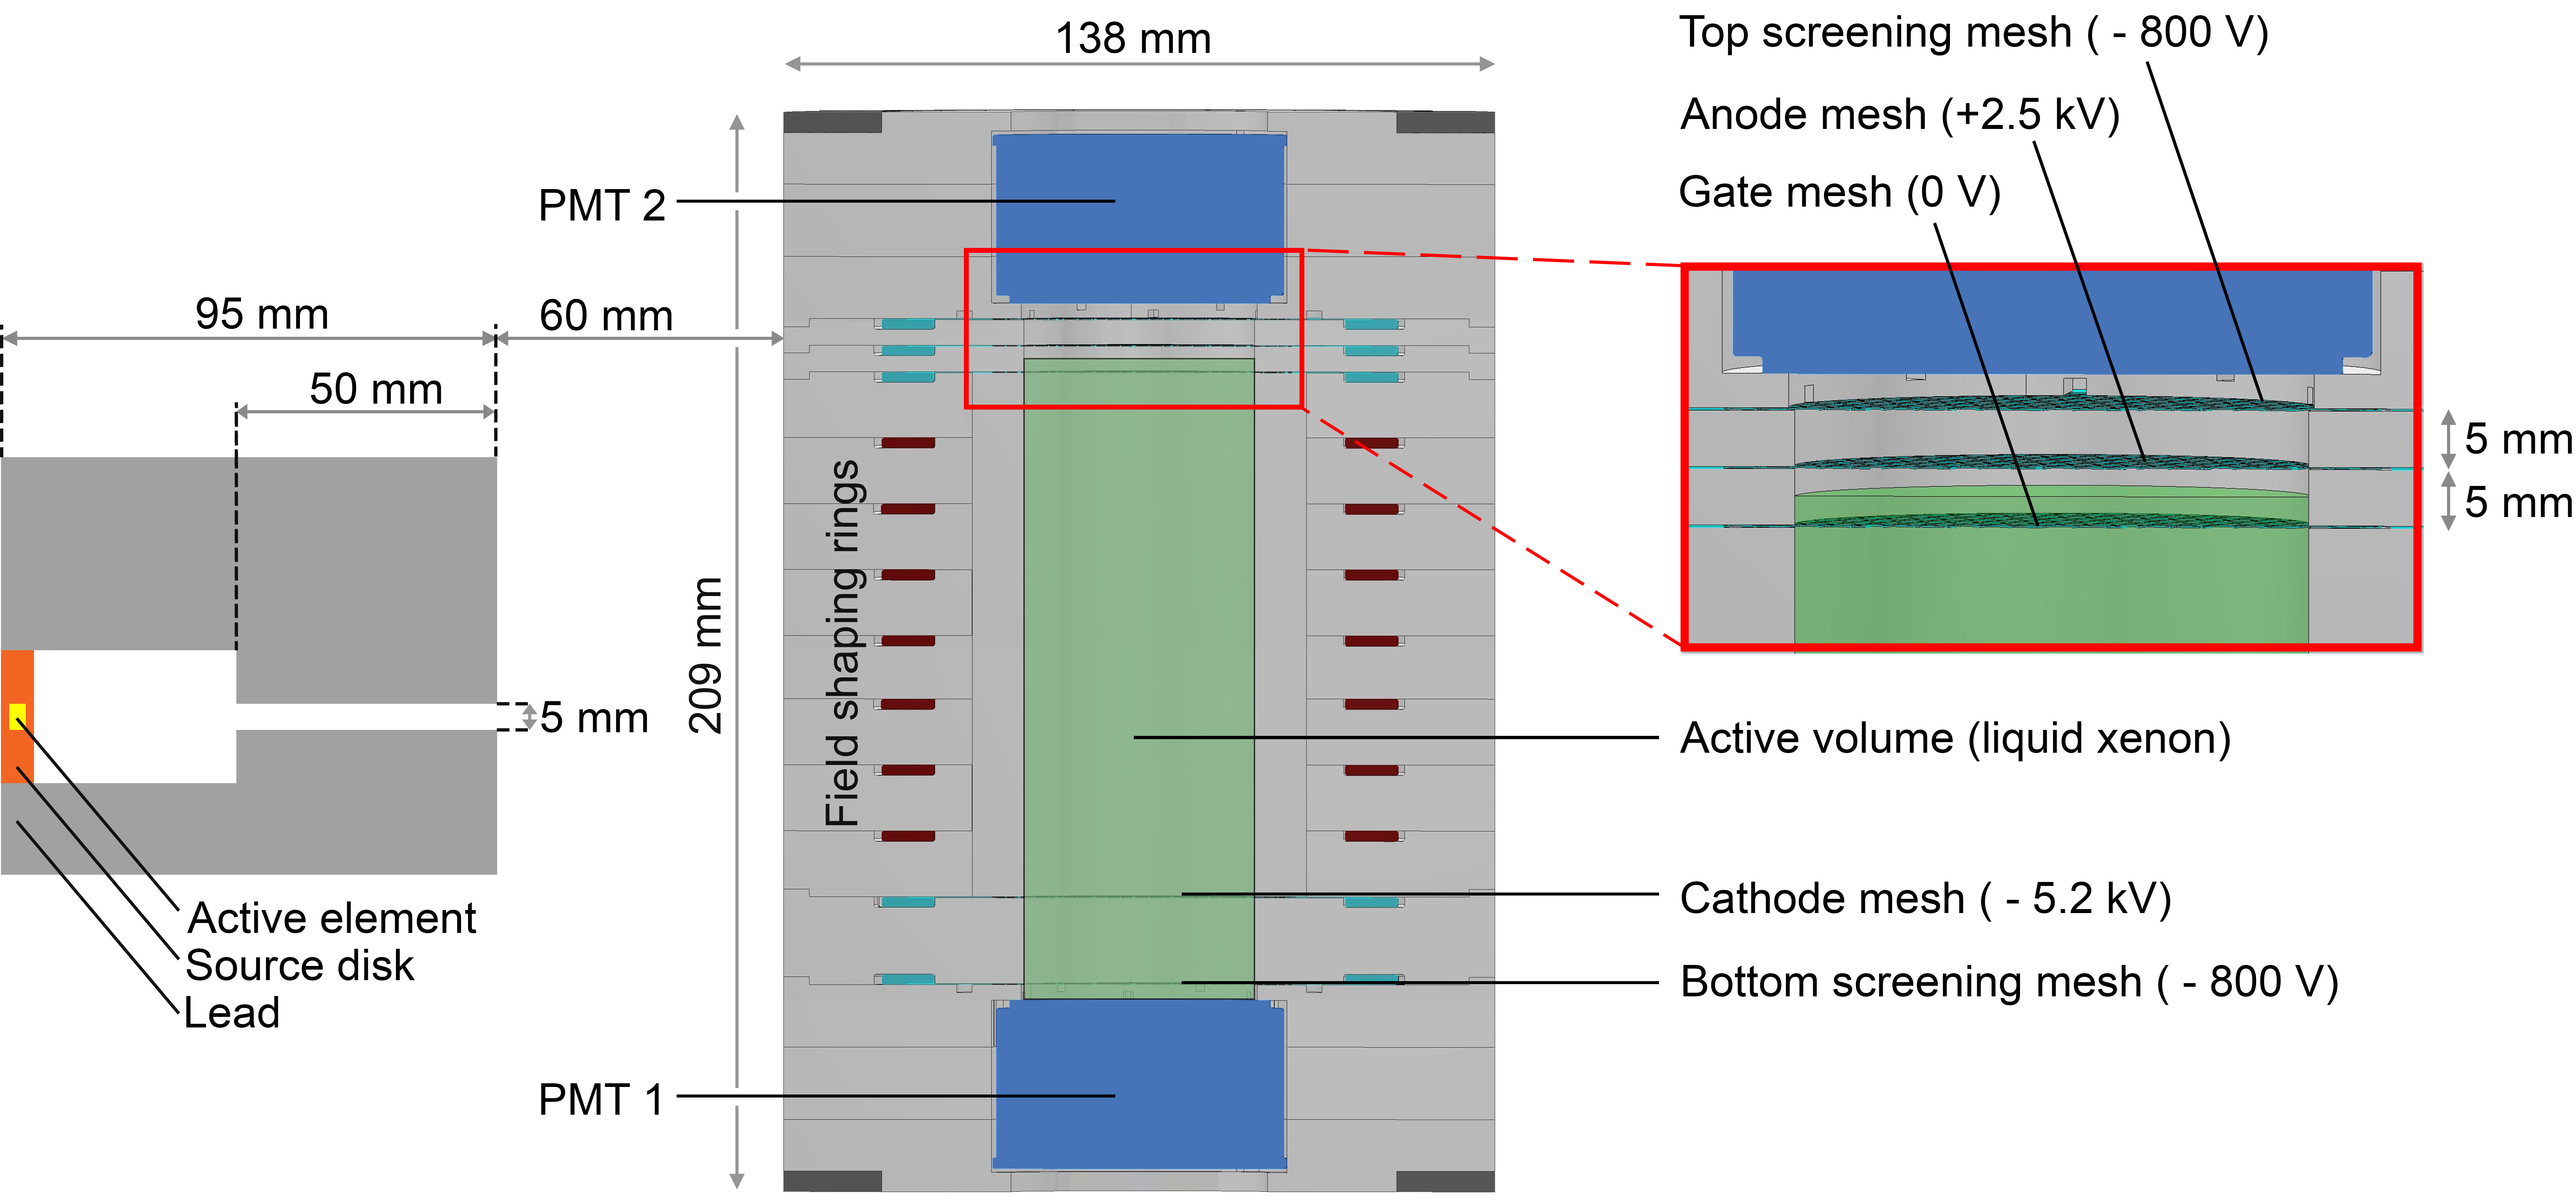
The XAMS TPC features a cylindrically-shaped active volume of , which holds of liquid xenon at a temperature of , as shown in Fig. 1 [13, 14, 15]. There are two PMTs, one at the top and one at the bottom, that view the active volume and record the S1- and the S2-signals. Five meshes define the electric field: the drift field of is between the cathode and the grounded gate mesh, whereas the extraction field is between the gate and anode mesh, where a voltage of is applied over . The meshes were made by chemical etching of a thick stainless steel sheet. They have a square pattern with a pitch of and a wire thickness of , giving a head-on optical transparency of %. The drift field is shaped by a series of copper rings connected to a resistor chain between the cathode and gate mesh. Two additional meshes shield the PMTs from the TPC’s electric fields. The distance between the cathode and the gate mesh, which defines the maximum drift length, is .
The PMTs are circular two-inch UV-sensitive low-temperature Hamamatsu PMTs of type R6041-406. The low transit-time spread of in combination with the fast 500 MSa/s digitizer type CAEN V1730D makes XAMS well-suited for fast-timing applications, such as pulse-shape discrimination studies.
2.2 Cryogenics and gas system
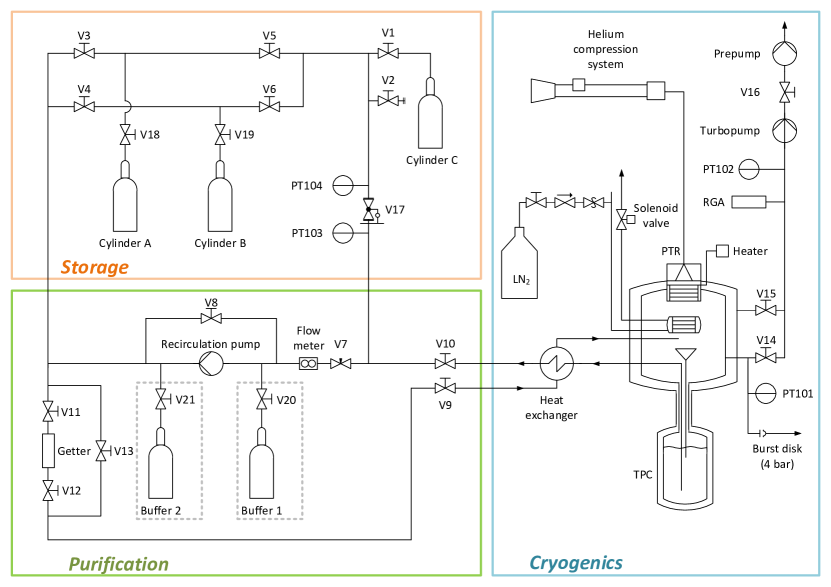
For the successful operation of a dual-phase xenon TPC, a cryogenic cooling system is required in combination with a purification and storage system. The piping and instrumentation diagram of the XAMS setup is included in A.
The cryogenic part of the system consists of double-walled stainless steel vessels. The insulation volume between the vessels is continuously pumped out during normal operation, and pressures of are reached. In addition, aluminum-coated Mylar foil is inserted in the insulation volume to shield from radiative heat transfer. The cooling is provided by an Iwatani PDC08 pulse tube refrigerator (PTR), which gives an effective cooling power of at . We apply the cooling to a copper cold finger, where the xenon condenses and droplets fall down into a funnel leading into the TPC. A resistive heating band wrapped around the cold finger enables us to regulate the temperature. The current to the heating band is controlled by a PID controller based on the temperature read by a Pt100 temperature sensor at the cold finger.
A cooling power failure may result in a rising pressure in the TPC. A burst valve with a pressure limit of is connected to the inner volume to ensure no higher pressure can build. We provide emergency cooling with a pressurized liquid nitrogen dewar, with the flow controlled by a solenoid valve that is switched by a pressure sensor. In addition, text and email warning messages are automatically sent in case of abnormal behavior of the system. The pressure sensor, the solenoid valve and the computer that sends the messages are powered by an uninterruptible power supply.
The required xenon purity level is achieved by continuous circulation through a high-temperature SAES MonoTorr PS3-MT3-R-2 getter with a maximum flow rate of 5 standard liters per minute. We use a heat exchanger at the cryogenic part of the system to achieve this flow rate with only modest cooling power. In section 3.2, we show that we achieved an impurity level of (oxygen-equivalent).
We use an EMP MX-808ST-S diaphragm pump to establish the flow in the recirculation circuit. The flow is controlled with a needle valve and measured with a thermal mass flow meter. For the measurements described in this work, no buffer volumes were installed at the inlet or outlet of the pump, causing oscillatory behavior in the flow. The presumed effect on the measurements is described in detail in section 3.3.1. We recognize this as a design flaw, which we have since adjusted by installing gas bottles as buffer volumes in the system.
The liquid level in the TPC is monitored by a stainless steel cylindrical capacitive level meter, which is read out by a custom-programmed Arduino board. The flow control of the needle valve is used to set the liquid level, as we noticed that the liquid level decreased as we increased the flow rate. We assume that this effect is due to a changing thermal equilibrium in the heat exchanger, where a nonnegligible amount of liquid xenon is kept.
The total xenon content in the XAMS setup is roughly , most of which surrounds the PTFE structure of the TPC. The time required to fill the TPC, limited by the maximum cooling power of the PTR, is roughly . We perform recuperation by immersing gas bottles into liquid nitrogen dewars and allowing gas to deposit on the walls of the cylinder. The time for a full recuperation is roughly .
2.3 Trigger and DAQ
We use a 22Na gamma source with an activity of to perform our studies. The source is mounted in a lead collimator (see Fig. 1) on the outside of the insulation vacuum vessel, with an opening angle of such that the beam has a width of at the closest edge of the active volume. The direction of the beam is horizontal, giving lateral irradiation of the TPC. We change the z-position of the collimator by varying the height of the platform on which the collimator is mounted. To reach the active volume, the gamma rays have to cross the walls of the inner and outer vessels, a thin layer of liquid xenon and the PTFE holding structure of the TPC, so that the total material traversed is of stainless steel, of liquid xenon and of PTFE, respectively.
22Na decays by positron emission (branching ratio 90.4%) or electron capture (branching ratio 9.6%). The decay is almost always followed by the emission of a gamma ray from its 22Ne daughter. In the case of positron emission, two additional back-to-back gamma rays of are produced from positron annihilation. By using thallium-doped sodium iodide (NaI(Tl)) as a coincidence detector that measures one of the gamma rays, the other gamma ray going directly toward the active volume is tagged. This increases the fraction of events where all the energy is absorbed, since the number of events where gamma rays enter the active volume after Compton scattering on the material surrounding the detector is reduced.
The trigger is based on a threefold coincidence of the two PMTs in the TPC and the external NaI(Tl) detector. If the trigger condition is satisfied, all three channels are digitized by a CAEN V1730D digitizer board. This board has 8 channels that are digitized with a time resolution of and a voltage resolution of bits, distributed over a dynamic range of . We choose an event window of : more than twice as long as the maximum drift time of . We place the trigger position in the middle, such that an (accidental) trigger on an S2-signal will always contain the S1 in the same window. A cut in post-processing ensures that there was a true coincidence with the S1 and the external NaI(Tl) (and not, for example, a coincidence with the S2-signal and an uncorrelated interaction in the NaI(Tl) crystal).
The simple coincidence means that all three channels must exceed the threshold at the same time; no coincidence window was used. The time offset between the two PMTs in the TPC is negligible, however, the start of the peak of the NaI(Tl) detector output was shown to occur later than that of the PMT signals. The trigger condition was therefore satisfied only if both PMT signals were still above threshold at this time after the peak amplitude. In the case of high energy recoils, the pulses are sufficiently large and this causes no problems. However, for low energy recoils we observe a low trigger efficiency, which we identify in the comparison to Monte Carlo simulation in section 3.3.2 at energies below .
3 Data reduction and results
3.1 Peak finding, clustering, identification
The data of each event consist of the waveforms of the two PMTs with a duration of (Fig. 2). The data processor, which is the same software developed for XENON1T [16], analyzes the waveforms in each individual PMT channel by looking for significant excursions above the baseline. These are called hits. In XENON100 and XENON1T, zero-length encoding is used: the data consists of small chunks of data around a significant excursion from the baseline, so that the baseline is suppressed and the data volume is reduced [17]. In order to be compatible with this structure, we apply a software zero-length encoding with a very low threshold. The hitfinder threshold is dynamically determined as times the standard deviation of the noise in the first 40 digitizer samples () of the zero-length encoded chunk containing the hits. The hits from both channels are then clustered into peaks based on the gap between the edges of the hits: if this exceeds , the hits are clustered into separate peaks. The area and the width of the peak are computed based on the summed gain-corrected waveform properties. The width metric uses the range containing % of the peak area with % on either side. The peak position is defined as the amplitude-weighted mean time of the samples in the peak.
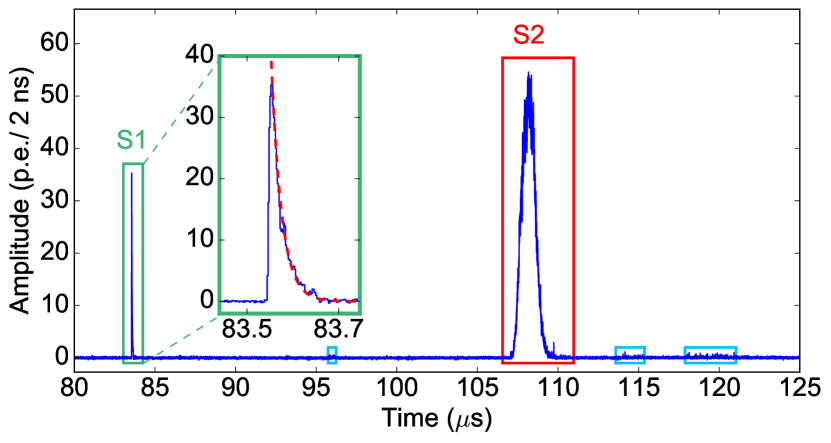
As seen in Fig. 2, the main signals are the S1- (highly peaked signal at ) and the S2-signal (the broad signal at ). After the S2, some peaks with low area and high width are found (shown in blue boxes). These signals are due to secondary emission of electrons caused by photo-ionization of S2 UV photons and drifted up to produce an additional, much smaller S2. These signals will be discussed in section 4. All peaks are classified as either ‘S1’, ‘S2’ or ‘other’ based on their width and area.
3.2 S1 and S2 corrections
After data processing, the following selection criteria are applied to the events. First of all, only events with a single S1 and S2 are kept. This cut rejects pileup events, double scatter events (which cause two S2-signals), or events where no S2 is generated (for instance, where the interaction occurs below the cathode mesh). Events where the S1 is not in coincidence (difference of peak center position less than ) with a signal in the NaI(Tl)-crystal are also cut. In addition, the energy deposition in the NaI(Tl)-crystal is required to be less than , so that the triggers on gamma ray are cut. We impose no lower bound other than the trigger threshold on the NaI(Tl) energy, so that we keep events where the Compton scattered in the NaI(Tl)-crystal. A summary of all the cuts and the number of events surviving each successive cut is given in table 1. The fraction of events surviving all cuts for the analysis presented here is 47.0%. Most events cut are due to multiple S1s or S2s.
| Cut | Events | Fraction |
|---|---|---|
| No cuts | 100.0% | |
| At least one S1 | 95.2% | |
| Only one S1 | 77.1% | |
| At least one S2 | 73.5% | |
| Only one S2 | 53.3% | |
| Coincidence S1 and NaI(Tl) | 48.7% | |
| NaI(Tl) | 47.0% | |
| Total | 101 381 | 47.0% |
For both the sum-signals of the S1- and the S2-signals, the area of the peak is proportional to the recoil energy. However, the response to a mono-energetic energy deposition is not uniform throughout the TPC, requiring spatial corrections. Since the XAMS TPC has only two PMTs, the position in the x,y-plane cannot be determined, but the z-coordinate is calculated based on the drift time that is defined by the difference of the weighted mean times of the S2 and the S1.
A z-dependent scale factor is applied to the S1-signal to eliminate differences in light detection efficiency (LDE). The amount of light detected by the PMTs for different interaction positions depends on optical properties of the TPC, such as the reflection properties of the walls of the TPC, optical transparency of the meshes and reflection on the liquid-to-gas interface. The secondary scintillation light of the S2-signal is always produced in the small region between the liquid-to-gas interface, so no z-correction for LDE has to be applied. However, the number of electrons that create the S2-signal decreases with increasing drift time due to attachment of electrons to impurities in the xenon. Assuming electrons are produced at the interaction position, the number of electrons left after a drift time can be calculated with
| (1) |
where is the electron lifetime, which is an indirect measure of the purity of the xenon.
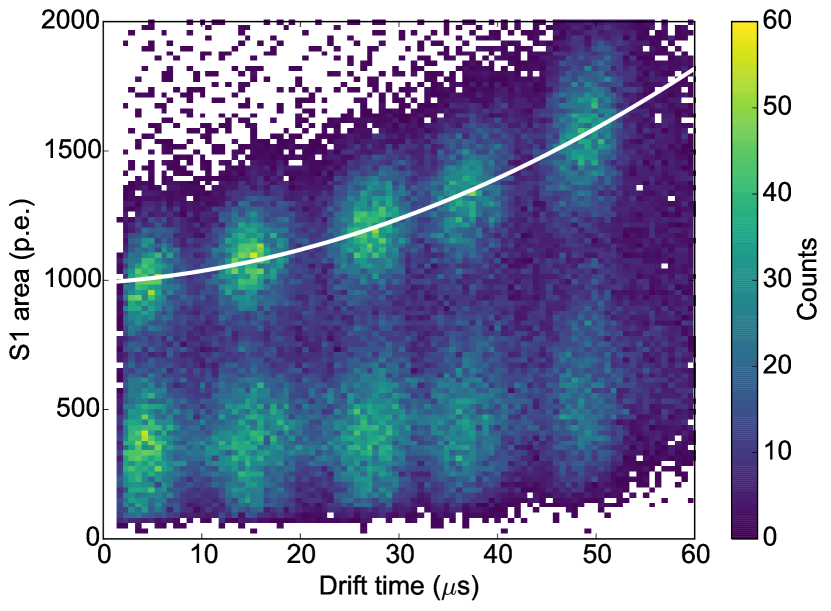
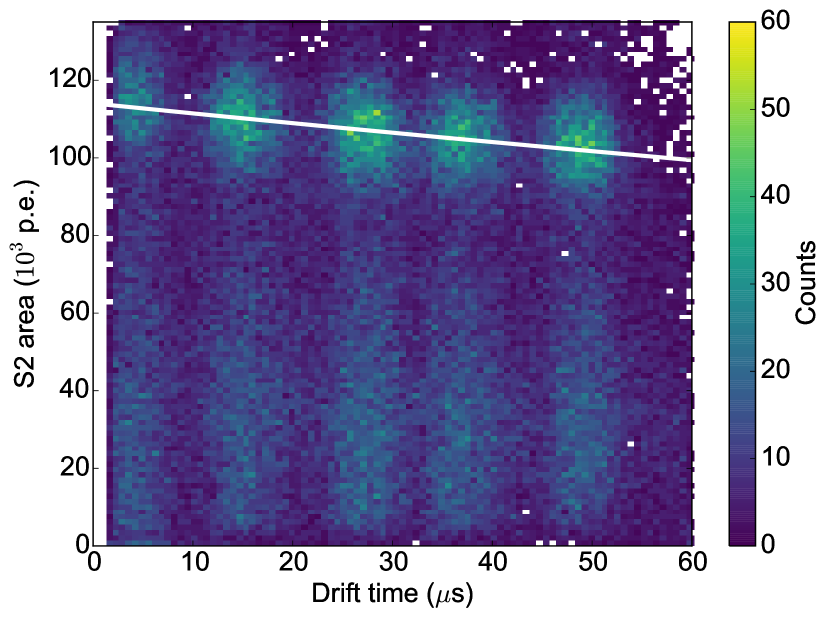
Five datasets were taken with a different z-position of the collimator. Fig. 3 shows the area of the sum-signal of the S1- and the S2-signal for all datasets, each containing a prominent peak at high energy and a broad shoulder for lower energies. The former is attributed to the full absorption peak (mostly due to photoelectric absorption, or multiple scatter events where the S2s are too close together to be separated), whereas the latter is due to Compton-scatter events.
For the S1, uncertainties on optical parameters limit the use of a detailed LDE model. We therefore use a data-driven approach, modeling the correction function as a second degree polynomial. We determine this function in two steps. We first fit a Gaussian function to the photopeak for several slices in drift time, and then fit the photopeak position as a function of drift time with a second-degree polynomial. This polynomial function, shown by the white line in Fig. 3(a), provides the correction factor for the LDE. The average value of the fit function, which gives the volume-averaged light yield for gamma rays, is p.e., or () p.e./keV in this configuration. This is equivalent to () p.e./keV at zero field and using data from NEST [18], which is comparable to TPCs like XENON100 (4.3 p.e./keV) and LUX (8.8 p.e./keV) [11, 19]. An overall increase of LDE with drift time is found, since most of the scintillation light is detected by the bottom PMT.
For the S2, the correction function is expected to be an exponential (see equation 1). The electron lifetime as determined from the fit is , similar to the average lifetime of during the year-long science run of XENON100 [20], and was achieved in only of continuous purification with the high-temperature getter. We observed that the electron lifetime rapidly increases in the first , but levels off after this [14]. For XAMS, this electron lifetime means that even at the maximum drift time, only 13% of the S2-signal is lost. Using the values in [21], this electron lifetime corresponds to an impurity level of (oxygen-equivalent). We kept the recirculation flow rate constant over the full duration of all measurements described here (one day).
3.3 Energy calibration
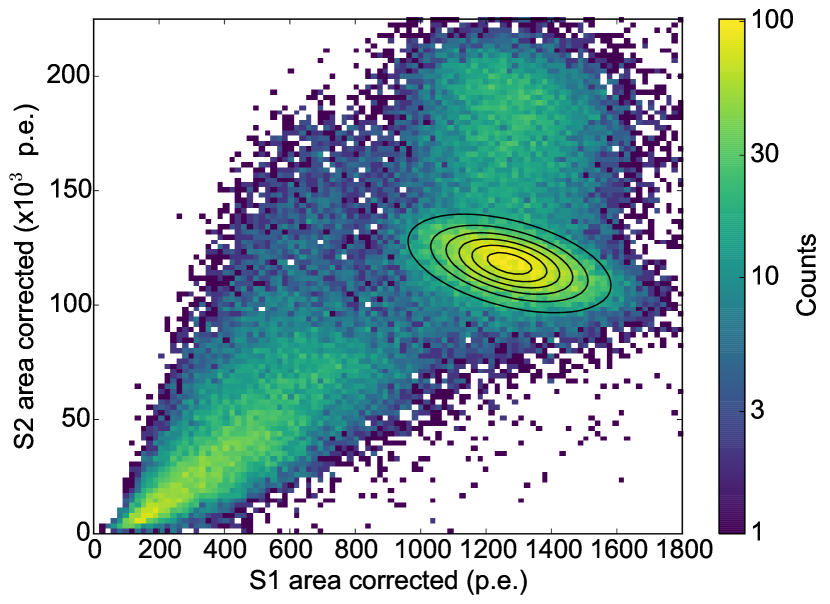
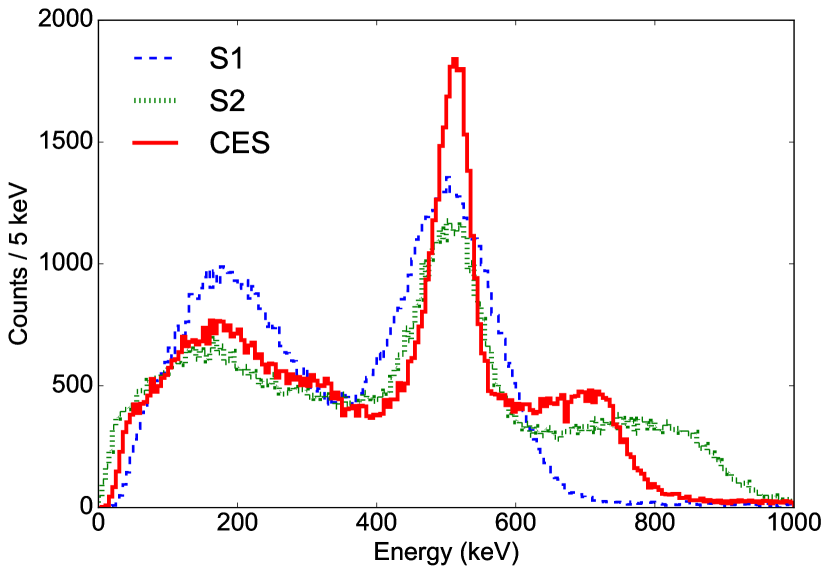
After the corrections for the S1- and the S2-signal have been applied, the absorbed energy can be determined. Both signals provide a measurement of the deposited energy, since the area of the S1-signal is proportional to the number of photons produced in the interaction and the area of the S2-signal is proportional to the number of electrons produced. The total energy deposited in these events is always identical: the ionization and scintillation signals are therefore anti-correlated. In Fig. 4(a), this anti-correlation is clearly visible as the ellipse with a downward slope. The best energy resolution is achieved by using a projection along the short axis of the ellipse, which is known as the combined energy scale (CES) [22, 23]. We use the same projection for all energies, which is a good approximation for energies greater than roughly [11]. In Fig. 4(b), the spectra obtained from the S1, the S2 and the CES are shown. The energy resolutions, as defined by for a Gaussian fit, are ()%, ()% and ()%, respectively.
3.3.1 High-S2 population
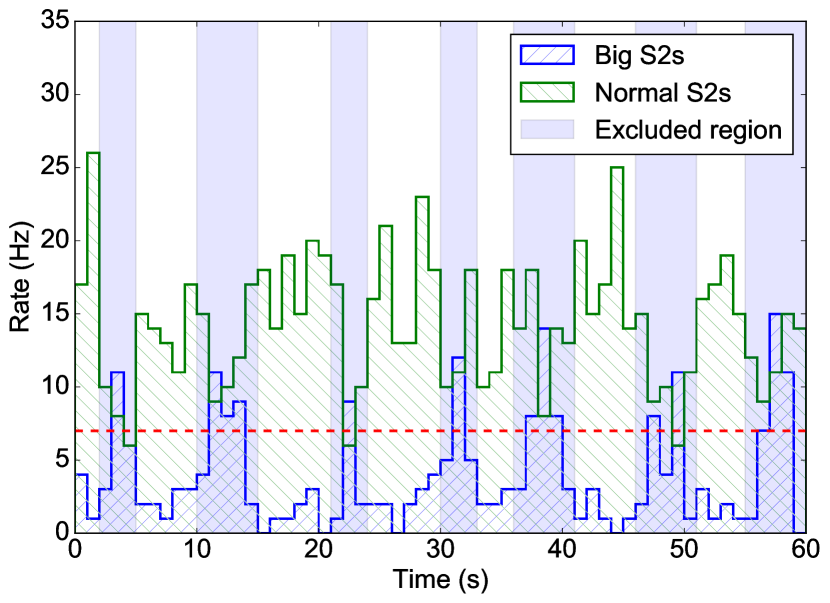
In addition to the photopeak, a second peak at the same S1-area but larger S2-area was found, see Fig. 4(a). We also find this effect for the Compton-scatter events, and throughout all datasets. The appearance of the high-S2 events is highly correlated in time, with a frequency of , i.e., roughly a period (see Fig. 6(a)).
The cause of a varying S2 size can be related to only few parameters. Since the S1-signal is unaffected, the PMT gain, cathode voltage, DAQ problems or processing errors can be excluded. Possible detector parameters changing the S2 size, but not the S1 size, are the xenon purity, the anode voltage, and the liquid level. The anode voltage was not monitored by the slow control system, but the display showed a stability of better than . Unfortunately, we cannot correlate the detector parameters monitored by the slow control to the time behavior found in the high-S2 population appearance. This is because the variables were read out only every two minutes; a decision that was taken because the readout of temperature sensors in the TPC caused noise in the PMT signals by electronic pick-up.
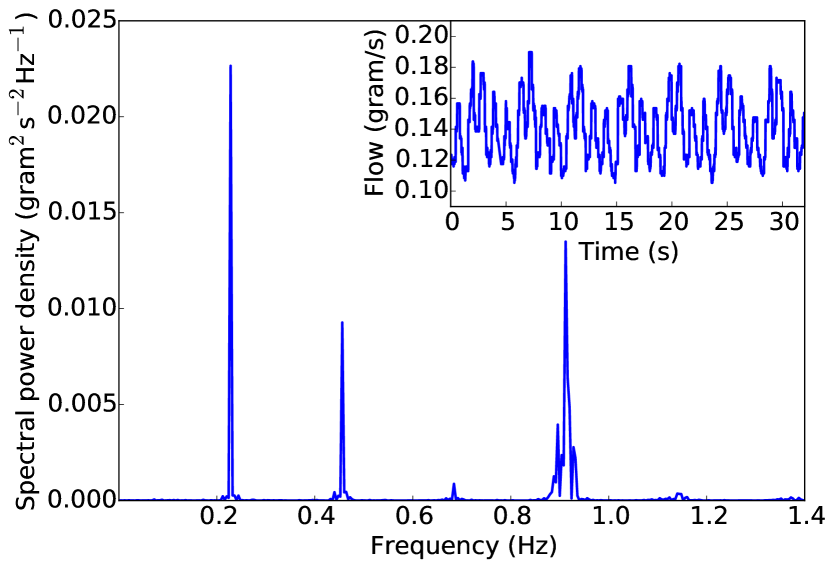
A plausible explanation found is a time-varying liquid level in the TPC. The S2 size is highly dependent on this, so that only a small change in liquid level can still give significant effects. Alternatively, there could be ripples on the liquid surface, appearing every . One of the mechanisms that could cause either a changed liquid level or ripples on the surface is related to the recirculation flow. During the measurements, we observed that the gas flow rate in the recirculation system was constantly varying. To investigate this effect further, we did a test where nitrogen gas was pumped through the system. We observed a highly periodic behavior of the flow rate, with a period depending on recirculation speed. Fig. 5 shows the flow rate for a mass flow similar to the flow used during the measurements with liquid xenon. The typical frequencies found in these tests are higher than the found in the data, but it should be noted that the systems with liquid xenon and with nitrogen gas are not equivalent, and that the frequency found in the nitrogen gas tests depends on the pressure and the recirculation flow. The reason for this oscillatory behavior is related to the absence of a buffer volume at the recirculation pump. Buffer volumes were installed, and subsequent tests showed a significant increase in the stability of the flow rate. Future measurements with liquid xenon will show if the effect is related to the instability of the flow rate.
As illustrated in Fig. 6(a), we can use a time cut to remove a large fraction of the events with a large S2-signal. Whenever more than six events with an S2 size larger than p.e. are found within one second, the events from one second before to one second after this bin are cut. This removes % of all events passing previous cuts.
3.3.2 Comparison to simulation
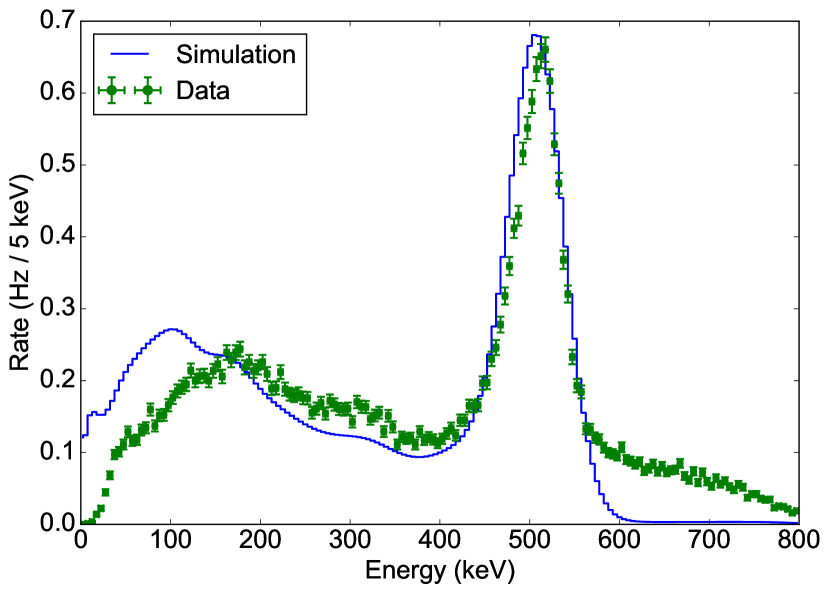
The resulting spectrum was compared to a GEANT4 [24] Monte Carlo simulation, where the energy deposition was registered when there is a simultaneous energy deposition in the NaI(Tl) crystal and the liquid xenon active volume. The result was then smeared with an energy resolution function according to
| (2) |
where is fixed by the requirement that at . The comparison is shown in Fig. 6(b), where the green points are from data and the blue line is from simulation. The data points are scaled to the total rate observed before any cuts of , which agrees well with the rate of from simulation. The contribution at S2 sizes larger than is still visible.
At energies below , the simulation predicts a higher rate than observed in measurement. This difference is due to a timing offset between the NaI(Tl) and the S1-signal, which causes a trigger on the falling edge of the S1 instead of on its peak amplitude and deteriorates the trigger efficiency for low energy recoils, as described in section 2.3.
4 Single-electron S2-signals
A distinct signal that is found in dual-phase xenon TPCs is that of S2-signals produced by single electrons [25, 26, 27]. The scintillation light of xenon, at , can liberate electrons in the TPC. In general, the electrons come from impurities in the xenon that have a low ionization potential, such as O- ions, or from exposed metallic surfaces. If these electrons are somewhere in the active volume, they will in turn drift upward and create very small S2-signals. Since the main S2-signal is the dominant source of UV photons in the TPC, it causes the large majority of single-electron peaks.
Fig. 7 shows an example of a single-electron signal found in the data. As described in section 3.1, the waveform is cut into small sections analogous to zero-length encoded data, so that the hitfinder threshold is dynamically updated based on the local noise level. The blue and green parts of the waveform show the hits that are found, when a threshold of times the standard deviation of the baseline noise is crossed (indicated by the dashed lines). The width of the signal is around , comparable to normal S2-signals.
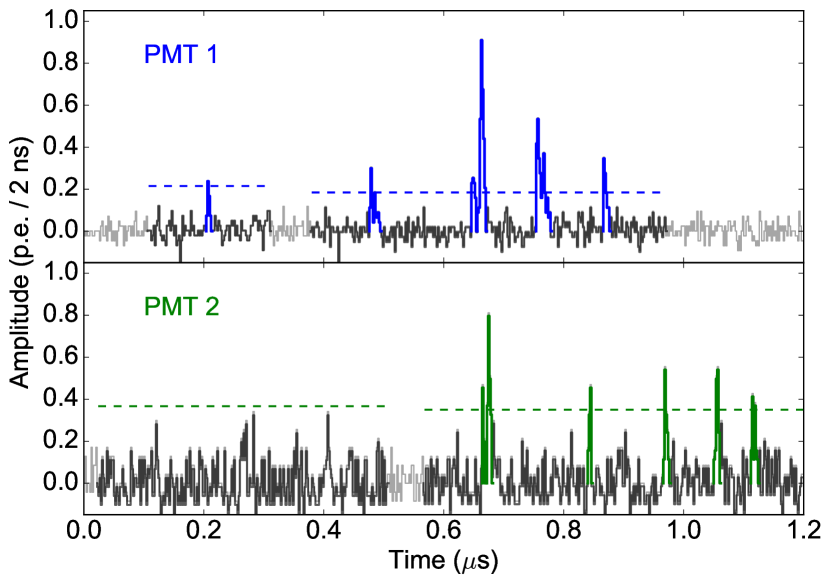
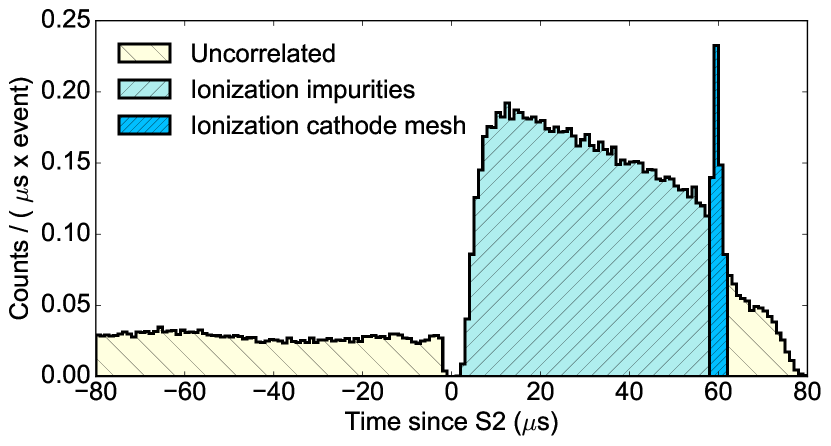
Fig. 8 shows the time distribution of the peak position relative to the position of the S2 for all candidate single-electron S2-signals, namely all peaks that are not classified as S1 or S2 and have a coincidence of both PMTs. A large fraction of the peaks occurs between (as defined by the maximum drift time). We observe a clear increase at , which is due to the S2 light impinging on the cathode mesh, where electrons are liberated relatively easily due to the low ionization potential of the iron in the stainless steel. Before the S2 ( ), as well as after the full drift length ( ), there is a nonzero contribution, which is partly due to noise hits clustered into peaks, but partly shows the same properties as the single-electron signals in the drift region. These peaks can be caused by a delayed extraction phenomenon, as discussed in [26] and [27].
Single-electron S2s can be effectively used as ‘calibration sources’: the detector response to just one electron can be probed in this way. This enables the direct determination of various parameters, such as the secondary scintillation gain. In addition, these signals can be used for a PMT gain calibration, since they consist of single-photoelectron hits.
4.1 Gain calibration
The PMT gain is defined as the average number of electrons at the anode responding to one electron emerging from the photocathode. Often PMT calibrations are done using external pulsed light sources. Although such calibration provides a direct and usually accurate gain calibration, it requires an interruption during dark matter data taking. In addition, a dedicated LED calibration system and calibration measurements are necessary. Finally, the LED calibration is usually performed at a higher wavelength than the xenon scintillation light of , because it is technically challenging to guide UV light through an optical fiber. This makes it impossible to probe effects like double-photoelectron emission, which occurs only at short wavelengths [28].
In this section, we discuss a method to use single-electron peaks for PMT gain calibration. These consist of well-separated single-photon hits and are abundant in all data, so they can be used to measure the PMT gain continuously. The LUX collaboration already uses single-electron signals as part of their gain calibration, which operates on different principles [29].
4.1.1 Hit data selection
Single-electron S2s typically have the same width as ordinary S2-signals (about wide), but consist of a small number of photoelectrons. For example, for XENON100, these signals consists of roughly 20 photoelectrons [27].
Since the hits in single-electron S2s are spread out over a relatively long duration, the PMT hits of the detected photons can be found individually (see Fig. 7). This means that the single-electron S2s provide a source of single photoelectron hits, which can be used for an in-situ gain calibration.
We apply cuts on the event, peak and hit level to select proper single-photon hits in proper single-electron signals. Events are selected by the same criteria as in section 3. For the peaks, defined as clusters of hits, we introduce the following cuts. Since single-electron S2s are primarily caused by S2 photons, only peaks that occur within after the S2 are selected. The lower bound ensures no fragments from accidentally split S2s are selected, and the upper bound cuts peaks beyond the maximum drift time. Both PMTs are required to contribute to the peak, to suppress peaks consisting of noise and dark current hits. In order to reduce contamination from common-mode noise clustering, we apply a cut on the average area of the hits in a peak: since noise hits on average have a smaller area than particle-induced PMT hits, a cluster of noise hits will have a low average area.
Finally, at the hit level, we do not consider hits with an extremely small width, indicative of noise hits rather than real PMT hits. The width parameter used here is the sum absolute deviation (SAD), given by
| (3) |
where runs over all samples in the hit, is the amplitude-weighted mean time of the hit, and denotes the area. This parameter takes continuous values greater than or equal to zero, which has the advantage of discriminating different widths even if this is at the same order as the sampling time. Typical values for a single-photoelectron hit are about for the XAMS PMTs. We cut hits with an SAD less than , which mostly consist of hits that are just one sample wide (such that exactly) or where the hit is two samples wide but the area is dominated by just one sample.
With the above selection of hits we proceed to calibrate the gain of each PMT. For gain calibration, the parameter of interest is the area of the hits (given by ), which is proportional to the number of electrons at the PMT output according to
| (4) |
where is the charge at anode, is the charge of the electron and where denotes the termination resistance of the digitizer (). Because of this relation, the area of a hit can be expressed as number of electrons equivalent area. If the hit results from one photoelectron, the average number of electrons at the output is simply , and the gain can be computed.
4.1.2 Acceptance correction
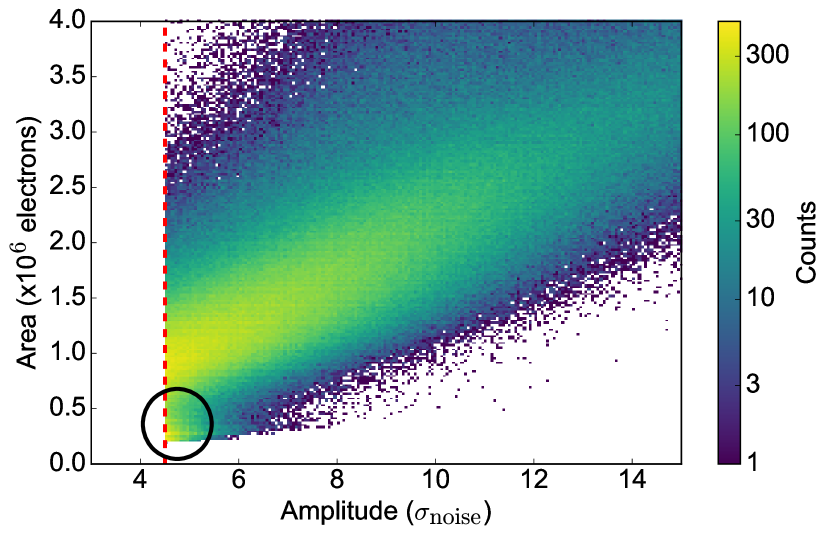
The hitfinding algorithm preferentially detects high-area hits, since these are more likely to exceed the hitfinding amplitude threshold. Fig. 9 shows the correlation between the amplitude, measured in units of , and the area of the hit. The distribution is sharply cut at , the hitfinder threshold. This was chosen to limit the contribution of noise hits, which are visible in the bottom left corner of Fig. 9.
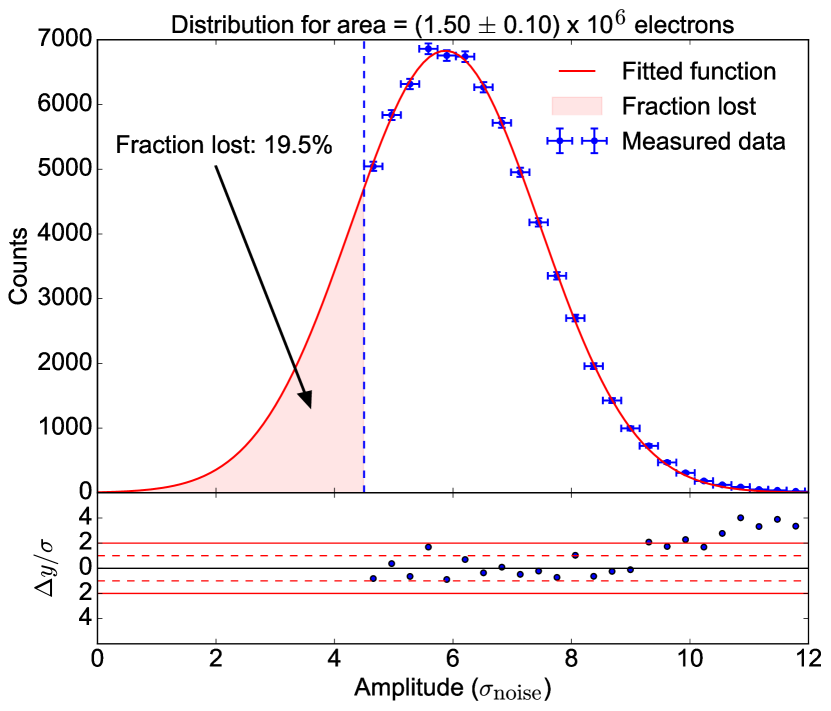
To correct for this loss of hits below the threshold, we must estimate the acceptance of the hitfinder, i.e. the fraction of photon hits found by the hitfinder, as a function of the hit area. This function can be estimated by studying the amplitude distribution for a sample of hits with similar area (equal up to a difference of electrons). This distribution is cut at the hitfinder threshold, but since it is well-described by a Gaussian distribution above the threshold, we will assume that it follows a Gaussian function also below this threshold. By evaluating the fraction of the area under the fitted distribution below the threshold, the acceptance can be calculated, as illustrated in Fig. 10.
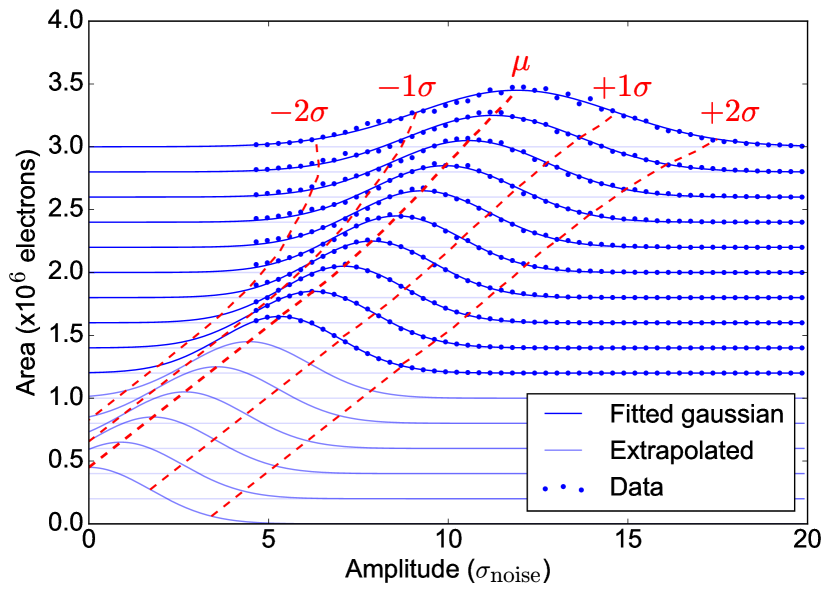
The distribution of hits and Gaussian fits are shown for all area slices in Fig. 11. For low-area hits, only a tail of the Gaussian distribution exceeds the hitfinding threshold of , making it difficult to fit the distribution. We instead infer the parameters and by extrapolation. Since the shape of PMT hits is to a good approximation independent of the area, the mean is extended linearly to zero [13]. We assume that the standard deviation is constant at low area, since this should be dominated by baseline noise on the highest bin and is therefore independent of the hit area.
With the amplitude distribution specified by and , the acceptance for every area and for different hitfinding thresholds can be computed. For a hitfinding threshold of , the acceptance as a function of peak area is
| (5) |
where is a normalized Gaussian distribution and denotes the amplitude. To correct the area spectrum, it is divided by .
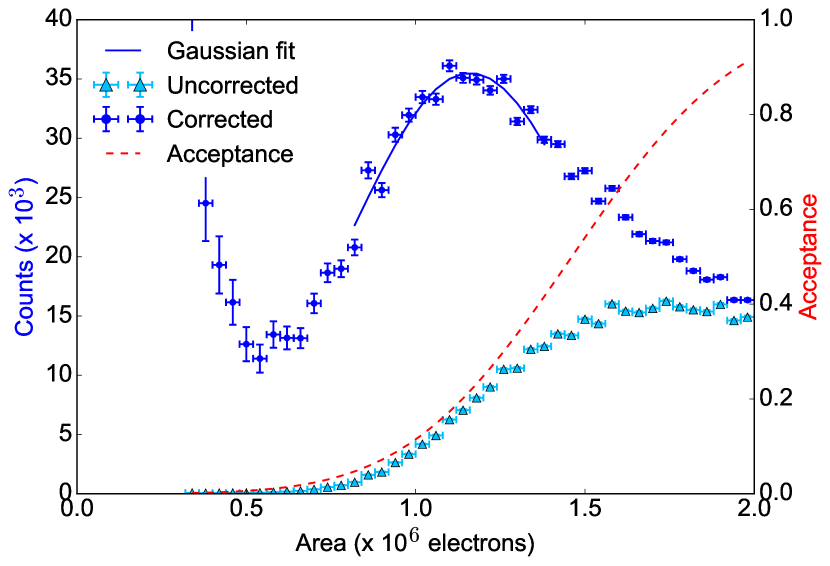
Although a hitfinder threshold that is as low as possible is desired for determining the acceptance, it is not necessarily ideal for determining the gain. This is because low-amplitude noise hits are too dominant in the area spectrum, so that the gain will be underestimated. We therefore use a higher amplitude threshold to remove any possible bias due to noise hits, which we compensate by a corresponding change in the acceptance function. In Fig. 12, the uncorrected and corrected area spectrum for a hitfinding threshold of 6.5 is shown, together with the acceptance function for this threshold. A clear peak is visible, which is fit in the area around the peak to determine the gain. The fit is limited to a part around the maximum; at low area, the noise contribution becomes dominant, while at high area the contribution from two-photoelectron hits cannot be excluded. Similar features are found in other PMT calibrations, such as in [30].
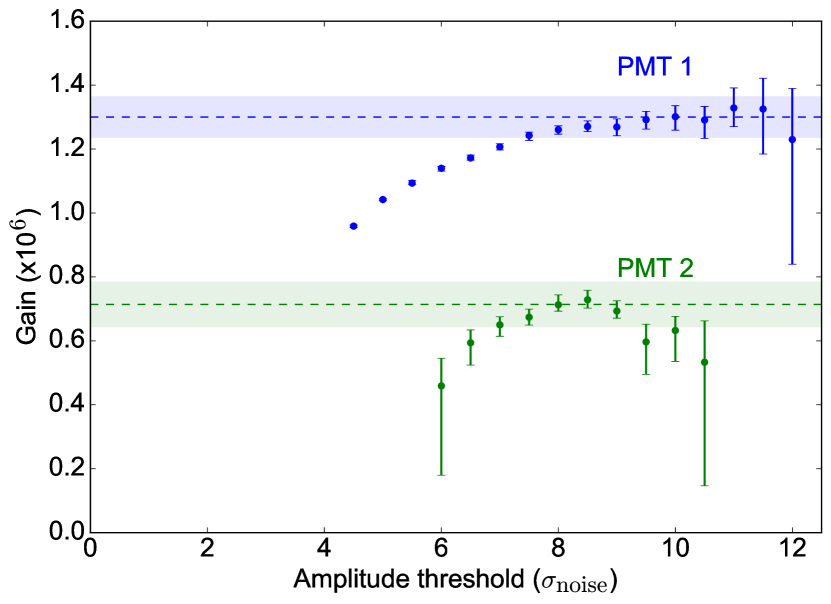
In Fig. 13, the determined gain is plotted as a function of the hitfinding threshold. For low thresholds, the noise contribution becomes too pronounced to properly fit the spectrum. For higher thresholds, the gain that is determined converges to a final value, which we infer to be the true gain of the PMT. We allow a range around this value from uncertainty on the convergence of the final points, which we estimate to be 5% for PMT 1 and 10% for PMT 2. The PMT gains found in this analysis were for PMT 1 and for PMT 2; both close to the typical gain of quoted by Hamamatsu for this type of PMT [31]. The error bars in Fig. 13 originate from systematic errors on the acceptance function, which we calculate by perturbing the fit parameters and in equation 5.
4.2 Discussion
The method used in this work relies on modeling the PMT hits. In particular, the amplitude of hits of a given area is assumed to be normally distributed. For large-area hits, this assumption can be verified since most hits are above the hitfinding threshold, and the distribution follows a Gaussian distribution to a high degree. For smaller areas, a significant part of the distribution is inaccessible and needs to be inferred from the visible part of the distribution (as in Fig. 10). Moreover, the parameters and of the distribution are extrapolated from larger areas where fits can be made (Fig. 11). The validity of the extrapolation can break down at small area, although this will not affect the gain determination if the approximation is valid sufficiently far below the average single-photoelectron hit area.
In the case of low PMT gains, the separation of noise and true PMT hits becomes a serious issue. This is the case for PMT 2 in our analysis, where at high thresholds the errors increase and we eventually fail to fit the distribution because of low statistics. Moreover, we cannot confirm if convergence is reached before this effect starts to dominate. We therefore estimate the systematic errors to be higher for PMT 2 than for PMT 1. It should be noted that these limitations becomes less important if the PMT gain is higher, so that the PMT hits are more separated from the noise.
A PMT calibration requires a source of single photoelectron hits. For single-electron S2s, a few photoelectron signals are seen in the PMT channels over a time window of typically . There is a finite probability of having two or more PMT signals clustered together into one hit, so that there is a contribution of two-photoelectron hits in the data. The importance of this effect could be different for other TPCs, as it depends on several parameters such as the transient time spread of the PMTs, the sampling time of the ADCs, the width of the S2 and the anode voltage. These effects will thus need to be studied further if this method is to be used for other TPCs.
Compared to the normal PMT calibration with LED pulsed light, there are some definite advantages to using single-electron S2s. One of these is they are usually readily available and easily identified in ordinary (energy) calibration or dark matter data; no extra dedicated calibration runs are required. This means that the drift of PMT gains can be monitored on timescales far shorter than with ordinary PMT calibration runs. A second advantage is that the response to the scintillation light is directly probed. The scintillation light of xenon has a wavelength of , but since this is technically challenging to provide for a calibration, higher wavelengths are used. For example, XENON100 uses an LED at [12]. The method described here makes it possible to study, for example, the possibility of two-photoelectron emission due to one scintillation photon at the photocathode.
5 Summary
In this work, the first data of the XAMS TPC were presented. An energy resolution of ()% was achieved at . The electron lifetime was found to be , which is sufficient for this TPC, after only 7 days of purification. An average light yield of () photoelectrons/ (recalculated to zero field and ) was found, which is comparable to TPCs like XENON100 and LUX.
A new PMT calibration method based on single-electron S2-signals was explored. Since single-electron S2-signals are very abundant in dual-phase xenon TPCs, this method of PMT calibration can give an important independent cross-check of the normal PMT calibration, with the advantage of superior time resolution and no need for dedicated PMT calibration data.
6 Acknowledgments
This work is part of the research program of the Foundation for Fundamental Research on Matter (FOM), which is part of the Netherlands Organization for Scientific Research (NWO). We gratefully acknowledge the technical support from to the mechanical, electrical and computing departments at Nikhef.
7 References
References
- [1] D. Clowe, M. Bradac, A. H. Gonzalez, M. Markevitch, S. W. Randall, et al., A direct empirical proof of the existence of dark matter, Astrophys.J. 648 (2006) L109–L113. arXiv:astro-ph/0608407, doi:10.1086/508162.
- [2] Planck Collaboration, P. A. R. Ade, N. Aghanim, C. Armitage-Caplan, M. Arnaud, M. Ashdown, F. Atrio-Barandela, J. Aumont, C. Baccigalupi, A. J. Banday, et al., Planck 2013 results. XVI. cosmological parameters, Astronomy & Astrophysics 571 (A16) (2014) 66. arXiv:1303.5076, doi:10.1051/0004-6361/201321591.
- [3] G. R. Blumenthal, S. Faber, J. R. Primack, M. J. Rees, Formation of galaxies and large scale structure with cold dark matter, Nature 311 (1984) 517–525.
- [4] G. Jungman, M. Kamionkowski, K. Griest, Supersymmetric dark matter, Physics Reports 267 (5–6) (1996) 195 – 373. doi:10.1016/0370-1573(95)00058-5.
- [5] E. Aprile, T. Doke, Liquid xenon detectors for particle physics and astrophysics, Rev. Mod. Phys. 82 (2010) 2053–2097. doi:10.1103/RevModPhys.82.2053.
-
[6]
V. Chepel, H. Araújo,
Liquid noble gas
detectors for low energy particle physics, Journal of Instrumentation 8 (04)
(2013) R04001.
URL http://stacks.iop.org/1748-0221/8/i=04/a=R04001 - [7] L. Baudis, WIMP dark matter direct-detection searches in noble gases, Physics of the Dark Universe 4 (2014) 50–59, DARK TAUP2013. doi:10.1016/j.dark.2014.07.001.
- [8] E. Aprile, et al., Proportional light in a dual-phase xenon chamber, IEEE Transactions on Nuclear Science 51 (5) (2004) 1986–1990. doi:10.1109/TNS.2004.832690.
- [9] E. Aprile, et al., Simultaneous measurement of ionization and scintillation from nuclear recoils in liquid xenon for a dark matter experiment, Phys. Rev. Lett. 97 (2006) 081302. doi:10.1103/PhysRevLett.97.081302.
- [10] J. Kwong, et al., Scintillation pulse shape discrimination in a two-phase xenon time projection chamber, Nuclear Instruments and Methods in Physics Research Section A 612 (2) (2010) 328 – 333. doi:http://dx.doi.org/10.1016/j.nima.2009.10.106.
- [11] E. Aprile, et al., The XENON100 Dark Matter Experiment, Astropart. Phys. 35 (2012) 573–590. arXiv:1107.2155, doi:10.1016/j.astropartphys.2012.01.003.
- [12] D. S. Akerib, et al., The Large Underground Xenon (LUX) Experiment, Nucl. Instrum. Meth. A704 (2013) 111–126. arXiv:1211.3788, doi:10.1016/j.nima.2012.11.135.
-
[13]
E. Hogenbirk,
Development,
commissioning and first results of XAMS: A dual-phase xenon time projection
chamber at Nikhef, Master’s thesis, Vrije Universiteit (August 2014).
URL http://www.nikhef.nl/~ehogenbi/Erik_Hogenbirk-Thesis_LR.pdf -
[14]
M. Bader,
First
light from XAMS: Electronic recoil calibration of the Netherland’s first
dual-phase xenon time projection chamber, Master’s thesis, Utrecht
University (June 2015).
URL http://dspace.library.uu.nl/handle/1874/318246?_ga=1.29915965.361842327.1462893092 -
[15]
R. Schön,
XAMS
– development of liquid xenon detector technology for dark matter searches,
Ph.D. thesis, Universiteit van Amsterdam (July 2015).
URL http://www.nikhef.nl/pub/services/biblio/theses_pdf/thesis_R_Schon.pdf -
[16]
PAX on GitHub, retrieved on July 5,
2016.
URL https://github.com/XENON1T/pax -
[17]
CAEN, Technical
Information Manual V1724 Digitizer.
URL http://www.caen.it/servlet/checkCaenManualFile?Id=10767 - [18] M. Szydagis, N. Barry, K. Kazkaz, J. Mock, D. Stolp, M. Sweany, M. Tripathi, S. Uvarov, N. Walsh, M. Woods, NEST: A Comprehensive Model for Scintillation Yield in Liquid Xenon, JINST 6 (2011) P10002. arXiv:1106.1613, doi:10.1088/1748-0221/6/10/P10002.
- [19] D. S. Akerib, et al., First results from the LUX dark matter experiment at the Sanford underground research facility, Phys. Rev. Lett. 112 (2014) 091303. doi:10.1103/PhysRevLett.112.091303.
-
[20]
E. Aprile, et al.,
Dark matter
results from 225 live days of xenon100 data, Phys. Rev. Lett. 109 (2012)
181301.
doi:10.1103/PhysRevLett.109.181301.
URL http://link.aps.org/doi/10.1103/PhysRevLett.109.181301 - [21] E. Aprile, A. E. Bolotnikov, A. I. Bolozdynya, T. Doke, Noble Gas Detectors, Wiley-VCH Verlag GmbH, 2006, pages 52–56.
- [22] T. Shutt, et al., Performance and fundamental processes at low energy in a two-phase liquid xenon dark matter detector, Nuclear Instruments and Methods in Physics Research Section A 579 (1) (2007) 451 – 453. doi:10.1016/j.nima.2007.04.104.
- [23] E. Aprile, et al., Observation of anticorrelation between scintillation and ionization for MeV gamma rays in liquid xenon, Phys. Rev. B 76 (2007) 014115. doi:10.1103/PhysRevB.76.014115.
- [24] S. Agostinelli, et al., GEANT4: A simulation toolkit, Nuclear Instruments and Methods in Physics Research Section A: Accelerators, Spectrometers, Detectors and Associated Equipment 506 (3) (2003) 250–303. doi:10.1016/S0168-9002(03)01368-8.
- [25] B. Edwards, et al., Measurement of single electron emission in two-phase xenon, Astroparticle Physics 30 (2) (2008) 54 – 57. doi:10.1016/j.astropartphys.2008.06.006.
- [26] E. Santos, et al., Single electron emission in two-phase xenon with application to the detection of coherent neutrino-nucleus scattering, Journal of High Energy Physics 2011 (12) (2011) 1–20. doi:10.1007/JHEP12(2011)115.
- [27] E. Aprile, et al., Observation and applications of single-electron charge signals in the XENON100 experiment, Journal of Physics G: Nuclear and Particle Physics 41 (3) (2014) 035201.
- [28] C. Faham, V. Gehman, A. Currie, A. Dobi, P. Sorensen, R. Gaitskell, Measurements of wavelength-dependent double photoelectron emission from single photons in VUV-sensitive photomultiplier tubes, Journal of Instrumentation 10 (09) (2015) P09010.
- [29] D. S. Akerib, et al., Improved WIMP scattering limits from the LUX experiment (2015). arXiv:1512.03506.
- [30] A. Lyashenko, for the XENON collaboration, Progress in characterization of the photomultiplier tubes for XENON1T dark matter experiment (2015). arXiv:1502.01000.
-
[31]
Hamamatsu,
Photomultiplier
tubes and assemblies, retrieved on Januari 21, 2016.
URL https://www.hamamatsu.com/resources/pdf/etd/High_energy_PMT_TPMO0007E.pdf
Appendix A Piping and instrumentation diagram