Efficient thermoelectric materials using nonmagnetic double perovskites with / band filling
Abstract
Efficient thermoelectric materials should present large Seebeck coefficient, high electrical conductivity and low thermal conductivity. An enhanced Seebeck coefficient can be obtained from materials where the Fermi level can be aligned with a large and narrow peak of the density of states, particularly when a substantial band valley degeneracy occurs. A high electrical conductivity comes as a consequence of large conductive hopping paths between the atoms of the material. Both physical quantities can be decoupled and optimized independently if their origins can be ascribed to different sets of bands. Based on these assumptions, double perovskites A2BB’O6 with filling for the B and B’ metal cations, respectively, have been considered. They provide a desirable band structure with degenerate B- / B’- bands above the Fermi level together with a low thermal conductivity. We have carried out first-principles simulations for various of these nonmagnetic double perovskites and showed that all of them present a large Seebeck coefficient (consequence of the localized and empty states of the B-cation), and large electrical conductivity due to the more spread unoccupied band of the B’ cation. We have seen that if they can be optimally doped, they could show a figure of merit comparable or even higher than the best -type thermoelectric oxides, such as SrTiO3. Different mechanisms to tune the band structure and enhance the thermoelectric figure of merit are explored, including epitaxial strain, hydrostatic pressure, chemical pressure, and external doping. A fully relaxed structure has also been studied, showing that a realistic calculation is necessary to make accurate predictions, but also proving that the main trends shown throughout the paper remain unchanged.
pacs:
72.20.Pa, 71.20.-b, 72.80.GaI Introduction
The quest for new materials with outstanding thermoelectric (TE) properties is one of the cutting-edge research topics nowadays because of its multiple applications: from Peltier cooling to the conversion of waste heat into electricity in order to, for instance, reduce fuel consumption in vehicles. The TE efficiency of these materials can be characterized by a dimensionless TE figure of merit , where is the electrical conductivity, is the Seebeck coefficient, is the absolute temperature, and is the thermal conductivity which contains both the electron, , and lattice, , contributions.
Improving can be achieved combining different strategies. A first choice consists in reducing the total thermal conductivity, which often implies reducing the lattice part. Heat carried by lattice vibrations (phonons in the quantized form) is particularly detrimental to TE performanceSingh and Terasaki (2008) since the heat backflow leads to a reduction in the temperature gradient required for the TE module to operate. The idea of reducing thermal conductivity while retaining reasonable values for both the electrical conductivity and the Seebeck coefficient lies at the basis of the “phonon-glass, electron-crystal” concept developed by Slack more than twenty years ago. Slack (1995); Beekman et al. (2015) This is often carried out by the use of materials with very complex unit cells Snyder and Toberer (2008); Nolas et al. (2006) or cage-like compounds in which heavy atoms are enclosed. The rattling of these heavy atoms strongly scatters phonons, specially those with a longer wavelength, that are the most involved in the heat transport, with the corresponding reduction in lattice thermal conductivity. Examples of structures that can lead to excellent TE materials, some of these based on these concepts are skutterudites, Sales et al. (1996); Singh and Mazin (1997); Keppens et al. (1998) clathrates, Saramat et al. (2006) chalcogenides,Gao et al. (2013) Zintl-phases, Kauzlarich et al. (2007) or half-Heusler alloys. Shen et al. (2001); Culp et al. (2008)
A second way to improve the TE figure of merit is to maximize the power factor, defined as the product , by varying the carrier concentration with different doping levels. Ohta et al. (2005a, b); Muta et al. (2003) This approach has its limitations, since the Seebeck coefficient, electrical conductivity, and electronic thermal conductivity are strongly interconnected. Typically, is small in metals, leading to small power factors. On the other hand, is large for semiconductors and insulators but is lower for them, so the power factor is again very small. Bruce et al. (2010) For a given material, the carrier concentration can be optimized to achieve a good compromise among these quantities in order to enhance the value of the power factor. The values that maximize the power factor are usually of the order of 1018-1019 cm-3, typical in extrinsic doped semiconductors and semimetals. However, the interdependency of the Seebeck coefficient and the electrical conductivity hampers the applicability of this optimization method. A more desirable strategy would require the decoupling of these two quantities.
Since the Seebeck coefficient is directly proportional to the energy derivative of the electronic conductivity at the Fermi energy, , itself related with the density of states (DOS), Ashcroft and Mermin (1976) then the presence of narrow and sharp features of the DOS around can increase the thermopower [see Eq. (2) of Ref. Heremans et al., 2008]. The idea of tuning the band structure of materials to enhance the thermoelectric figure of merit was proposed by Hicks and Dresselhaus in two milestone works two decades ago. Hicks and Dresselhaus (1993a, b) Working within a free-electron model, these authors showed how a reduction in the dimensionality of the TE materials could dramatically improve their performance because (i) the electron confinement in low-dimensional systems modifies the shape of the DOS, that displays a staircase-shaped energy dependence with each step being associated with one of the energy states (in 2D), divergence near the bottom of each of the one-dimensional subbands (in 1D) or isolated peaks located at the energy states (in 0D), with large derivatives at the previous particular energy positions, and (ii) the boundaries of the low-dimensional system would increase the scattering of phonons with wavelengths comparable or larger than its spatial dimensions, leading to a considerable reduction of the thermal conductivity.
Another approach to induce peaks in the DOS is the use of materials with strongly correlated electrons. From this perspective, oxides are a very attractive option. Hébert et al. (2015) Oxygen can be combined with many different cations in relatively simple structures that present very different structural phase-transition sequences involving polar and non-polar distortions; equilibrium phases of insulating, semi-conducting, metallic and even superconducting character; and piezoelectric, ferroelectric, ferromagnetic, multiferroic or TE properties, making them ideal candidates for multifunctional devices. Also, they are stable under ambient conditions and they can be processed on the nanoscale in the form of thin films, nanoparticles, or even nanowires using nowadays standard techniques. The study of TE properties on oxides was boosted after the discovery of a large thermopower in the metallic layered NaxCoO2 cobaltates, with values up to 1.0 at 800 K. Terasaki et al. (1997); Koshibae et al. (2000); Hébert et al. (2001); Singh (2000) This family of materials are composed by triangular planes of CoO2, where the Co atoms sit inside trigonally distorted edge-sharing octahedra, separated by layers filled with Na+. Their electronic structure combines two sets of electrons produced by the trigonal splitting of the t2g manifold: delocalized and more localized electrons.Yamamoto et al. (2002) The former provide a large conductivity, and the latter help increasing the Seebeck coefficient. This, together with their relatively small thermal conductivity, places layered cobaltates as the highest recorded for oxides. Other oxides that show large power factors are, e.g. -type doped SrTiO3 (nominal 3 electronic configuration) or, more recently CrN (not an oxide, but very close in terms of electronic structure Botana et al. (2012) with its nominal 3 electronic configuration with a full majority-spin band in each site and its naturally occurring electron doping). Both of them have been found to increase its dramatically when nanostructured (see Ref. Ohta et al., 2007 for SrTiO3 and Ref. Quintela et al., 2015 for CrN). These two systems have in common the occurrence of empty -bands just above the Fermi energy that yield a set of localized levels that are sensitive to electron doping. Very similar band fillings will be explored in the present work.
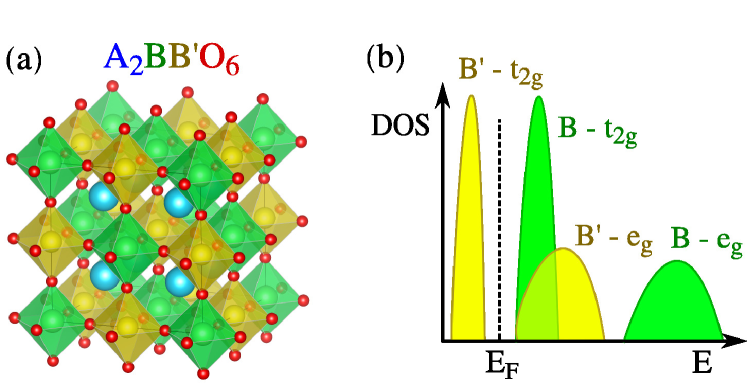
Trying to put together all these evidences for oxides and TE materials in general, we have attacked the problem from a different facet: instead of playing with dimensionality, we exploit the very flexible chemical composition that can be found in oxides. We focus on double perovskites of generic chemical formula A2BB’O6 [see a picture of the well-known structure in Fig. 1(a)], where A is a di- or trivalent cation, while B and B’ are different transition metals that are combined in such a way that they have a filling. The expected DOS is schematically represented in the cartoon of Fig. 1(b). The B cation has a completely empty -shell, with a localized band just above the Fermi level. When the system is electron-doped, this band should yield a large thermopower. Assuming that the B’ cation is in a low-spin state, it presents a full shell. Due to the presence of a broad empty band just above the Fermi level, a highly conductive hopping path is provided. Besides, low thermal conductivities (compared with SrTiO3 at optimal doping levels) below 1 W m-1 K -1 have been reportedTakahashi et al. (2012) in other related double-perovskite oxides, and these low values have been related to the double-perovskite structure itself. This encourages to think that if they can be doped at an optimal level, these systems could be potential candidates to become excellent TE materials. To test the validity of the previous hypothesis on the electronic structure, we have carried out first-principles simulations combined with semiclassical Boltzmann computations of the transport quantities.
The rest of the paper is organized as follows. The requirements for the ideal double perovskite are summarized in Sec. II. The methods utilized for the simulations are described in Sec. III. In Sec. IV we present the electronic structures, Seebeck coefficients, electrical conductivities and power factors of different double perovskites, both in the relaxed cubic structures and under biaxial strain, whose application has been already used to modify the band structure and enhance the power factor in other materials. Bach et al. (2013); Pardo et al. (2013); Saeed et al. (2014a, b) We also present other methods to tune the band structure, based on cation intermixing or volume variations, and analyze a more realistic case with a fully relaxed structure. Finally, we compare the results with the best -type oxide TE material up to date, SrTiO3.
II Selecting the candidates
The properties that the candidate double-perovskite materials should meet in order to achieve the ideal band structure with the filling scheme depicted in Fig. 1(b) can be enumerated as follows. (i) The cation on the B’ site must be in a low-spin state to yield a filled shell. For this reason, transition metal elements from the and rows are selected. (ii) The highly-degenerate electronic configuration at the low electron-doping region which provides the desired scheme for a high Seebeck coefficient requires an empty -shell in the B-cation site. For the studied compounds, we choose only elements in their most usual valence state, since these materials are ultimately expected to be grown in the laboratory. (iii) We study only ordered double perovskites. This ordered structure is more likely to occur if there is a substantial difference in size and/or valence between the B and B’ cations. To ensure that the cubic perovskite structure is preserved (or is at least a good approximation), we also combine elements whose ionic radii fulfill the tolerance factor relation
| (1) |
where is the average ionic radii of the B and B’ cations, is the oxygen’s ionic radius and is the A cation ionic radius. If the tolerance factor is on the order of 1, the structure tends to be more stable in the cubic phase. In principle, non-cubic perovskites would be useful as well, but a much more complex computational treatment is required due to distortions.
Under these premises, we consider for the B site Ti4+, Nb5+, and Ta5+ cations from the , , and transition metal series, respectively. These are combined with Ir3+, Rh3+, Pt4+, and Pd4+ cations for the B’ site, from the and transition metal series. Typical A cations chosen are Sr2+ and La3+ or an ordered mixture of both.
III Computational details
Electronic band structures are calculated within the density functional theory (DFT)Hohenberg and Kohn (1964); Kohn and Sham (1965) framework using the all-electron, full potential code wien2k. Schwarz and Blaha (2003) This package is based on the augmented plane waves plus local orbitals (APWlo) method. Sjöstedt et al. (2000)
Typical values for the muffin-tin spheres radii used are (in a.u.): 2.50 for Sr and La; 1.90 for Ta, Rh, Ir, Pd, Pt, Ti, and Nb; and 1.60 for O. In some cases, especially under the most extreme strain conditions that are discussed in Sec. IV.2, these radii were further reduced.
Inside the muffin-tin spheres, the mixed APW+lo (where lo stands for local orbital) and LAPW basis set are expanded in spherical harmonics up to . Nonspherical contributions to the electron density and potential up to 6 are used.
In LAPW-based methods, the plane-wave cutoff for the electronic wave functions in the interstitials is controlled by the parameter Kmax, where is the smallest muffin-tin sphere radius and Kmax is the largest plane wave momentum vector defined by this product. A parameter Kmax=7.0 ensures calculations are converged for the magnitudes presented, in particular optimal volumes and band gaps.
The integrals in reciprocal space are well converged, using a sampling in -space of , generated using the modified tetrahedron method.Blöchl et al. (1994) For the computation of the density of states (DOS), a non-self-consistent calculation within a grid of is carried out.
The relaxed lattice parameters are obtained within the generalized gradient approximation (GGA), using the exchange and correlation functional proposed by Wu and Cohen. Wu and Cohen (2006) This choice is motivated by the fact that it is known that the Wu and Cohen functional improves the accuracy of the structural properties of bulk ABO3 ferroelectrics over the most usual GGA’s. Nishimatsu et al. (2010) For each combination of cations, we performed an initial volume optimization within a cubic perovskite structure, and the results on the TE properties are discussed in Sec. IV.1. Then, the effect of biaxial strain imposed by a hypothetical substrate is simulated, constraining the length of the lattice vectors along the three cartesian directions in such a way that . Assuming that the in-plane lattice constant, , is determined by the substrate, then the out-of-plane lattice constant is relaxed. The results are summarized in Sec. IV.2. The possibility of tuning the band structure under hydrostatic pressure is also explored (Sec. IV.3.2). In this case, volume reductions are performed decreasing the cubic lattice parameter retaining the cubic symmetry. Finally, a full relaxation of the atomic structure is studied in Sec. IV.4, for which all forces were relaxed below 2.0 mRy/a.u.
Once the atomic structure is determined in every case, we have used the Tran-Blaha modified Becke-Johnson (TB-mBJ) semilocal exchange potential for obtaining the band structures, Tran and Blaha (2009) since this functional has been shown to reproduce successfully the band gap for a wide range of semiconductors and oxides, Koller et al. (2011); Dixit et al. (2012) SrTiO3 among them. Sarantopoulos et al. (2015) Due to the presence of heavy atoms with and electrons, spin-orbit interaction effects could be of significance. In order to assess the importance of spin-orbit coupling and eventual modifications of the band structure of these double perovskites, we have performed calculations including this effect in a second variational manner. Singh and Nordstrom (2006)
An on-site Coulomb repulsion for the compounds containing La is used to move La- empty levels Anisimov et al. (1997); Gillen et al. (2013) away from the Fermi energy. This is motivated by the fact that these orbitals do not participate in the calculation of the transport coefficients, Madsen and Singh (2006); Scheidemantel et al. (2003) which involves only a very narrow energy range related with the -bands, and its explicit consideration might introduce spurious contributions in the TE phenomena analyzed. This is carried out with the usual LDA+Anisimov et al. (1991); Petukhov et al. (2003) prescription (with an around 9 eV), where the uncorrelated part of the exchange-correlation is obtained using the TB-mBJ scheme explained above. Realistic inclusion of 4 orbitals would require to adequately select to match the experimental position of these levels in the studied double perovskites, but this is beyond the scope of the current work.
We have estimated the electrical conductivity and the Seebeck coefficient through the semiclassical Boltzmann theory Ziman (1972); Ashcroft and Mermin (1976) within the constant relaxation time approximation, as implemented in the BoltzTraP code. Madsen and Singh (2006) This implementation relies on the Fourier expansion of the band-energies, provided by a first-principles electronic structure code (wien2k in the present study). In this case, a denser -mesh of is needed to reach convergence for the Fermi-surface integrals involved in the TE quantities presented. Since we are using the simple constant relaxation time approximation, the scope of our paper is to provide on the one hand trends with strain and also a relationship between electronic structure and transport properties. It is not our intent to give accurate values for the optimal doping or Seebeck coefficients, these should be taken with caution when comparing with future experiments.
IV Results and discussion
IV.1 Relaxed case electronic structure
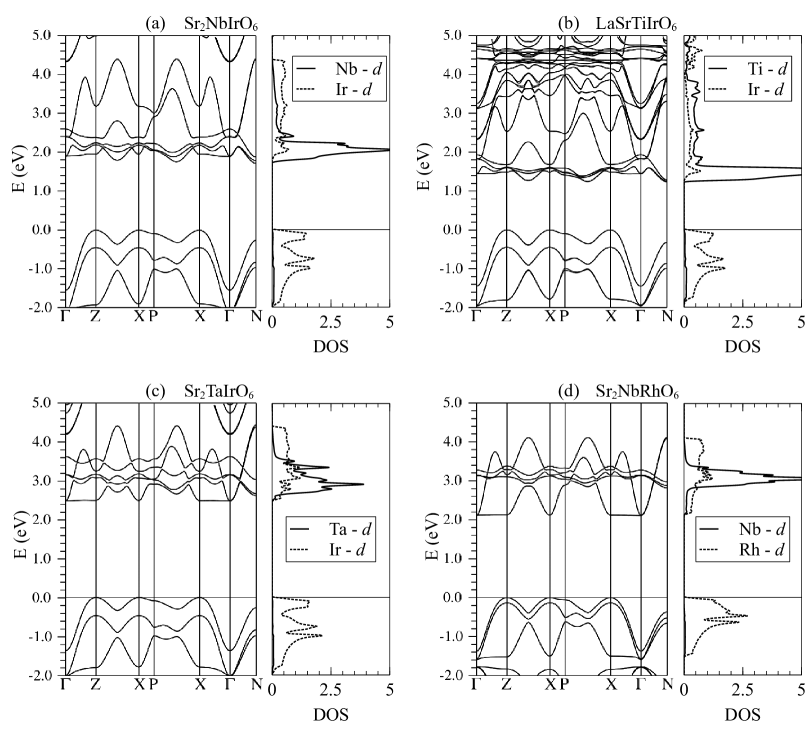
Figure 2 shows the band structures and densities of states (DOS) for some representative double-perovskite cases. It is interesting to compare their basic electronic structure with the rough picture described above as the desired electronic structure in the cartoon of Fig. 1(b). For Sr2NbIrO6, Fig. 2(a), narrow Nb bands are just at the bottom of the conduction band, almost degenerate with the wider Ir bands. The same happens with other compounds like LaSrTiIrO6 [Fig. 2(b)] or Sr2TaIrO6 [Fig. 2(c)], all of them characterized by the presence of a cation, Ir, at the B’-site. However, there are some other cases like Sr2NbRhO6 [Fig. 2(d)] which present a slightly shifted band structure, with the unoccupied bands of the metal lying at the middle of the B’- bands. All in all, the main result that can be drawn is that these double perovskites combine a localized B- band and a more delocalized B’- band that lie roughly in the same energy window. The actual details of band orderings depend on the particular atomic configuration of the system but, to a first approximation, we find that it is possible to obtain an electronic structure similar to the one sketched in Fig. 1(b).
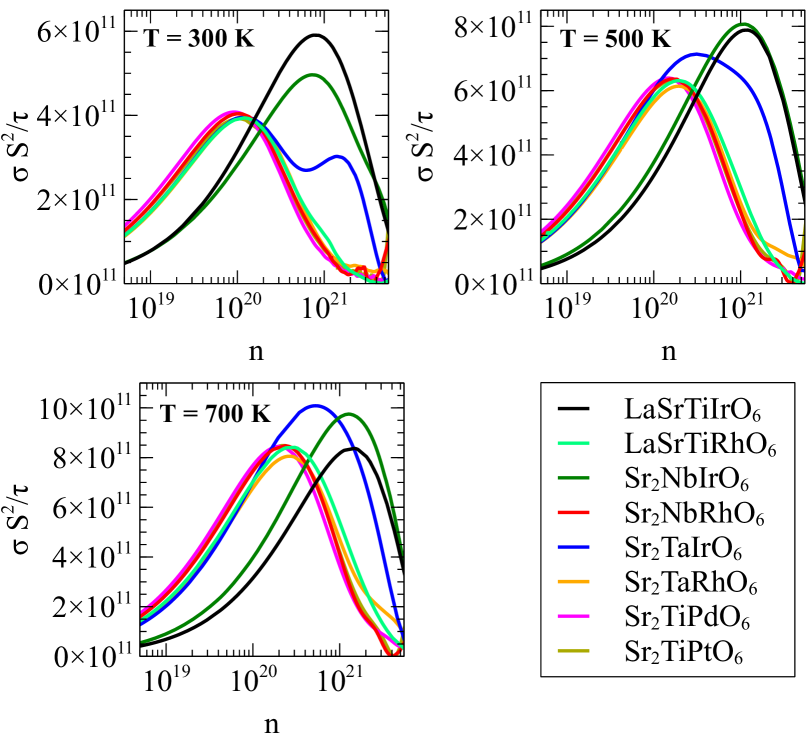
In order to analyze the TE properties of these double perovskites, we show in Fig. 3 the power factor divided by the relaxation time as a function of the carrier concentration for three different temperatures. The calculations are performed within the semiclassical Boltzmann theory with two approximations: (i) the constant relaxation time, and (ii) the “rigid band approach” that assumes that the band structure does not change with temperature or doping and, therefore, it is fixed independently of the chemical potential. Despite the effect that the energy, temperature or doping dependence of the relaxation time may have on the final figure of merit of the material, Zhou et al. (2011) we want to stress in this point the importance of having an appropriate electronic structure which can be easily tuned by different means, as it happens in these compounds. The values of and thermopower presented are the average value of the diagonal components of the TE tensors. Due to the cubic symmetry of the system, this is a very representative quantity. The main results are: (i) We observe that for all compounds including Ir, the optimal carrier concentration for a maximal power factor and optimal TE performance is approximately cm-3, while for those double perovskites which do not include Ir, the maximum is at lower carrier concentrations around cm-3. (ii) These optimal doping levels are almost temperature independent; only small deviations of the order of 10% are observed as temperature is increased. (iii) The maxima of the power factor at optimal doping are substantially enhanced with temperature, increasing by about 70% from 300 K to 700 K. The origin for this behaviour can be traced back to the band structures shown in Fig. 2, where it can be seen how the Ir-based compounds present a band degeneracy at the bottom of the conduction band formed by the Ir and Ti/Nb/Ta bands. Such degeneracy is intimately related to an enlarged power factor and a higher optimal carrier concentration. The relationship between large band valley degeneracy and enhancement of the TE properties is well known,Pei et al. (2011) and our results confirm that this is possible to obtain with these double perovskites to some extent.
IV.2 Tuning the band structure by biaxial strain in the ab-plane
It has been demonstrated theoretically Hicks and Dresselhaus (1993a, b); Ohta et al. (2007) and also tested experimentally Boukai et al. (2008); Hochbaum et al. (2008) how quantum confinement and low-dimensionality could enhance the TE figure of merit of a system. Also, strain has been found to play a role in decoupling the different transport coefficients involved in TE efficiency, which are usually inter-related. Bach et al. (2013); Pardo et al. (2013); Saeed et al. (2014a, b) Thin films of similar double perovskites have been grown routinely over different substrates. Guo et al. (2006); Manako et al. (1999) Thus, it is plausible to explore the effects of biaxial strain (which is achieved by means of epitaxial growth of thin films over substrates with a different lattice parameter) on these compounds. We can theoretically analyze the effects of both compressive and tensile strain in the band structure of these materials by simply imposing the in-plane lattice parameter and relaxing the out-of-plane lattice constant keeping the constraint of a tetragonal symmetry. By studying the general changes in the electronic structure and TE properties we can try to generalize and construct a recipe to improve the TE response of these double perovskites.
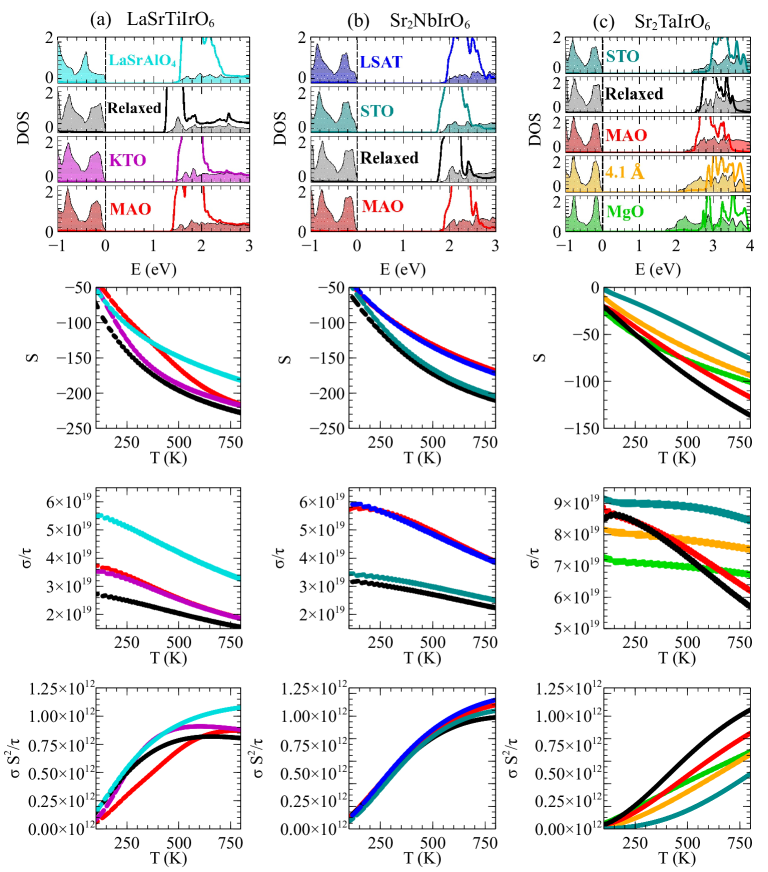
For a better comparison with experiments, we have selected the lattice constant corresponding to the experimental value of different commonly used substrates, that cover a wide range of lattice constants: LaSrAlO4 (= 3.755 Å), (LaAlO3)0.3(Sr2TaAlO6)0.7 (LSAT, = 3.868 Å), SrTiO3 (STO, = 3.905 Å), KTaO3 (KTO, = 3.989 Å), MgAl2O4 (MAO, = 4.041 Å), MgO ( = 4.212 Å), and another set of calculations with Å to fill the gap between MAO and MgO.
The epitaxial strain changes both the position of the center and the widths of the bottom conduction bands in systems with octahedral symmetries, such as the double perovskites considered here. For bands coming from the B cation, on the one hand, a compressive epitaxial strain produces an elongation of the oxygen octahedra along the direction that stabilizes the orbitals with components, so the center of the respective bands (the and doublet) are positioned lower in energy than the singlet. Moreover, compressive strain reduces the distance between the atoms in the plane and produces larger overlap between the orbitals directed in the plane perpendicular to the strain axis ( and ), so the width of the corresponding bands increases. On the other hand, a tensile epitaxial strain produces a compression of the octahedra along the -direction, that will place the orbitals with components higher in energy. Valionis (2015) In this case, the bands with major character from orbitals with component are wider.
A similar effect occurs for the B’- bands: tensile (compressive) strain lowers the () band and band widths get enlarged for the in-plane (out-of-plane) orbital when compressive (tensile) strain is applied. All these effects combined lead to different band displacements that move in different directions when epitaxial strains are applied. The main results are summarized for selected compounds in Fig. 4.
In those cases in which the involved B’- manifold is lower in energy than the B- manifold, such as LaSrTiIrO6 over LaSrAlO4 substrate [Fig. 4(a)], or Sr2NbIrO6 over LSAT or MAO substrates [Fig. 4(b)] no drastic effect is observed in the Seebeck coefficient by applying strain (sometimes it gets even slightly reduced because of the wider B- bands). However electrical conductivity in those cases increases to even 2 times the value for the relaxed case within the cubic symmetry (from to 1/( m s) at 800 K for Sr2NbIrO6 [Fig. 4(b)]). The result is an enhanced power factor that takes place together with a large degeneracy at the bottom of the conduction band. We present these TE properties obtained at cm-3 for the three materials appearing in Fig. 4. Depending on the compound, the optimal carrier concentration could vary, but trends are consistent in the 1018 - 1021 cm-3 range. It is not the objective of this work to provide accurate values of the optimal doping. Band structure tuning by shifting bands and modifying their band widths by applying strain is most effective when the bottom of the B- and B’- bands get close in energy, as can be clearly seen for LaSrTiIrO6 [Fig. 4(a)] and Sr2NbIrO6 [Fig. 4(b)]. One can also notice in these two panels that if the B- band gets occupied first (at this electron-doping level we are considering) the electrical conductivity gets drastically reduced and thus the power factor is lower [in Fig. 4(a) for all substrates except for LaSrAlO4 and in Fig. 4(b) for STO and the relaxed case within the cubic symmetry].
In Fig. 4(c) we see the results for Sr2TaIrO6, which confirms the trend that the presence of a lower lying B’- band is necessary for an enlarged power factor to occur. The other important fact seen here is that the wider the bands, the lower the Seebeck coefficient is, which is not a surprising effect. In some cases, even biaxial strain does not enhance the TE properties since the relaxed case within the cubic symmetry already presents an optimal configuration.
For the other compounds (not shown) strain does not play a major role. In the limit in which the B- bands lie in the middle of the broader B’- bands, the effect is very small because it does not largely affect the doping region where large band valley degeneracy occurs. The value of the power factor obtained for the corresponding double perovskites is lower than in the other compounds because the Seebeck coefficient is not so large. Even when biaxial strain is applied, we do not observe a significant improvement of the TE properties.
We conclude that an initial configuration with the B- and B’- bands being both at the bottom of the conduction band is required for having good TE properties in these systems, and that in those cases it is possible to tune them by means of biaxial strain.
IV.3 Other methods to tune the band structure
Besides the application of biaxial strains imposed by epitaxial growth, we have examined three other mechanisms to modify the electronic band structure in order to enhance the TE performance: the effect of using more compact -states considering atoms of the 3-row, the use of hydrostatic pressure to reduce the unit-cell volume and change the distance between atoms, and chemical substitution to induce a “chemical pressure” effect. The main results are explained in the following three subsections.
IV.3.1 Spatial range of the -orbitals
The effect of the extension of the orbitals of the B- and B’-cations and the corresponding change in hybridizations has been studied by replacing the previously considered atoms in the -row by transition metal atoms of the row. For this purpose we have chosen La2TiFeO6. The existence of ordered cationic structures in this compound can be presumed by the large valence difference. The calculation converges nicely to a Ti4+()/Fe2+(), where Fe2+ is in a low-spin state with a full shell, just like every other compound we have examined previously in this study. We immediately observe that even though the Seebeck coefficient (not shown) remains as large as for the other double perovskites presented, the electrical conductivity is at least one order of magnitude lower than the previous cases. The driving force responsible for this reduction can be ascribed to the more localized character of Fe -orbitals compared with or orbitals. The compactness of the -orbitals makes the hopping between Fe and O lower than the corresponding hopping due to a / metal. The band structure (not shown) presents the Fe bands above the Ti bands, so the conduction mediated by the bands (which worked in other compounds) is not active in this case, and thus the electrical conductivity is reduced. For these reasons, we have not considered further combinations with transition metal cations and focused only on the combination of elements at the B- and B’-sites.
IV.3.2 Hydrostatic pressure
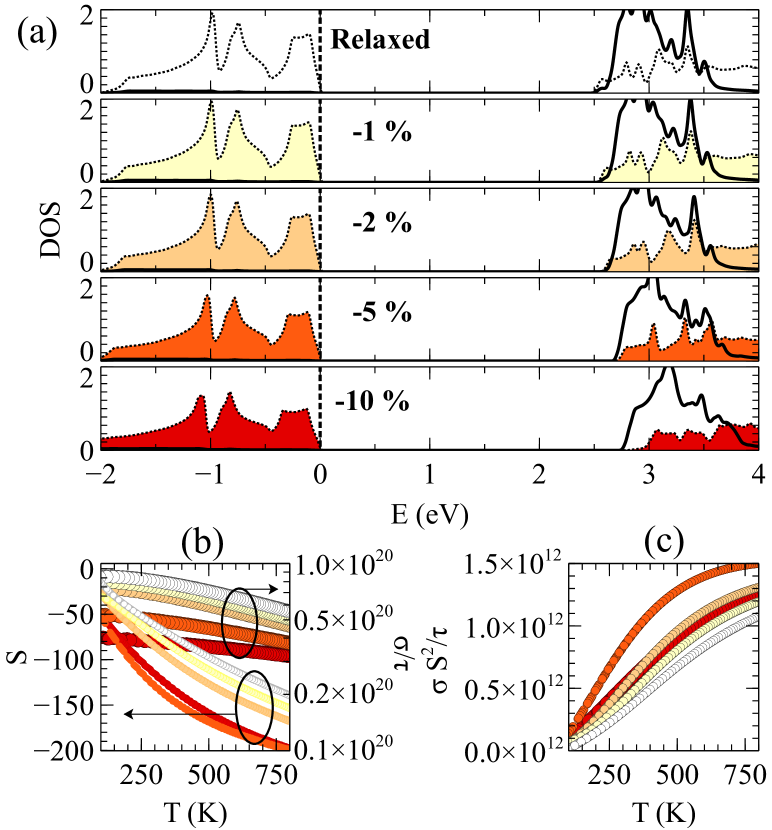
We have also studied the possibility of enhancing the TE properties by means of the application of an external hydrostatic pressure. The most important effect induced by pressure is the reduction of the unit cell volume, that is assumed to remain in a cubic symmetry. The structural changes and the concomitant smaller metal-oxygen distances modify the electronic band structure of the double perovskites accordingly. In particular, the crystal field splitting between and levels will be enhanced as pressure is increased. This translates into a lower positioning of the B- bands with respect to the B’- bands that are shifted upwards in the conduction band.
As a test case, we have studied the effect of hydrostatic pressure on Sr2TaIrO6, with volume reductions up to 10 % which would correspond to external pressures of about 27 GPa. In this double perovskite, at the relaxed cubic structure in the absence of external pressure, the bottom of the narrow Ta bands are located at the same energy as the bottom of the more widely spread Ir manifold [see DOS at the top of Fig. 5(a)]. Thus, it is a good example where the evolution of these bands with volume variation can be studied. When pressure is applied and the unit cell volume is reduced, the crystal field gap between the and the bands for each atom becomes larger, as it happens also with the width of each of these bands [Fig. 5(a)]. However, both variations are not dramatic, significant changes are only expected if the initial positioning of the bottom of the and bands is really close.
Regarding the transport properties [Fig. 5(b)]: on the one hand, the Seebeck coefficient is enlarged (in absolute value) when the degeneracy at the bottom of the conduction band is maximal. On the other hand, the electrical conductivity is reduced when the volume decreases, i.e. when the system tends to have the more localized Ta bands occupied first, instead of the more spread Ir ones. Combining all these effects [Fig. 5(c)], the higher power factor occurs for a volume reduction of 5% in the unit cell, equivalent to a pressure of 11 GPa.
Again, the final conclusion is that if the involved bands are already close to the optimal band structure configuration, an enhancement of the TE response can be achieved by means of a reasonable volume reduction.
IV.3.3 Chemical pressure
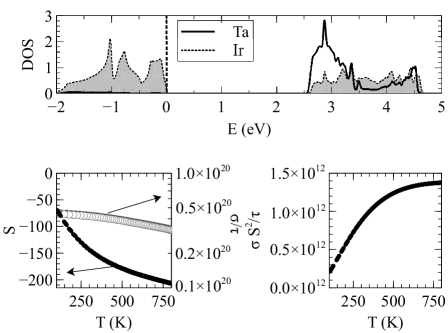
Volume reductions can also be realized by changing the size of the A cation (so-called chemical pressure). We have explored this possibility replacing Sr2+ (ionic radius: 1.44 Å ) by smaller Ca2+ (ionic radius: 1.34 Å ) in the double perovskite studied in the previous subsection. This substitution immediately reduces the lattice parameter of the hypothetical cubic phase, that changes from 3.975 Å in Sr2TaIrO6 to 3.939 Å in Ca2TaIrO6 (volume reduction of 2.7 %).
If we look at the electronic structure and transport properties of Ca2TaIrO6 (Fig. 6) we can see that the values for the Seebeck, electrical conductivity, and power factor are essentially the same as the ones for Sr2TaIrO6 with a 5% volume reduction. In other words, the chemical substitution (even without applying any external pressure) produces the same effects as the unit cell shrinking that optimized the TE figure of merit.
The main drawback of this approach is that the theoretical tolerance factor [Eq. (1)] is for this compound, so we cannot assume that cubic symmetry will be preserved. Therefore, we acknowledge that these particular calculations could be overestimating the real values for the TE properties. More complete and computationally demanding simulations would be required to check these results, involving a full relaxation of the lattice and atomic positions.
IV.4 Full relaxation
For completeness, we have performed a full relaxation of the double-perovskite structure for one particular case to study its possible effects, even though a comprehensive study is beyond the scope of this paper. We have studied the compound Sr2NbIrO6 under different strains. It presents an electronic structure close to the ideal configuration and a tolerance factor of . Tilted octahedra result from this structural relaxation. This influences directly the electronic structure and as a consequence, the TE properties of the system. Even though the unit cell preserves a global cubic symmetry, the local environments for the cations become tetragonally distorted.
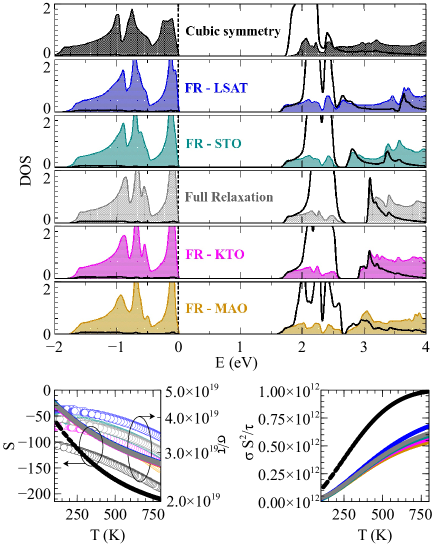
We can see these differences in Fig. 7, in which a comparison between the cubic symmetry case and the fully-relaxed case under different strains is shown. Comparing the cubic-symmetry case with the fully relaxed case without strain, the most notorious effect is the splitting of the Ir manifold. The degeneracy existing within these levels as a consequence of the local tetragonal symmetry is lifted by octahedral rotations. This directly affects the electrical conductivity of the system, since the hopping channel is substantially modified.
For all cases containing a full relaxation, a lower (and almost similar) Seebeck coefficient is present. This is due to the always low-lying Ir which, as we previously discussed, leads to a reduced TE power. A higher electrical conductivity happens in the case of a fully relaxed structure with the substrate LSAT (data in blue in Fig. 7). The bands of Ir (which in this case are not split) provide a wider hopping channel since they are lower in energy than the Nb bands. Comparing this case with the one with cubic symmetry which also presents degenerate bands (data in black in Fig. 7) one can see the difference between the Seebeck coefficient and the electrical conductivity for both cases. The difference in the electrical conductivity is explained as before, taking into account which hopping path is activated first: the Ir bands in the case of a fully relaxed structure with LSAT and the Nb bands in the case of cubic symmetry. This results in a higher electrical conductivity in the first case. However the Seebeck coefficient is lower in the case of the LSAT substrate because there is no peak in the density of states close to the bottom of the conduction bands, which happens in the case of cubic symmetry.
We are able to obtain a power factor for a fully relaxed structure on the order of 65-70% the value of the power factor in the simplified cubic case. With this result, we want to stress that if one wants to compute the electronic structure of a real compound in a double-perovskite structure, it is necessary to include a full relaxation of the structure, since the transport coefficients are quite sensitive to small changes in the atomic positions. However, the main picture on how the ideal electronic structure would look like does not change, and the main effects discussed throughout the text remain the same. Other calculations in similar systems involving full structural relaxations also retain a large TE efficiency.Garrity (2016)
IV.5 Comparison with SrTiO3
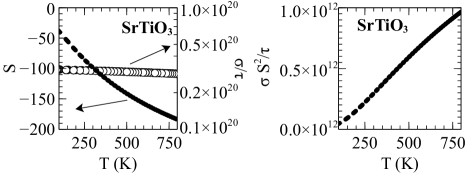
In order to gauge the importance of the enhancements of the TE performance obtained with the tuning of the band structure mechanisms explained in Sec. IV, we have carried out calculations for bulk SrTiO3 (STO), one of the best -type oxide TE materials found up-to-date. Ohta et al. (2007); Sarantopoulos et al. (2015); Ohta et al. (2005a, b); Muta et al. (2003) Figure 8 shows the DOS and the TE properties. The values of the Seebeck coefficient match the experimentally observed ones Ohta et al. (2005a, b); Muta et al. (2003) by several authors at the optimal carrier concentration ( cm-3). Since the basic electronic structure is very similar, this constitutes a strong validation of our calculations for the double perovskites presented so far.
If we compare the results for double perovskites with the ones with STO, we can observe that the values for the Seebeck coefficient are, in some cases like LaSrTiIrO6 [Fig. 4(a)], larger that those for STO. The electrical conductivity for these double perovskites is of the same order of magnitude or even higher than that of STO [see, for example, LaSrTiIrO6 on KTO in Fig. 4(a) or Sr2TaIrO6 in Fig. 4(c)], assuming that the scattering time remains similar for both systems, which seems a reasonable premise.
But what makes them ultimately very interesting materials is their very low thermal conductivity compared with that of STO. At the optimal doping regime for these compounds, thermal conductivities below 1 W m-1 K -1 have been reported Takahashi et al. (2012) for double perovskites, while in STO typical values are easily above 3 W m-1 K -1. This can provide a thermoelectric figure of merit up to 3 times larger that that of STO, making these compounds strong candidates for being good TE materials.
V Summary
We have studied various nonmagnetic oxides in a double-perovskite structure, with a / ionic configuration combining transition metals from different series. These compounds show a very large Seebeck coefficient, comparable with the largest values calculated for the best TE oxides at reasonable electron-doping levels. The driving force for the large is the existence of a peak in the DOS coming from the empty bands of one of the cations at the B-site. Our simulations show that the electrical conductivity can be improved by the introduction of broad bands from cations. Even more, the band structure can be tuned applying epitaxial strain, so the power factor can be enhanced by up to a 30% with respect to the relaxed cases within the cubic symmetry in some compounds, achieving values even higher than other similar oxides like SrTiO3. This, combined with experimental evidencesTakahashi et al. (2012) showing that several double perovskites have lower ( times) thermal conductivity than SrTiO3Ohta et al. (2005a, b); Muta et al. (2003) at the optimal carrier concentrations makes these materials potential candidates to become (when optimally doped) good thermoelectrics.
In a more general context, we have shown through first-principles calculations the effectiveness of the combination of a highly degenerate band structure around the Fermi level with a more spread band which provides good electrical conductivity together with a narrower and sharp band to optimize the Seebeck coefficient. The crucial point is to have the maximum degeneracy possible at the bottom of the conduction band (if electron doping is considered, as we have done here) but with a lower lying band providing the power factor enhancement. Our calculations show that this configuration optimizes the TE power factor in this kind of systems, and whenever it does not happen as a natural configuration, it can be achieved effectively by means of biaxial strain and/or volume reduction, if the starting band structure is sufficiently close to the “ideal” one.
We also want to stress that in order to make predictions about any specific compound which is proposed here, one should perform a calculation including a full relaxation of the atomic structure, which could introduce deviations from the ideal configuration (such as distorted or rotated octahedra) that would drive to slightly different results coming from a modified electronic structure. Nevertheless, one could find a compound in which a full relaxation of the structure locates the and bands in the correct place with respect to each other. Then strain, volume reduction, or some of the other methods discussed throughout the text can be used to precisely tune the band structure and reach the optimal TE efficiency.
Acknowledgements.
PVA and VP thank the Xunta de Galicia for financial support through project EM 2013/037. VP, PGF and JJ acknowledge financial support from the Spanish Ministery of Economy and Competitiveness through the MINECO Grants No. MAT2013-44673-R (VP), and No. FIS2012-37549-C05-04 (PGF and JJ). VP and PGF also acknowledge funding from the Ramón y Cajal Fellowship RYC-2011-09024 and RYC-2013-12515, respectively.References
- Singh and Terasaki (2008) D. J. Singh and I. Terasaki, Nat. Mater. 7, 616 (2008).
- Slack (1995) G. A. Slack, “Handbook of thermoelectrics,” (CRC Press, Boca Raton, Florida, 1995).
- Beekman et al. (2015) M. Beekman, D. T. Morelli, and G. S. Nolas, Nat. Mater. 14, 1182 (2015).
- Snyder and Toberer (2008) G. J. Snyder and E. S. Toberer, Nat. Mater. 7, 105 (2008).
- Nolas et al. (2006) G. S. Nolas, J. Poon, and M. Kanatzidis, MRS Bulletin 31, 199 (2006).
- Sales et al. (1996) B. C. Sales, D. Mandrus, and R. K. Williams, Science 272, 1325 (1996).
- Singh and Mazin (1997) D. J. Singh and I. I. Mazin, Phys. Rev. B 56, R1650 (1997).
- Keppens et al. (1998) V. Keppens, D. Mandrus, B. C. Sales, B. C. Chakoumakos, P. Dai, R. Coldea, M. B. Maple, D. A. Gajewski, E. J. Freeman, and S. Bennington, Nature (London) 395, 876 (1998).
- Saramat et al. (2006) A. Saramat, G. Svensson, A. E. C. Palmqvist, C. Stiewe, E. Mueller, D. Platzek, S. G. K. Williams, D. M. Rowe, J. D. Bryan, and G. D. Stucky, J. Appl. Phys. 99, 023708 (2006).
- Gao et al. (2013) M.-R. Gao, Y.-F. Xu, J. Jiang, and S.-H. Yu, Chem. Soc. Rev. 42, 2986 (2013).
- Kauzlarich et al. (2007) S. M. Kauzlarich, S. R. Brown, and G. Jeffrey Snyder, Dalton Trans. , 2099 (2007).
- Shen et al. (2001) Q. Shen, L. Chen, T. Goto, T. Hirai, J. Yang, G. P. Meisner, and C. Uher, Appl. Phys. Lett. 79, 4165 (2001).
- Culp et al. (2008) S. R. Culp, J. W. Simonson, S. J. Poon, V. Ponnambalam, J. Edwards, and T. M. Tritt, Appl. Phys. Lett. 93, 022105 (2008).
- Ohta et al. (2005a) S. Ohta, T. Nomura, H. Ohta, and K. Koumoto, J. Appl. Phys. 97, 034106 (2005a).
- Ohta et al. (2005b) S. Ohta, T. Nomura, H. Ohta, M. Hirano, H. Hosono, and K. Koumoto, Appl. Phys. Lett. 87, 092108 (2005b).
- Muta et al. (2003) H. Muta, K. Kurosaki, and S. Yamanaka, J. Alloy Compd. 350, 292 (2003).
- Bruce et al. (2010) D. W. Bruce, D. O’Hare, and R. I. Walton, Functional oxides (John Wiley and Sons, Chichester, West Sussex, 2010).
- Ashcroft and Mermin (1976) N. W. Ashcroft and N. D. Mermin, Solid State Physics (Saunders College Publishing, Philadelphia, 1976).
- Heremans et al. (2008) J. P. Heremans, V. Jovovic, E. S. Toberer, A. Saramat, K. Kurosaki, A. Charoenphakdee, S. Yamanaka, and G. J. Snyder, Science 321, 554 (2008).
- Hicks and Dresselhaus (1993a) L. D. Hicks and M. S. Dresselhaus, Phys. Rev. B 47, 12727 (1993a).
- Hicks and Dresselhaus (1993b) L. D. Hicks and M. S. Dresselhaus, Phys. Rev. B 47, 16631 (1993b).
- Hébert et al. (2015) S. Hébert, D. Berthebaud, R. Daou, Y. Bréard, D. Pelloquin, E. Guilmeau, F. Gascoin, O. Lebedev, and A. Maignan, J. Phys.: Condens. Matter 28, 013001 (2015).
- Terasaki et al. (1997) I. Terasaki, Y. Sasago, and K. Uchinokura, Phys. Rev. B 56, R12685 (1997).
- Koshibae et al. (2000) W. Koshibae, K. Tsutsui, and S. Maekawa, Phys. Rev. B 62, 6869 (2000).
- Hébert et al. (2001) S. Hébert, S. Lambert, D. Pelloquin, and A. Maignan, Phys. Rev. B 64, 172101 (2001).
- Singh (2000) D. J. Singh, Phys. Rev. B 61, 13397 (2000).
- Yamamoto et al. (2002) T. Yamamoto, K. Uchinokura, and I. Tsukada, Phys. Rev. B 65, 184434 (2002).
- Botana et al. (2012) A. S. Botana, F. Tran, V. Pardo, D. Baldomir, and P. Blaha, Phys. Rev. B 85, 235118 (2012).
- Ohta et al. (2007) H. Ohta, S. Kim, Y. Mune, T. Mizoguchi, K. Nomura, S. Ohta, T. Nomura, Y. Nakanishi, Y. Ikuhara, M. Hirano, et al., Nat. Mater. 6, 129 (2007).
- Quintela et al. (2015) C. X. Quintela, J. P. Podkaminer, M. N. Luckyanova, T. R. Paudel, E. L. Thies, D. A. Hillsberry, D. A. Tenne, E. Y. Tsymbal, G. Chen, C.-B. Eom, et al., Adv. Mater. 27, 3032 (2015).
- Takahashi et al. (2012) R. Takahashi, R. Okazaki, Y. Yasui, I. Terasaki, T. Sudayama, H. Nakao, Y. Yamasaki, J. Okamoto, Y. Murakami, and Y. Kitajima, J. Appl. Phys. 112, 073714 (2012).
- Bach et al. (2013) P. L. Bach, J. M. Vila-Fungueiriño, V. Leborán, E. Ferreiro-Vila, B. Rodríguez-González, and F. Rivadulla, APL Mat. 1, 021101 (2013).
- Pardo et al. (2013) V. Pardo, A. S. Botana, and D. Baldomir, Phys. Rev. B 87, 125148 (2013).
- Saeed et al. (2014a) Y. Saeed, N. Singh, and U. Schwingenschlögl, Appl. Phys. Lett. 104, 033105 (2014a).
- Saeed et al. (2014b) Y. Saeed, N. Singh, and U. Schwingenschlögl, Appl. Phys. Lett. 105, 031915 (2014b).
- Hohenberg and Kohn (1964) P. Hohenberg and W. Kohn, Phys. Rev. 136, B864 (1964).
- Kohn and Sham (1965) W. Kohn and L. J. Sham, Phys. Rev. 140, A1133 (1965).
- Schwarz and Blaha (2003) K. Schwarz and P. Blaha, Comp. Mater. Sci. 28, 259 (2003).
- Sjöstedt et al. (2000) E. Sjöstedt, L. Nordström, and D. J. Singh, Solid State Commun. 114, 15 (2000).
- Blöchl et al. (1994) P. E. Blöchl, O. Jepsen, and O. K. Andersen, Phys. Rev. B 49, 16223 (1994).
- Wu and Cohen (2006) Z. Wu and R. E. Cohen, Phys. Rev. B 73, 235116 (2006).
- Nishimatsu et al. (2010) T. Nishimatsu, M. Iwamoto, Y. Kawazoe, and U. V. Waghmare, Phys. Rev. B 82, 134106 (2010).
- Tran and Blaha (2009) F. Tran and P. Blaha, Phys. Rev. Lett. 102, 226401 (2009).
- Koller et al. (2011) D. Koller, F. Tran, and P. Blaha, Phys. Rev. B 83, 195134 (2011).
- Dixit et al. (2012) H. Dixit, R. Saniz, S. Cottenier, D. Lamoen, and B. Partoens, J. Phys.: Condens. Mat. 24, 205503 (2012).
- Sarantopoulos et al. (2015) A. Sarantopoulos, E. Ferreiro-Vila, V. Pardo, C. Magén, M. H. Aguirre, and F. Rivadulla, Phys. Rev. Lett. 115, 166801 (2015).
- Singh and Nordstrom (2006) D. J. Singh and L. Nordstrom, Planewaves, Pseudopotentials, and the LAPW method (Springer Science & Business Media, 2006).
- Anisimov et al. (1997) V. I. Anisimov, F. Aryasetiawan, and A. I. Lichtenstein, J. Phys.: Condens. Mat. 9, 767 (1997).
- Gillen et al. (2013) R. Gillen, S. J. Clark, and J. Robertson, Phys. Rev. B 87, 125116 (2013).
- Madsen and Singh (2006) G. K. H. Madsen and D. J. Singh, Comp. Phys. Comm. 175, 67 (2006).
- Scheidemantel et al. (2003) T. J. Scheidemantel, C. Ambrosch-Draxl, T. Thonhauser, J. V. Badding, and J. O. Sofo, Phys. Rev. B 68, 125210 (2003).
- Anisimov et al. (1991) V. I. Anisimov, J. Zaanen, and O. K. Andersen, Phys. Rev. B 44, 943 (1991).
- Petukhov et al. (2003) A. G. Petukhov, I. I. Mazin, L. Chioncel, and A. I. Lichtenstein, Phys. Rev. B 67, 153106 (2003).
- Ziman (1972) J. M. Ziman, Principles of the theory of solids (Cambridge University Press, Cambridge, 1972).
- Zhou et al. (2011) J. Zhou, R. Yang, G. Chen, and M. S. Dresselhaus, Phys. Rev. Lett. 107, 226601 (2011).
- Pei et al. (2011) Y. Pei, X. Shi, A. LaLonde, H. Wang, L. Chen, and G. J. Snyder, Nature (London) 473, 66 (2011).
- Boukai et al. (2008) A. I. Boukai, Y. Bunimovich, J. Tahir-Kheli, J.-K. Yu, W. A. Goddard III, and J. R. Heath, Nature (London) 451, 168 (2008).
- Hochbaum et al. (2008) A. I. Hochbaum, R. Chen, R. D. Delgado, W. Liang, E. C. Garnett, M. Najarian, A. Majumdar, and P. Yang, Nature (London) 451, 163 (2008).
- Guo et al. (2006) H. Guo, J. Burgess, S. Street, A. Gupta, T. G. Calvarese, and M. A. Subramanian, Appl. Phys. Lett. 89, 022509 (2006).
- Manako et al. (1999) T. Manako, M. Izumi, Y. Konishi, K.-I. Kobayashi, M. Kawasaki, and Y. Tokura, Appl. Phys. Lett. 74, 2215 (1999).
- Valionis (2015) A. Valionis, “Epitaxial growth of complex metal oxides,” (Elsevier, Cambridge, 2015).
- Garrity (2016) K. F. Garrity, arxiv/1601.01622 (2016).