Present address: ]U.S. Army Research Laboratory, Adelphi, Maryland 20783, USA Present address: ]Lawrence Berkeley National Laboratory, Berkeley, California 94720, USA Present address: ]GSI Helmholtzzentrum für Schwerionenforschung, 64291 Darmstadt, Germany
Direct Evidence of Octupole Deformation in Neutron-Rich 144Ba
Abstract
The neutron-rich nucleus 144Ba (=11.5 s) is expected to exhibit some of the strongest octupole correlations among nuclei with mass numbers less than 200. Until now, indirect evidence for such strong correlations has been inferred from observations such as enhanced transitions and interleaving positive- and negative-parity levels in the ground-state band. In this experiment, the octupole strength was measured directly by sub-barrier, multi-step Coulomb excitation of a post-accelerated 650-MeV 144Ba beam on a 1.0-mg/cm2 208Pb target. The measured value of the matrix element, b3/2, corresponds to a reduced transition probability of 48() W.u. This result represents an unambiguous determination of the octupole collectivity, is larger than any available theoretical prediction, and is consistent with octupole deformation.
pacs:
27.60.+j, 25.70.De, 29.38.Gj, 23.20.Js, 23.20.-g, 21.10.KyThe concept of spontaneous symmetry breaking in the nuclear density distribution can be applied to the description of the collective properties of nuclei Frauendorf (2001). The coupling between pairs of nucleons occupying close-lying orbitals with can result in strong octupole correlations, which can break not only rotational but also reflection symmetry in the nuclear intrinsic frame Butler and Nazarewicz (1996). Nuclei in at least two regions of the nuclear chart have been identified where both valence protons and neutrons occupy such orbitals near the Fermi surface, and they are expected to exhibit signatures of strong octupole correlations. In fact, the strength of these correlations can be such that rotational bands with alternating parity appear, and these have been commonly interpreted in terms of the rotation of octupole-deformed nuclei. In the Ra-Th region, recent measurements of transition strengths in 220Rn and 224Ra Gaffney et al. (2013) have validated this interpretation; and the observed collective structure in 224Ra is associated with an octupole shape.
Evidence for octupole collectivity has been inferred in the region centered around neutron-rich Ba nuclei from -ray studies of fission fragments Phillips et al. (1986); Urban et al. (1997). Signatures such as the presence of both and enhanced transitions linking levels of the ground-state and negative-parity bands at low and moderate spin have been reported. These are consistent with expectations of strong octupole correlations, but whether these are sufficient to stabilize an octupole shape remains an open question which can be addressed by measurements of the strength. A measurement of the latter strength is best carried out via sub-barrier Coulomb excitation Gaffney et al. (2013), a technique that has only recently become available for nuclei in the Ba region as it requires the acceleration of short-lived, radioactive beams.
In this Letter, results from a multi-step Coulomb excitation experiment with a 144Ba beam are reported. Besides taking advantage of new capabilities of acceleration of a radioactive beam, the measurements also benefited from superior Doppler reconstruction enabled by the combination of highly-segmented particle counters with -ray tracking Paschalis et al. (2013) (CHICO2 and GRETINA, respectively—see below).
The experiment was conducted at the Argonne Tandem Linac Accelerator System (ATLAS). The 144Ba beam was produced by the CAlifornium Rare Ion Breeder Upgrade (CARIBU) consisting of a 1.7 Ci 252Cf fission source coupled to a He gas catcher capable of thermalizing and extracting the fission fragments with high efficiency before filtering them through an isobar separator Savard et al. (2015, 2008). To maximize the extraction of 144Ba from the system, the 2+ charge state was selected for subsequent production of the =144 beam. The latter was charge-bred in an Electron Cyclotron Resonance (ECR) ion source to charge state =28+ before acceleration through ATLAS. Unfortunately, a number of stable contaminants with approximately the same =5.14, originating from the ECR source, were present with the radioactive =144 beam. These were 180Hf35+, 134Xe26+, 113Cd22+, and 108Cd21+ and, additionally, 36Ar7+ which was intentionally injected into the source as a pilot beam for tuning purposes prior to the experiment.
The 650-MeV 144Ba beam was passed through a 5 mm diameter collimator which was positioned 10.2 cm upstream from a 1.0 mg/cm2-thick 208Pb target (99.86% isotopic purity). The front surface of the target was coated with a 6 g/cm2 Al layer and the back with 40 g/cm2 C. The radioactive beam current was monitored with a large HPGe detector positioned just behind the beam dump. The absolute beam intensity was estimated based on the yield of the 397-keV ray emitted following 144La decay (= 40.8 s Sonzogni (2001)) and determined to be 8103 144Ba ions per second.
The experimental setup included the Gamma-Ray Energy Tracking In-beam Nuclear Array (GRETINA) Paschalis et al. (2013) for -ray detection and CHICO2, a recently upgraded version of the Compact Heavy Ion COunter (CHICO) Simon et al. (2000), for charged-particle detection. CHICO2 is characterized by a much-improved (azimuthal) angular resolution over that of CHICO. It is composed of 20 parallel-plate avalanche counters (PPACs) arranged symmetrically around the beam axis. Each PPAC consists of an aluminized polypropylene anode and a pixelated cathode board with a position resolution (FWHM) of 1.6∘ in (polar angle) and 2.5∘ in . The fast anode signal (1.2 ns, FWHM) provides the time difference between 2 PPAC events and is used to distinguish between heavy and light reaction products, as well as to discriminate between the various beam contaminants. In addition, CHICO2 data provide the trajectories of the reaction products required for a precise event-by-event Doppler correction of the -ray information. This correction also relies on the performance of GRETINA, a spectrometer composed of 7 modules, each with 4 segmented HPGe detectors, where the segmentation allows for a position resolution of 4.5 mm (FWHM) Paschalis et al. (2013) and enables the tracking of multiple interactions by a single ray through the detector.
A time-of-flight (ToF) particle spectrum from CHICO2 and the corresponding -ray spectrum are presented in Fig. 1. The various beam contaminants can be identified, and the temporal and spatial resolutions are adequate to effectively separate them from the 144Ba beam, except for the =144 isobars and 134Xe. The right side of Fig. 1 displays the corresponding -ray spectrum from GRETINA, with the coincidence requirement of a =144 particle detected between 40∘ and 75∘. Clearly, the contaminants add significant complexity to the spectrum, particularly 134Xe whose 2+0+, 847-keV transition results in a significant background contribution under all the 144Ba rays of interest. Nevertheless, a number of 144Ba lines have been clearly associated with transitions from states with spin as high as 10. The spectrum includes deexcitations from negative-parity levels which are populated in Coulomb excitation primarily through excitations.

In extracting the yields of the various rays of interest, care was taken to identify all of the nearby contaminants, often through the use of additional gates in the ToF spectrum. This was especially important for the relatively weak transitions from negative-parity states. The extraction of those yields was further aided by prior knowledge of the corresponding -ray energies Sonzogni (2001). The two insets in the spectrum of Fig. 1 illustrate some of the results for the transitions 3-2+ (639.0 keV) and 9-8+ (302.1 keV) that were particularly challenging because of the presence of contaminants identified in the figure. The only ray that could not be individually resolved was the 5-4+ transition at 508.7 keV, close to the more intense 8+6+ one at 509.3 keV within 144Ba itself. For these two transitions, only the combined yield was considered in the Coulomb-excitation analysis. Nevertheless, despite the lack of direct decay information from the 5- level, the yield data from the 9- and 7- states above and the 3- level below it provided sufficient information to determine the relevant excitation probabilities by the various possible (coupled) channels.
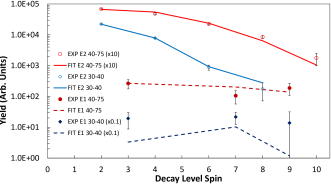
The -ray detection efficiency was measured with standard 182Ta, 152Eu, 136Cs, and 60Co sources under tracking conditions identical to those used in the experiment. Intensity ratios between the strongest peaks from 144Ba in the tracked spectrum were verified through comparison with those in the corresponding untracked spectrum. The efficiency-corrected -ray intensities and the associated uncertainties can be found in Fig. 2. For the Coulomb-excitation analysis, yields were extracted for two separate angular ranges, 30∘–40∘ and 40∘–75∘ (lab frame), as the available statistics did not allow for more restrictive intervals. The intensities for both ranges are displayed in the figure. Note that the measured angular distributions are such that the -ray yield associated with the transition deexciting the 10+ state could only be extracted in the 40∘–75∘ gate. Furthermore, in Fig. 2, the data sets measured for transitions in the 30∘–40∘ interval and for rays in the 40∘–75∘ one have been renormalized to facilitate their comparative display.
The experimental yields were analyzed with the semiclassical Coulomb-excitation code gosia Czosnyka et al. (1983); *GosiaManualURL which calculates transition intensities for a given set of experimental conditions and nuclear matrix elements. The latter are then varied until the set giving the best agreement with the data is found, based on a least-squares search. In the present analysis, states up to 14+ in the ground-state band and up to 15- in the negative-parity sequence were considered together with the associated , , and matrix elements, totaling 70 in all. The number of free parameters used to fit the limited data set was reduced by coupling the matrix elements according to the rigid-rotor prescription Phillips et al. (1986); Wollersheim et al. (1993). Although 144Ba is considered to have moderate deformation only (0.2), such a treatment has been validated theoretically for even less-deformed cases Robledo and Bertsch (2012). Furthermore, in the error analysis, the rigid-rotor constraint was released (see discussion below). For the least-squares minimization, the constraint requires that the elements for a given multipolarity are determined by a single parameter; e.g., the intrinsic dipole moment for matrix elements, and the quadrupole and octupole moments for the and elements, respectively. Here, the and matrix elements were each fit using a single parameter, while the elements for the 2+4+, 4+6+, and 6+8+ transitions were allowed to vary independently, but with constraints provided by lifetime data Mach et al. (1990); Shneidman et al. (2005); Biswas et al. (2005). All other elements were coupled to the 0+2+ one, where a precise lifetime is available for the 2+ state Sonzogni (2001). Available lifetime data as well as experimental branching ratios Sonzogni (2001) were also used to constrain the matrix elements (see below). Note that the computations with gosia include effects impacting the -ray angular distributions such as nuclear de-orientation, relativistic corrections, and detector geometry Czosnyka et al. (1983); *GosiaManualURL. As an independent check of the analysis, gosia was also used to calculate the -ray yield ratio of the 4+2+ and 2+0+ transitions in 134Xe, based on the experimental probabilities of Ref. Sonzogni (2004), for scattering angles between 40∘ and 75∘ (same as Fig. 1). The calculated ratio of 0.077 agrees well with the measured value of 0.078(4), providing added confidence in the analysis.
The measured 144Ba transition yields are compared with the best fit results in Fig. 2, while the associated and matrix elements can be found in Table 1. Quoted errors on the various fit values reflect both the uncertainties associated with the data and those originating from correlations between the various fit parameters—see Refs. Czosnyka et al. (1983); *GosiaManualURL; Ibbotson et al. (1997) for details. Note that the resulting matrix elements are constrained primarily by the available data Sonzogni (2001) on branching ratios in the decays from the states of interest and display little sensitivity to the Coulomb excitation yields. The matrix elements are also constrained well by both the available lifetime and branching ratio data, and this is reflected in the reported errors in Table 1. In this context, the matrix element governing the 2+4+ transition deserves some discussion. Three lifetime measurements for the 4+ state are available from the literature. Reference Mach et al. (1990) reports a 49(7) ps mean life measured with a fast-timing method following decay. Values of 74(4) ps Shneidman et al. (2005) and 71(6) Biswas et al. (2005), respectively, were determined in recoil-distance Doppler-shift measurements following 252Cf fission. The present analysis results in a better overall fit if the shorter lifetime from the decay study is used to constrain the fit rather than the larger values obtained in the fission studies. It is possible that the two measurements following fission suffer from difficulties in properly accounting for feeding into the 4+ level that are absent when the state is fed in decay. All in all, however, the fit results are consistent with the available lifetime data for the observed states.
| 1.042() | ||
| 1.860() | ||
| 1.78() | ||
| 2.04() | ||
| 0.65() | ||
The main goal of the present measurement was the determination of the excitation strength in 144Ba. Values derived from the fit for the matrix elements are given in Table 1. While most of these elements were not constrained well by the available yields, it was nevertheless possible to extract upper limits for the excitations to the 5- and 7- states as well as a value, albeit with sizeable error bars, for the 0+3- excitation. The latter value, 0.65() b3/2, corresponds to a reduced transition probability ;3-0+)=48() W.u. Note that this reported value was obtained under the assumption that the relative sign between the sets of electric dipole () and octupole () matrix elements is the same. In the event that these two sets are of opposite sign, the interference term in the calculated excitation probabilities Czosnyka et al. (1983); *GosiaManualURL; Wollersheim et al. (1993) would translate into a reduction in magnitude of 10% for the matrix element of interest; i.e., well within the quoted errors.
The newly measured strength can be compared with several theoretical values from the literature. In particular, the ;3- 0+) probability has been calculated using various beyond mean-field approaches Egido and Robledo (1990, 1991); Robledo et al. (2010). The largest predicted value is =20 W.u. Egido and Robledo (1990). Additionally, and most recently, this quantity has been calculated with an algebraic approach where a mean-field potential energy surface was mapped onto an interacting boson model (IBM) Hamiltonian Nomura et al. (2014). The latter yielded a similar value of =24 W.u.; the largest strength predicted in 144Ba to date.
Besides the probability, the transition octupole moment has been calculated using a cluster model Shneidman et al. (2005). As mentioned earlier, the present analysis assumes the rotational limit which implies an intrinsic octupole moment with a simple relationship to the transition matrix elements. The present measurement gives a value =1.73()103 fm3 compared to the prediction in Ref. Shneidman et al. (2005) of 1.409103 fm3. The latter provides the closest agreement of any calculated value, although it is based on completely different model assumptions. Nevertheless the error bar on the measured value, as mentioned earlier, does include correlations with various other matrix elements free from the constraints provided by the rigid-rotor assumption, making it essentially model-independent. The removal of this constraint in the error analysis is, at least partially, responsible for the fact that only upper limits on the and matrix elements could be determined (Table 1).
Going a step further, the octupole moment can be related (with the standard assumption of axial symmetry) to the commonly-used shape parameters Leander and Chen (1988) describing the nuclear surface as an expansion of the spherical harmonics. Using the quadrupole and octupole moments from the fit, a value of 0.17() is derived for the octupole shape parameter (with =0.18; the quadrupole moment being largely constrained by the measured 2+ lifetime Sonzogni (2001)), under the assumption that and higher terms in the deformation can be neglected. Generally speaking, such terms are expected to deviate significantly from 0 and may play an important role in the overall nuclear shape and binding energy Sobiczewski et al. (1988); Cwiok and Nazarewicz (1989), however their relationship to the octupole moment is 2nd-order when compared to Leander and Chen (1988). Indeed, variations of within a reasonable range (0 to 0.20), result in a small effect on (10% for fixed ).
The conversion to enables comparisons with several additional theoretical studies within mean-field approaches Nomura et al. (2014); Nazarewicz et al. (1984); Sobiczewski et al. (1988); Möller et al. (1995); Zhang et al. (2010); Wang et al. (2015). The largest value is calculated in Ref. Möller et al. (1995) with =0.126. As a matter of fact, Ref. Möller et al. (1995) presents a comprehensive calculation of ground state shapes for 8979 nuclei, covering most of the nuclear landscape, up to =339. The measured value is larger than any calculated one for nuclei with 316, although a number of measured strengths for nuclei with 60 have indicated larger values Wollersheim et al. (1993) than those computed. Considering the various theoretical calculations of octupole-related parameters for 144Ba, the computed values systematically under-predict the present experimental results; the average calculated deformation between Refs. Nomura et al. (2014); Nazarewicz et al. (1984); Sobiczewski et al. (1988); Möller et al. (1995); Zhang et al. (2010); Wang et al. (2015) is less than 0.11, differing from the measured value by more than 1 standard deviation. Therefore, generally speaking, octupole correlations in 144Ba are likely stronger than the models imply, however the large uncertainty on the present result does not allow one to elaborate further.
In conclusion, a number of new developments; i.e., the first post-acceleration of a 144Ba beam combined with the enhanced performance provided by particle detection with high angular sensitivity by CHICO2 and the -ray tracking ability of the GRETINA array proved vital to the success of this measurement. With the determination of the 144Ba matrix element b3/2, this measurement provides the first direct experimental evidence for significantly enhanced strength of octupole correlations in the region centered around neutron-rich Ba nuclei. Moreover, despite significant uncertainties on the measurement, the data also indicate an octupole strength larger than calculated in various theoretical approaches.
This work was funded by the U.S. Department of Energy, Office of Science, Office of Nuclear Physics, under Contract no. DE-AC02-06CH11357 (ANL), DE-AC02-05CH11231 (LBNL, GRETINA), DE-AC52-07NA27344 (LLNL), DOE Grant No. DE-FG02-94ER40834 (UM), and the National Science Foundation Grant No. PHY-01401574 (FSU) and PHY-1068192 (ND). M.S. and E.T.G. were supported by STFC (UK) Grant No. ST/L005808/1. This research used resources of ANL’s ATLAS facility, which is a DOE Office of Science User Facility.
References
- Frauendorf (2001) S. Frauendorf, Rev. Mod. Phys. 73, 463 (2001).
- Butler and Nazarewicz (1996) P. A. Butler and W. Nazarewicz, Rev. Mod. Phys. 68, 349 (1996).
- Gaffney et al. (2013) L. P. Gaffney, P. A. Butler, M. Scheck, A. B. Hayes, F. Wenander, M. Albers, B. Bastin, C. Bauer, A. Blazhev, et al., Nature (London) 497, 199 (2013).
- Phillips et al. (1986) W. R. Phillips, I. Ahmad, H. Emling, R. Holzmann, R. V. F. Janssens, T.-L. Khoo, and M. W. Drigert, Phys. Rev. Lett. 57, 3257 (1986).
- Urban et al. (1997) W. Urban, M. A. Jones, J. L. Durell, M. Leddy, W. R. Phillips, A. G. Smith, B. J. Varley, I. Ahmad, L. Morss, M. Bentaleb, et al., Nucl. Phys. A 613, 107 (1997).
- Paschalis et al. (2013) S. Paschalis, I. Y. Lee, A. O. Macchiavelli, C. M. Campbell, M. Cromaz, S. Gros, J. Pavan, J. Qian, R. M. Clark, et al., Nucl. Instrum. Methods A 709, 44 (2013).
- Savard et al. (2015) G. Savard, A. Levand, R. Pardo, R. Vondrasek, and B. Zabransky, JPS Conf. Proc. 6, 010008 (2015).
- Savard et al. (2008) G. Savard, S. Baker, C. Davids, A. F. Levand, E. F. Moore, R. C. Pardo, R. Vondrasek, B. J. Zabransky, and G. Zinkann, Nucl. Instrum. Methods B 266, 4086 (2008).
- Sonzogni (2001) A. A. Sonzogni, Nucl. Data Sheets 93, 599 (2001).
- Simon et al. (2000) M. W. Simon, D. Cline, C. Y. Wu, and R. W. Gray, Nucl. Instrum. Methods A 452, 205 (2000).
- Mach et al. (1990) H. Mach, W. Nazarewicz, D. Kusnezov, M. Moszyński, B. Fogelberg, M. Hellstrom, L. Spanier, R. L. Gill, R. F. Casten, and A. Wolf, Phys. Rev. C 41, R2469 (1990).
- Shneidman et al. (2005) T. M. Shneidman, R. V. Jolos, R. Krücken, A. Aprahamian, D. Cline, J. R. Cooper, M. Cromaz, R. M. Clark, C. Hutter, et al., Eur. Phys. J. A 25, 387 (2005).
- Biswas et al. (2005) D. C. Biswas, A. G. Smith, R. M. Wall, D. Patel, G. S. Simpson, D. M. Cullen, J. L. Durell, S. J. Freeman, J. C. Lisle, et al., Phys. Rev. C 71, 011301 (2005).
- Czosnyka et al. (1983) T. Czosnyka, D. Cline, and C. Y. Wu, Am. Phys. Soc. 28, 745 (1983), and the user manual.
- (15) http://www.pas.rochester.edu/~cline/Gosia/Gosia_Manual_20120510.pdf, accessed March 2014.
- Wollersheim et al. (1993) H. J. Wollersheim, H. Emling, H. Grein, R. Kulessa, R. S. Simon, C. Fleischmann, J. de Boer, E. Hauber, C. Lauterbach, et al., Nucl. Phys. A 556, 261 (1993).
- Robledo and Bertsch (2012) L. M. Robledo and G. F. Bertsch, Phys. Rev. C 86, 054306 (2012).
- Sonzogni (2004) A. A. Sonzogni, Nucl. Data Sheets 103, 1 (2004).
- Ibbotson et al. (1997) R. W. Ibbotson, C. A. White, T. Czosnyka, P. A. Butler, N. Clarkson, D. Cline, R. A. Cunningham, M. Devlin, K. G. Helmer, et al., Nucl. Phys. A 619, 213 (1997).
- Egido and Robledo (1990) J. L. Egido and L. M. Robledo, Nucl. Phys. A 518, 475 (1990).
- Egido and Robledo (1991) J. L. Egido and L. M. Robledo, Nucl. Phys. A 524, 65 (1991).
- Robledo et al. (2010) L. M. Robledo, M. Baldo, P. Schuck, and X. Viñas, Phys. Rev. C 81, 034315 (2010).
- Nomura et al. (2014) K. Nomura, D. Vretenar, T. Nikšić, and B.-N. Lu, Phys. Rev. C 89, 024312 (2014).
- Leander and Chen (1988) G. A. Leander and Y. S. Chen, Phys. Rev. C 37, 2744 (1988).
- Sobiczewski et al. (1988) A. Sobiczewski, Z. Patyk, S. Cwiok, and P. Rozmej, Nucl. Phys. A 485, 16 (1988).
- Cwiok and Nazarewicz (1989) S. Cwiok and W. Nazarewicz, Nucl. Phys. A 496, 367 (1989).
- Nazarewicz et al. (1984) W. Nazarewicz, P. Olanders, I. Ragnarsson, J. Dudek, G. A. Leander, P. Moller, and E. Ruchowska, Nucl. Phys. A 429, 269 (1984).
- Möller et al. (1995) P. Möller, J. R. Nix, W. D. Myers, and W. J. Swiatecki, At. Data Nucl. Data Tables 59, 185 (1995).
- Zhang et al. (2010) W. Zhang, Z. P. Li, and S. Q. Zhang, Chin. Phys. C 34, 1094 (2010).
- Wang et al. (2015) H.-L. Wang, J. Yang, M.-L. Liu, and F.-R. Xu, Phys. Rev. C 92, 024303 (2015).