Carbon Chains and Methanol toward Embedded Protostars***Based on observations carried out with the IRAM 30m Telescope. IRAM is supported by INSU/CNRS (France), MPG (Germany) and IGN (Spain).
Abstract
Large interstellar organic molecules are potential precursors of prebiotic molecules. Their formation pathways and chemical relationships with one another and simpler molecules are therefore of great interest. In this paper, we address the relationship between two classes of large organic molecules, carbon chains and saturated complex organic molecules (COMs), at the early stages of star formation through observations of C4H and CH3OH. We surveyed these molecules with the IRAM 30m telescope toward 16 deeply embedded low-mass protostars selected from the Spitzer ice survey. We find that CH3OH and C4H are positively correlated indicating that these two classes of molecules can coexist during the embedded protostellar stage. The C4H/CH3OH gas abundance ratio tentatively correlates with the CH4/CH3OH ice abundance ratio in the same lines of sight. This relationship supports a scenario where carbon chain formation in protostellar envelopes begins with CH4 ice desorption.
Subject headings:
Astrochemistry – ISM: molecules – stars: formation – stars: protostars1. Introduction
Large organic molecules have been widely observed across different stages of star-formation (Herbst & van Dishoeck, 2009; Sakai & Yamamoto, 2013). Their chemistry is of great interest because large interstellar molecules may serve as precursors to prebiotic chemistry on nascent planets. Large organic molecules also have a great potential as molecular probes. In general, molecular abundance patterns contain information about the past and current environment where they reside. This relationship can be exploited to constrain interstellar environments using molecular line observations, if the chemistry of the target molecule is well understood. Larger molecules present numerous rotational lines at millimeter and centimeter wavelengths and are therefore especially appropriate from an excitation point of view. They suffer, however, from an often poorly constrained formation chemistry.
In this paper we explore how the relationship of two kinds of larger organic molecules constrain their chemistry. Interstellar organics are classified as either saturated organic molecules or unsaturated carbon chains. When saturated organic molecules reach sizes of 6 atoms or greater, they are known as complex organic molecules (COMs). These two classes of molecules have been generally supposed to form and exist in very different interstellar and circumstellar environments (Herbst & van Dishoeck, 2009).
Carbon chain molecules were first observed in the cold, dark cloud TMC-1 in the form of cyanopolyynes (Little et al., 1977; Kroto et al., 1978; Broten et al., 1978). In these environments, carbon chains form through efficient low-temperature ion-molecule reactions in the gas phase (Herbst & Leung, 1989; Ohishi & Kaifu, 1998). In 2008, Sakai et al. detected the first evidence of carbon chains in an unexpected region - the warm, inner regions of a low-mass protostar. Detections toward a second source (Sakai et al., 2009a) suggested that carbon chains are common toward some classes of protostars. The term “warm carbon chain chemistry” (WCCC) was coined to describe this type of source. Based on low-temperature modeling, ion-molecule chemistry and chemical inheritance are not sufficient to produce the high abundances of carbon chains observed in WCCC sources. Sakai et al. (2008) proposed that additional carbon chains can be formed in protostellar envelopes when methane (CH4), a common interstellar ice, sublimates at 25 K (Öberg et al., 2008). In the gas phase, CH4 reacts with C+ to efficiently form carbon chains. This theory has been validated by chemical models (Aikawa et al., 2012; Hassel et al., 2011).
COMs were initially observed in hot cores present toward high-mass protostars (Blake et al., 1987). During the past two decades it has become clear, however, that COMs are abundant in many other circumstellar and interstellar environments as well (see e.g. Cazaux et al., 2003; Arce et al., 2008). COMs have even been detected toward cold cloud cores, the traditional site of formation for carbon chains, (Öberg et al., 2010; Bacmann et al., 2012; Cernicharo et al., 2012). Based on experiments and models, COMs form efficiently on grain surfaces through energetic processing of simple ices and are released into the gas phase via thermal or non-thermal processes (Garrod & Herbst, 2006; Garrod et al., 2008; Öberg et al., 2009b). Recent theoretical work has shown that COMs may also be formed in the gas-phase following the desorption of methanol (CH3OH) (Balucani et al., 2015).
Both models and observations thus reveal that both carbon chains and complex organics can form at a range of temperatures and may therefore coexist in some sources. Based on a small source sample (2 WCCC sources and 3 hot corinos), Sakai et al. (2008, 2009a) found that carbon chains and COMs are not detected in large abundances in the same low-mass protostellar sources, however. They suggest that this anti-correlation stems from differences in star formation time scales, which results in different compositions of the ice grains in the protostellar envelope, for WCCC vs. hot corino sources. If the starless core phase is short, the bulk of the carbonaceous ice form from accretion of C atoms. The carbon atoms are hydrogenated to form CH4 and the release of CH4 during protostellar formation promotes warm carbon chain chemistry. If the starless core is long-lived, most of the carbon atoms in the gas phase have had time to react and form CO, resulting in a CO dominated ice. The formation of CH3OH is through CO hydrogenation and CH3OH is the starting point of COM chemistry on grains (Sakai & Yamamoto, 2013).
In this study, we explore the relationship between the COM precursor CH3OH and prototypical carbon chain C4H in a sample of embedded protostars, selected from the Spitzer (cores to disk) ice survey. We further explore the relationship between C4H and CH3OH, and ice abundances in the same lines of sight. In §2, we describe our source sample and selection criteria. The IRAM 30m observations are described in §3. The results and discussion are in §4 and §5 and the conclusions can be found in §6.
2. Sample Selection
Our sources were selected from the Spitzer ice sample (Evans et al., 2003; Boogert et al., 2008). From the 51 sources in the Spitzer ice sample presented in Boogert et al. (2008), we initially constrained ourselves to the northern low-mass sources as they are easily observable with the IRAM 30m, leaving us with 26 sources. The sources are characterized into different classes based on their spectral energy distributions, and in particular their IR spectral indices, , defined as the slope between 2 and 24 m. We chose sources with , which defines class 0/I sources (Wilking et al., 2001). These sources are often, but not always, associated with young, embedded YSOs; this cut left us with 19 sources. We then removed B1-b, IRAS 03301+3111, and EC 92 from our sample. B1-b was removed as previous observations of this source exist, IRAS 03301+3111 was removed as the upper limits on the ice abundances did not place any strong constraints on the data, and EC 92 was removed because it was not resolvable from SVS 4–5 within the beam of the IRAM 30m.
Table 1 lists the source coordinates, bolometric luminosities, envelope masses and the IR SED indices, together with the H2O, CH4, and CH3OH ice abundances of our final sample. Our sources span from 0.34 – 2.70 and are situated in the Perseus, Taurus, Serpens, L1014, and CB244 clouds. The envelope masses are between 0.1 – 17.7 M⊙, and bolometric luminosities are between 0.32 – 38 L⊙. Previous observations of WCCC sources fall within our range of bolometric luminosities (Andre et al., 2000; Chen et al., 1997). The H2O ice column is between cm-2 and the and are 2–25% and 1.6–11%, respectively. Six of our sources (B1-a, B5 IRS 1, L1489 IRS, IRAS 04108+2803, SVS 4-5, and IRAS 03235+3004) were part of a study by Öberg et al. (2014) on COMs, including CH3OH, in low-mass protostars. For these sources, we recalculate the CH3OH column densities using the CH3OH integrated line intensities from Öberg et al. (2014) and our rotation diagram method.
3. Observations
| Source | R.A. | Dec | Cloud | Lbol | Menv | X | X | ||
|---|---|---|---|---|---|---|---|---|---|
| (J2000.0) | (J2000.0) | L⊙ | M⊙ | 1018 cm-2 | % H2O | % H2O | |||
| B1-ad | 03:33:16.67 | 31:07:55.1 | Perseus | 1.3e | 2.8e | 1.87 | 10.39 [2.26] | 1.9 | 5.7 |
| SVS 4-5d | 18:29:57.59 | 01:13:00.6 | Serpens | 38f | – | 1.26 | 5.65 [1.13] | 25.2 [3.5] | 6.1 [1.7] |
| B1-c | 03:33:17.89 | 31:09:31.0 | Perseus | 3.7e | 17.7e | 2.66 | 29.55 [5.65] | 7.1 | 5.4 [1.4] |
| IRAS 23238+7401 | 23:25:46.65 | 74:17:37.2 | CB244 | – | – | 0.95 | 12.95 [2.26] | 3.6 | 7.4 |
| L1455 IRS3 | 03:28:00.41 | 30:08:01.2 | Perseus | 0.32e | 0.2g | 0.98 | 0.92 [0.37] | 12.5 | – |
| B5 IRS 1d | 03:47:41.61 | 32:51:43.8 | Perseus | 4.7e | 4.2e | 0.78 | 2.26 [0.28] | 3.7 | – |
| L1455 SMM1 | 03:27:43.25 | 30:12:28.8 | Perseus | 3.1e | 5.3e | 2.41 | 18.21 [2.82] | 13.5 | 5.8 [0.9] |
| IRAS 03245+3002 | 03:27:39.03 | 30:12:59.3 | Perseus | 7.0e | 5.3e | 2.70 | 39.31 [5.65] | 9.8 | 1.7 [0.3] |
| L1014 IRS | 21:24:07.51 | 49:59:09.0 | L1014 | – | – | 1.28 | 7.16 [0.91] | 3.1 [0.8] | 7.1 [2.3] |
| IRAS 04108+2803d | 04:13:54.72 | 28:11:32.9 | Taurus | 0.62h | – | 0.90 | 2.87 [0.4] | 3.5 | 11 |
| IRAS 03235+3004d | 03:26:37.45 | 30:15:27.9 | Perseus | 1.9e | 2.4e | 1.44 | 14.48 [2.26] | 4.2 [1.2] | 4.3 [1.4] |
| L1489 IRSd | 04:04:43.07 | 26:18:56.4 | Taurus | 3.7h | 0.1i | 1.10 | 4.26 [0.51] | 4.9 [1.5] | 3.1 [0.2] |
| HH 300 | 04:26:56.30 | 24:43:35.3 | Taurus | 1.27h | 0.03j | 0.79 | 2.59 [0.25] | 6.7 | 14 |
| IRAS 03271+3013 | 03:30:15.16 | 30:23:48.8 | Perseus | 0.8e | 1.2e | 2.06 | 7.69 [1.76] | 5.6 | 1.6 |
| L1448 IRS1 | 03:25:09.44 | 30:46:21.7 | Perseus | 17.0e | 16.3e | 0.34 | 0.47 [0.16] | 14.9 | – |
| IRAS 03254+3050 | 03:28:34.51 | 31:00:51.2 | Perseus | – | 0.3e | 0.90 | 3.66 [0.47] | 4.6 | 4.0 |
All sources were observed with the IRAM 30m telescope using the EMIR 90 GHz receiver and the Fourier Transform Spectrometer (FTS) backend. Six of the sources (B1-a, B5 IRS 1, L1489 IRS, IRAS 04108+2803, SVS 4-5, and IRAS 03235+3004) were observed on June 12 – 16, 2013 at 93 – 101 GHz and 109 – 117 GHz. The remaining sources were observed on July 23 – 28, 2014 at 92 – 100 GHz and 108 – 116 GHz. The spectral resolution for both sets of observations was 200 kHz and the sideband rejection was dB (Carter et al., 2012).
The pointing accuracy was checked every 1–2 hrs and found to be within 2′′-3′′. Focus, which was checked every 4 hrs, remained stable with corrections of mm. For the data set obtained in June 2013, both the position switching and wobbler switching modes were used during observations, but the position switching spectra has been excluded from this paper because of severe baseline instabilities; only wobbler switching was used for the July 2014 observations with a wobbler throw of 2′. We exclude IRAS 03254+3050 from further analysis due to significant self-absorption in the molecular targets of this study. No other source displayed signs of self-absorption in CH3OH or C4H. We also inspected the shapes of stronger lines, e.g. CN, in individual integrations and found no self-absorption in any high-density tracing line. This indicates a lack of dense material in the off-position and therefore a low probability of CH3OH and C4H-emitting, material in the wobble off-positions.
The spectra were reduced using CLASS†††http://www.iram.fr/IRAMFR/GILDAS with a global baseline fit to each 4 GHz spectral chunk using four to seven line-free windows. Individual scans were baseline subtracted and averaged, and antenna temperature, , was converted to main beam temperature, , by applying forward and beam efficiency values of 0.95 and 0.81. Using literature source velocities, the spectra were converted to rest frequency with additional adjustments made based on the CH3OH 2-1 ladder. The CH3OH 2-1 ladder emission was compared with previous observations for a subset of sources and was found to agree within 10% (Öberg et al., 2009a).
4. Results
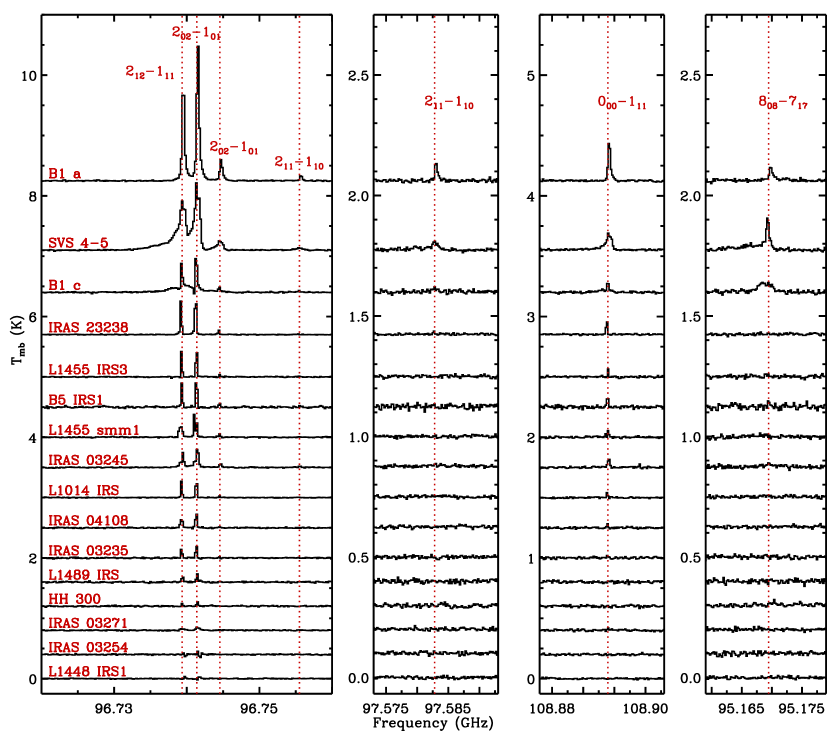
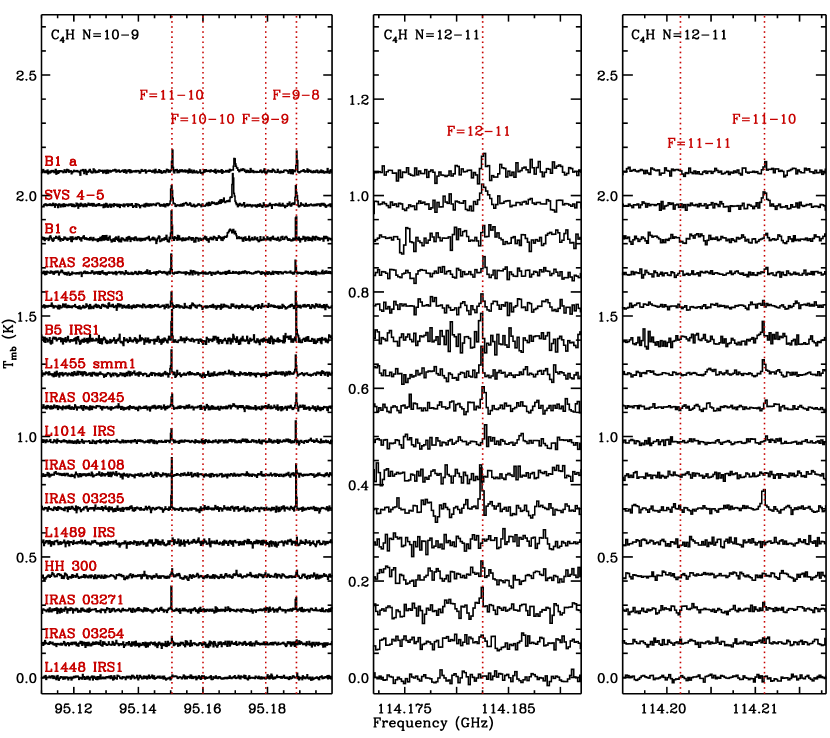
CH3OH is detected in all 15 analyzed sources and C4H in 13 sources at greater than 3. Two C4H upper limits are also reported. Figures 1 and 2 display the CH3OH and C4H lines toward all observed sources. For ease of comparison, the CH3OH lines in Figure 1 are ordered in decreasing CH3OH brightness from the top. Figure 2 is ordered identically. Tables 2 and 3 list the integrated intensity of the CH3OH and C4H lines, respectively. The integrated intensity of CH3OH lines of sources studied by Öberg et al. (2014) can be found in Table 2 of that paper. Most CH3OH and all C4H lines could be fit by a single Gaussian. Toward SVS 4-5 and B1-c, the CH3OH lines display substantial wings, probably due to outflows in the beam, and these features were fit with 2–3 Gaussian components. Only the narrow central Gaussian components were used to derived the listed column densities, since their properties agreed the best with the C4H line characteristics in the same lines of sight.
| 95.914 GHz | 96.739 GHz | 96.741 GHz | 96.745 GHz | 96.756 GHz | 97.583 GHz | 108.894 GHz | |
|---|---|---|---|---|---|---|---|
| Source | 212-111 | 212-111 | 202-101 | 202-101 | 211-110 | 211-110 | 000-111 |
| B1-c | 0.013 | 0.361[0.004] | 0.481[0.004] | 0.069[0.004] | 0.022[0.003] | 0.012 | 0.065[0.004] |
| IRAS 23238+7401 | 0.005 | 0.430[0.011] | 0.591[0.027] | 0.056[0.002] | – | 0.003 | 0.090[0.003] |
| L1455 IRS3 | – | 0.300[0.007] | 0.387[0.005] | 0.022[0.004] | 0.006 | – | 0.040[0.003] |
| L1455 SMM1 | 0.005 | 0.297[0.008] | 0.452[0.009] | 0.048[0.004] | 0.005 | – | 0.050[0.004] |
| IRAS 03245+3002 | – | 0.250[0.021] | 0.421[0.015] | 0.063[0.003] | 0.021[0.004] | 0.006 | 0.083[0.004] |
| L1014 IRS | – | 0.200[0.002] | 0.254[0.010] | 0.018[0.003] | 0.003 | – | 0.023[0.003] |
| HH 300 | 0.011 | 0.027[0.005] | 0.057[0.005] | – | – | – | 0.014 |
| IRAS 03271+3013 | – | 0.051[0.007] | 0.088[0.005] | 0.008 | 0.004 | – | 0.005 |
| L1448 IRS1 | – | 0.034[0.004] | 0.029[0.006] | 0.005 | – | – | – |
| 95.150 GHz | 95.189 GHz | 114.183GHz | 114.221 GHz | |
|---|---|---|---|---|
| Source | N=10-9, F=11-10 | N=10-9, F=9-8 | N=12-11, F=12-11 | N=12-11, F=11-10 |
| B1-a | 0.088[0.005] | 0.094[0.004] | 0.054[0.012] | 0.036[0.010] |
| SVS 4-5 | 0.142[0.007] | 0.130[0.008] | 0.090[0.013] | 0.112[0.010] |
| B1-c | 0.119[0.008] | 0.111[0.004] | 0.027 | 0.023 |
| IRAS 23238+7401 | 0.066[0.004] | 0.047[0.003] | 0.031[0.005] | 0.027[0.006] |
| L1455 IRS3 | 0.055[0.005] | 0.041[0.004] | 0.017 | 0.019 |
| B5 IRS 1 | 0.138[0.008] | 0.124[0.010] | 0.059[0.010] | 0.068[0.016] |
| L1455 SMM1 | 0.092[0.010] | 0.081[0.005] | 0.041[0.006] | 0.061[0.009] |
| IRAS 03245+3002 | 0.070[0.005] | 0.061[0.007] | 0.052[0.009] | 0.023[0.007] |
| L1014 IRS | 0.054[0.005] | 0.062[0.006] | 0.19[0.003] | 0.012 |
| IRAS 04108+2803 | 0.022[0.003] | 0.030[0.007] | 0.017 | – |
| IRAS 03235+3004 | 0.163[0.003] | 0.147[0.004] | 0.062[0.005] | 0.106[0.007] |
| L1489 IRS | – | 0.013 | – | – |
| HH 300 | 0.047[0.006] | 0.038[0.005] | 0.021 | 0.022 |
| IRAS 03271+3013 | 0.062[0.004] | 0.055[0.010] | 0.043[0.011] | 0.022[0.006] |
| L1448 IRS1 | – | – | – | 0.016 |
| Source | N(CH3OH) | Trot(CH3OH)a | N(C4H) | Trot(C4H)a | |
|---|---|---|---|---|---|
| 1013 cm-2 | K | 1013 cm-2 | K | ||
| B1-ab | 44 [14] | 13 [3] | 11.9 [2.8] | 22 [4] | |
| SVS 4-5b | 49 [19] | 13 [4] | 10.6 [2.1] | 35 [8] | |
| B1-c | 7.3 [2.2] | 17 [5] | 13.3 [0.7] | 24 [5] | |
| IRAS 23238+7401 | 9.4 [4.4] | 12 [5] | 6.7 [1.0] | 23 [3] | |
| L1455 IRS3 | 5.9 [3.6] | 10 [4] | 5.5 [0.5] | 24 [5] | |
| B5 IRS 1b | 7.7 [2.0] | 13 [6] | 17.4 [2.6] | 22 [2] | |
| L1455 SMM1 | 6.4 [3.3] | 13 [6] | 8.8 [2.8] | 26 [7] | |
| IRAS 03245+3002 | 6.6 [1.2] | 17 [3] | 7.6 [3.5] | 24 [9] | |
| L1014 IRS | 3.7 [2.4] | 11 [6] | 15.8 [4.2] | 16 [2] | |
| IRAS 04108+2803b | 4.5 [1.9] | 12 [4] | 3.1 [0.4] | 24 [5] | |
| IRAS 03235+3004b | 5.1 [0.3] | 13 [2] | 18.3 [7.4] | 24 [7] | |
| L1489 IRSb | 3.0 [0.6] | 13 [2] | 1.5 | 24 [5] | |
| HH 300 | 1.0 [0.4] | 13 [2] | 4.9[0.6] | 24 [5] | |
| IRAS 03271+3013 | 1.8 [0.2] | 13 [2] | 6.9 [2.5] | 27 [7] | |
| L1448 IRS1 | 1.0 [0.2] | 13 [2] | 3.6 | 24 [5] |
aTrot values in italics are assumed rotational temperatures and are based on the average Trot in the source with standard deviation errors. The listed errors are the 1 uncertainty. bSources observed by Öberg et al. (2014)
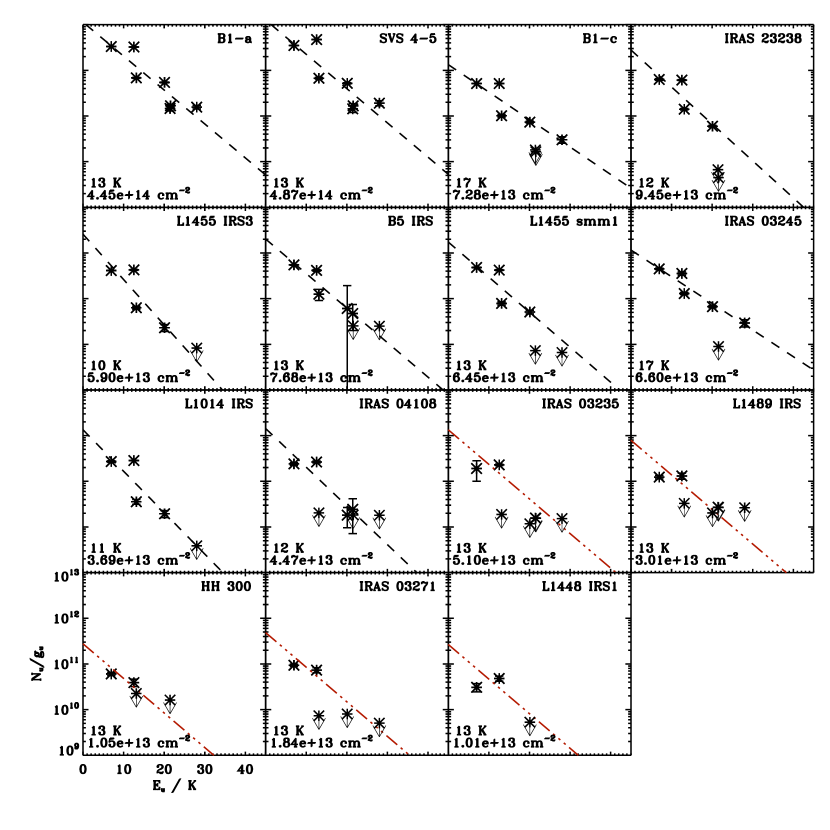
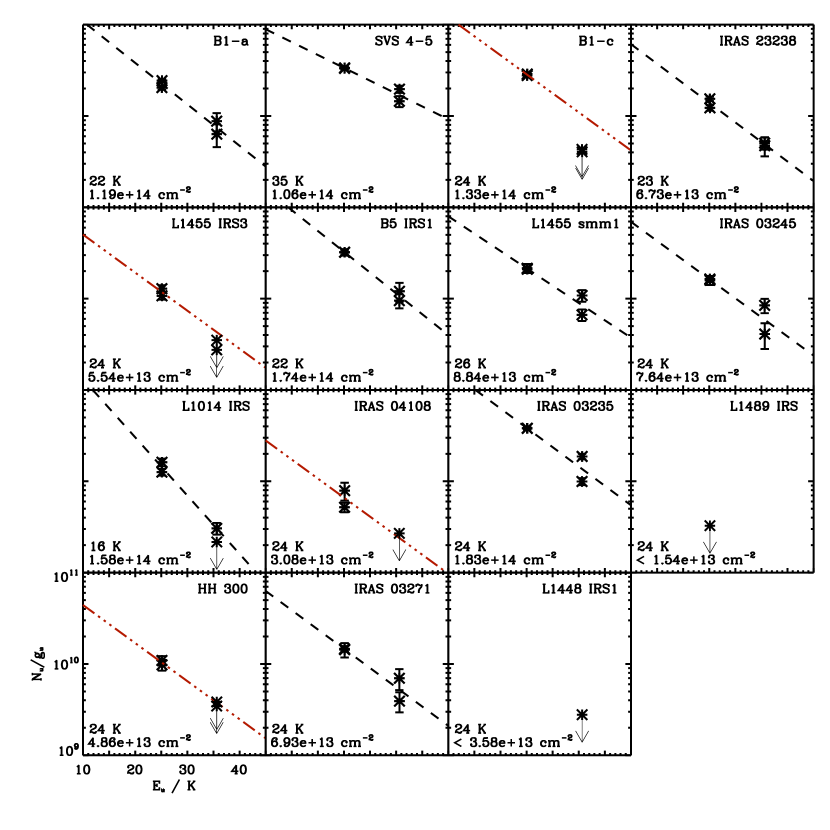
To determine the column densities of CH3OH and C4H, we used the rotation diagram method of Goldsmith & Langer (1999) and assumed optically thin lines and local thermodynamic equilibrium (LTE) at a single temperature. Figures 3 and 4 display the rotation diagrams obtained for CH3OH and C4H, respectively. Sources observed by Öberg et al. (2014) were refit using a single-component rotation diagram to be consistent with the column density determinations of C4H and the new CH3OH observations.
Table 4 lists the derived column densities and rotational temperature obtained from the rotation diagram analysis. In situations where there were not enough lines with SNR 3, the rotational temperature is assumed to be the average of the observed rotational temperatures; in these cases, Trot is italicized. On average, Trot for CH3OH is 13 2 K and 24 5 K for C4H. It is important to note that for this class of objects the CH3OH rotational temperatures do not necessarily reflect the kinetic temperatures, but are rather lower limits (Öberg et al., 2014). The difference in excitation temperature for CH3OH and C4H can thus not be used to constrain the relative emission regions of CH3OH and C4H.

The observed column density distributions of C4H and CH3OH are displayed in Figure 5 along with their respective average column densities. The column densities of both species span approximately an order of magnitude and the average column densities of 9.1 1013 cm-2 and 1.0 1014 cm-2 for C4H and CH3OH, respectively are similar. The WCCC sources from Sakai et al. (2008, 2009a, 2009b) overlap with the high end of our C4H distribution. Classical hot corino sources (Maret et al., 2005; Sakai et al., 2009a) overlap with the high-end of the CH3OH distribution and the low end of our distribution for C4H. However, as is seen below, classical hot corino sources form a distinct sub-group when simultaneously taking into account the column densities of both species, compared to any sources in our sample.
Figure 6 displays the column density correlation plots for CH3OH and C4H, both absolute and normalized to the H2O ice column. As H2O ice is the first ice to form and the last to desorb during star-formation, its column should be a good proxy of the envelope material in the line of sight (Boogert et al., 2015).
For both column density correlation plots, there appears to be a positive correlation. To determine the statistical significance of the correlation, a Spearman’s (rho) rank correlation tests were performed. The absolute column densities are not significantly correlated. By contrast, the normalized (to water ice) column densities are significantly positively correlated at the 99% level applying the Spearman’s rank correlation test.
In Figure 6, the warm carbon chain source, L1527, is displayed as a teal square and falls within our observed columns for both CH3OH and C4H (Sakai et al., 2008, 2009b). The red diamonds display three classic hot corino sources (Maret et al., 2005; Sakai et al., 2009b). The three hot corino sources and the WCCC source L1527 in Figure 6 display an anti-correlation. This is consistent with the anti-correlation noted by Sakai et al. (2008). When combing the hot corino and WCCC sources with our sample, we see two distinct regions: a positive correlation for low to medium column densities of CH3OH, while the hot corino sources occupy a unique space characterized by high CH3OH and low C4H column densities.
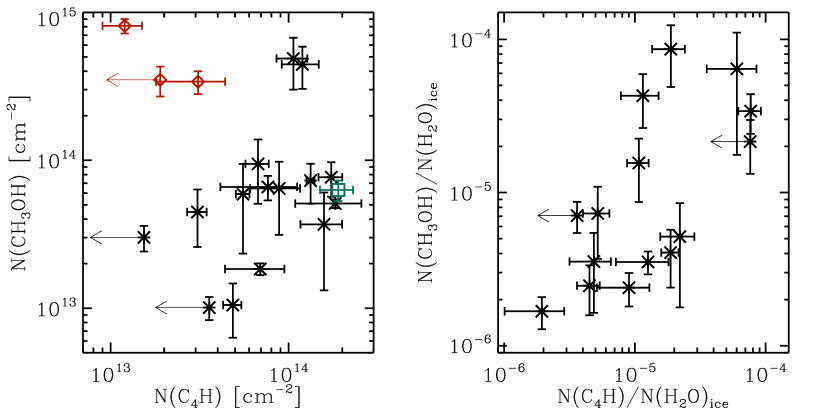
The difference between our sample and the hot corino sources suggest that CH3OH/C4H may trace an evolutionary sequence. We used the IR spectral indices, , as a proxy for age since decreasing signifies an increasing age (Wilking et al., 2001). We find no relationship for the CH3OH/C4H ratio to , indicating that there is no evolutionary sequence within our sample. Instead observed variations in the CH3OH/C4H ratio in our sample (visible in Figure 6 as a large spread in CH3OH column densities for any specific C4H column density) seems to be the result of different initial ice compositions.
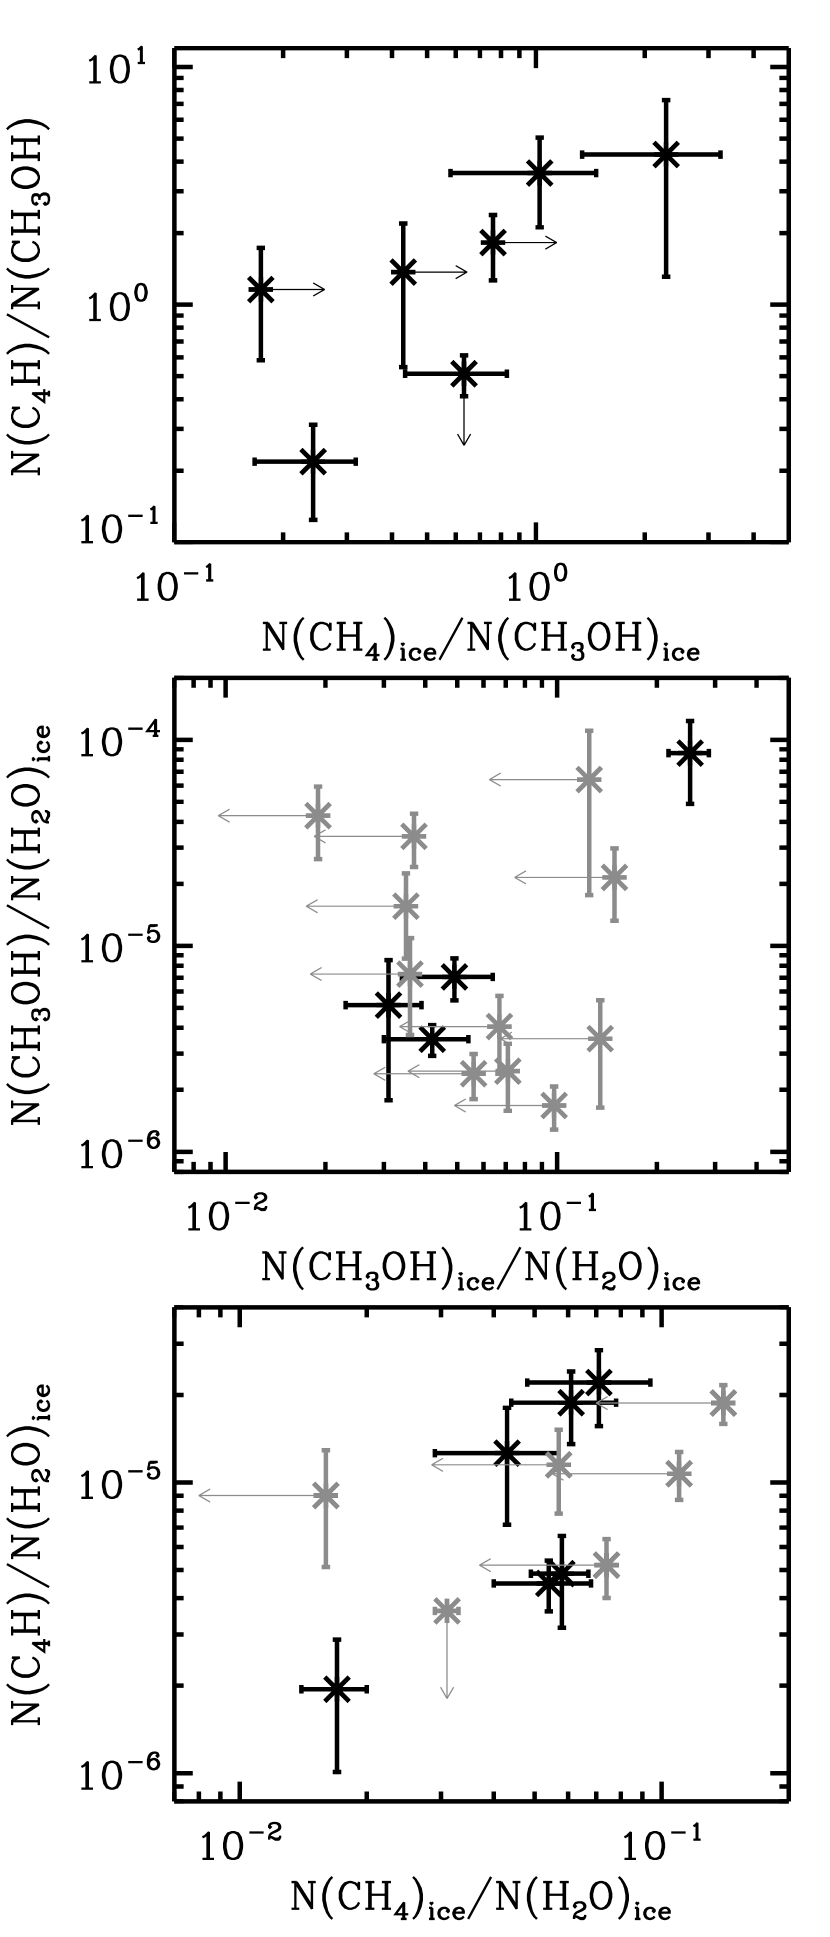
Figure 7 shows a positive correlation between the C4H/CH3OH gas and the ice phase CH4/CH3OH. The correlation is not statistically significant due to the many ice upper limits, however it does suggest a relationship between gas and ice abundances for these species. When C4H gas and CH4 ice, and CH3OH ice and gas are considered separately, there seems to be a stronger relationship between the gas and ice phase hydrocarbons (Figure 7 bottom) than between CH3OH gas and ice (Figure7 middle).
5. Discussion
In this study, we observed 16 embedded protostars to determine the relationship between CH3OH and C4H. We find that there is a positive correlation between the column density of CH3OH and C4H. Several of the sources have COM detections in addition to CH3OH (Öberg et al., 2014). WCCC and COM chemistry are thus not mutually exclusive during the embedded stages of star formation. Rather, carbon chain and COM formation seem to follow one another up until the onset of an efficient hot corino chemistry. Once the hot corino has formed, CH3OH and C4H are no longer correlated (Maret et al., 2005).
Aikawa et al. (2012) modeled the chemistry from a prestellar core up to the formation of the protostellar envelope, and found that both carbon chains and COMs can be present in the colder, outer envelope. Aikawa et al. (2012) attribute the formation of the carbon chains to an increase in the C+ abundance in conjunction with the CH4 ice sublimation. The presence of CH3OH in the envelope is due to non-thermal sublimation of CH3OH ice. Contrary to C4H, CH3OH is also abundant toward the protostellar core due to thermal sublimation. The abundance of CH3OH in the protostellar core can be many orders of magnitude higher than the outer envelope emission, but its contribution to observed emission can be quite negligible if the volume of thermally sublimated CH3OH is small compared to the protostellar envelope volume. Should the emission from the thermally sublimated CH3OH dominate the CH3OH envelope emission, the source would be considered a hot corino.
Within our source sample, envelope ice abundances explain variations in the C4H/CH3OH ratio. The CH3OH ice and gas columns (Figure 7 middle) are not clearly related, however. If all CH3OH in all sources originated from non-thermal desorption there should be a correlation between CH3OH gas and ice abundances. On the other hand if some CH3OH is due to thermal desorption, the source luminosity will influence the CH3OH emission, muddling the expected CH3OH gas and ice correlation. As we observe no correlation, it is likely that we are probing both thermal and non-thermal desorption processes.
The observed tentative C4H-CH4,ice correlation indicates that the formation of C4H depends on the initial abundance of CH4 ice. The thermal sublimation of CH4 ice to promote WCCC was initially suggested by Sakai et al. (2008), and is consistent with current chemical models (Hassel et al., 2011; Aikawa et al., 2012). Not all C4H may originate from this process, however, as some may be inherited from the molecular cloud. An unusually high contribution of inherited C4H, may explain the outlier with a high C4H gas column and low CH4 ice upper limit (IRAS 03271+3010) in Figure 7. A possible explanation for such a high contribution may be that this source is very young.
In addition to ice abundances, the chemistry of C4H and CH3OH may depend on environmental parameters, such as envelope mass and bolometric luminosity. A higher bolometric luminosity should result in a larger hot corino region. If this is the main regulator for the COMs-carbon chain relationship, the CH3OH/C4H ratio would increase toward more luminous protostars. We do not find any correlation between this ratio and source luminosity (Tables 1 and 4). It is more difficult to assess the importance of the initial envelope mass on the chemistry, since envelope mass evolves with time. A current low envelope mass measurement may signify either a low-mass protostar or an older more massive protostar. We do not find any correlation between the CH3OH/C4H ratio and envelope mass alone (Tables 1 and 4). The small sample size prevented a more detailed analysis of the combined influence of mass and age on the chemistry. We also do not see any relationships between these environmental parameters and the absolute column densities of C4H and CH3OH.
As reported in §4, we also find no correlation with , an age indicator, and the CH3OH/C4H ratio. For young embedded protostars, the ‘age’ of the system does not seem to affect the relative importance of carbon chain and COM chemistry, i.e. C4H and CH3OH coexist in the envelope at this evolutionary stage. In Figure 6, the “boomerang” shape may indicate an evolutionary trend when comparing these young objects with more evolved ones. This is consistent with models. As the protostar transitions into the hot corino stage, the temperature is high enough to both destroy carbon chains and thermally desorb CH3OH, resulting in an anti-correlation in the observed C4H and CH3OH column densities (Aikawa et al., 2012).
6. Conclusions
We surveyed 16 northern sources selected from the Spitzer ice sample using the IRAM 30m and found the following:
-
1.
C4H and CH3OH coexist and are correlated at the deeply embedded stage of low-mass protostellar evolution. This can be explained by lukewarm environments in the protostellar envelopes that promote WCCC alongside non-thermal desorption of CH3OH.
-
2.
The CH3OH/C4H correlation does not extend into the hot corino phase. This is indicative of an evolutionary sequence where carbon chains and COMs coexist in lukewarm protostellar envelopes, but once a hot corino forms, COMs are enhanced and carbon chains are destroyed.
-
3.
The ice and gas abundances are related in these sources based on a tentative correlation between CH3OH/C4H gas ratio and CH3OH/CH4 ice ratio. It is likely that the C4H gas and CH4 ice correlation is what is driving this relationship, suggesting that WCCC is intimately connected to the CH4 ice abundance.
References
- Aikawa et al. (2012) Aikawa, Y., Wakelam, V., Hersant, F., Garrod, R. T., & Herbst, E. 2012, ApJ, 760, 40
- Andre et al. (2000) Andre, P., Ward-Thompson, D., & Barsony, M. 2000, Protostars and Planets IV, 59
- Arce et al. (2008) Arce, H. G., Santiago-García, J., Jørgensen, J. K., Tafalla, M., & Bachiller, R. 2008, ApJ, 681, L21
- Arce & Sargent (2006) Arce, H. G. & Sargent, A. I. 2006, ApJ, 646, 1070
- Bacmann et al. (2012) Bacmann, A., Taquet, V., Faure, A., Kahane, C., & Ceccarelli, C. 2012, A&A, 541, L12
- Balucani et al. (2015) Balucani, N., Ceccarelli, C., & Taquet, V. 2015, MNRAS, 449, L16
- Blake et al. (1987) Blake, G. A., Sutton, E. C., Masson, C. R., & Phillips, T. G. 1987, ApJ, 315, 621
- Boogert et al. (2015) Boogert, A. C. A., Gerakines, P. A., & Whittet, D. C. B. 2015, ARA&A, 53, 541
- Boogert et al. (2008) Boogert, A. C. A., Pontoppidan, K. M., Knez, C., et al. 2008, ApJ, 678, 985
- Bottinelli et al. (2010) Bottinelli, S., Boogert, A. C. A., Bouwman, J., et al. 2010, ApJ, 718, 1100
- Brinch et al. (2007) Brinch, C., Crapsi, A., Hogerheijde, M. R., & Jørgensen, J. K. 2007, A&A, 461, 1037
- Broten et al. (1978) Broten, N. W., Oka, T., Avery, L. W., MacLeod, J. M., & Kroto, H. W. 1978, ApJ, 223, L105
- Carter et al. (2012) Carter, M., Lazareff, B., Maier, D., et al. 2012, A&A, 538, A89
- Cazaux et al. (2003) Cazaux, S., Tielens, A. G. G. M., Ceccarelli, C., et al. 2003, ApJ, 593, L51
- Cernicharo et al. (2012) Cernicharo, J., Marcelino, N., Roueff, E., et al. 2012, ApJ, 759, L43
- Chen et al. (1997) Chen, H., Grenfell, T. G., Myers, P. C., & Hughes, J. D. 1997, ApJ, 478, 295
- Enoch et al. (2009) Enoch, M. L., Evans, II, N. J., Sargent, A. I., & Glenn, J. 2009, ApJ, 692, 973
- Evans et al. (2003) Evans, II, N. J., Allen, L. E., Blake, G. A., et al. 2003, PASP, 115, 965
- Furlan et al. (2008) Furlan, E., McClure, M., Calvet, N., et al. 2008, ApJS, 176, 184
- Garrod & Herbst (2006) Garrod, R. T. & Herbst, E. 2006, A&A, 457, 927
- Garrod et al. (2008) Garrod, R. T., Weaver, S. L. W., & Herbst, E. 2008, ApJ, 682, 283
- Goldsmith & Langer (1999) Goldsmith, P. F. & Langer, W. D. 1999, ApJ, 517, 209
- Hassel et al. (2011) Hassel, G. E., Harada, N., & Herbst, E. 2011, ApJ, 743, 182
- Hatchell et al. (2007) Hatchell, J., Fuller, G. A., Richer, J. S., Harries, T. J., & Ladd, E. F. 2007, A&A, 468, 1009
- Herbst & Leung (1989) Herbst, E. & Leung, C. M. 1989, ApJS, 69, 271
- Herbst & van Dishoeck (2009) Herbst, E. & van Dishoeck, E. F. 2009, ARA&A, 47, 427
- Kroto et al. (1978) Kroto, H. W., Kirby, C., Walton, D. R. M., et al. 1978, ApJ, 219, L133
- Little et al. (1977) Little, L. T., Riley, P. W., & Matheson, D. N. 1977, MNRAS, 181, 33P
- Maret et al. (2005) Maret, S., Ceccarelli, C., Tielens, A. G. G. M., et al. 2005, A&A, 442, 527
- Öberg et al. (2008) Öberg, K. I., Boogert, A. C. A., Pontoppidan, K. M., et al. 2008, ApJ, 678, 1032
- Öberg et al. (2010) Öberg, K. I., Bottinelli, S., Jørgensen, J. K., & van Dishoeck, E. F. 2010, ApJ, 716, 825
- Öberg et al. (2009a) Öberg, K. I., Bottinelli, S., & van Dishoeck, E. F. 2009a, A&A, 494, L13
- Öberg et al. (2009b) Öberg, K. I., Garrod, R. T., van Dishoeck, E. F., & Linnartz, H. 2009b, A&A, 504, 891
- Öberg et al. (2014) Öberg, K. I., Lauck, T., & Graninger, D. 2014, ApJ, 788, 68
- Ohishi & Kaifu (1998) Ohishi, M. & Kaifu, N. 1998, Faraday Discussions, 109, 205
- Pontoppidan et al. (2004) Pontoppidan, K. M., van Dishoeck, E. F., & Dartois, E. 2004, A&A, 426, 925
- Sakai et al. (2009a) Sakai, N., Sakai, T., Hirota, T., Burton, M., & Yamamoto, S. 2009a, ApJ, 697, 769
- Sakai et al. (2008) Sakai, N., Sakai, T., Hirota, T., & Yamamoto, S. 2008, ApJ, 672, 371
- Sakai et al. (2009b) Sakai, N., Sakai, T., Hirota, T., & Yamamoto, S. 2009b, ApJ, 702, 1025
- Sakai & Yamamoto (2013) Sakai, N. & Yamamoto, S. 2013, Chemical Reviews, 113, 8981
- Wilking et al. (2001) Wilking, B. A., Bontemps, S., Schuler, R. E., Greene, T. P., & André, P. 2001, ApJ, 551, 357