reception date \Acceptedacception date \Publishedpublication date
Catalogs — Surveys — X-rays: general
The First MAXI/SSC Catalog of X-ray Sources in 0.7–7.0 keV
Abstract
We present the first source catalog of the Solid-state Slit Camera (SSC) of the Monitor of All-sky X-ray Image (MAXI) mission on the International Space Station, using the 45-month data from 2010 August to 2014 April in 0.7–7.0 keV bands. Sources are searched for in two energy bands, 0.7–1.85 keV (soft) and 1.85–7.0 keV (hard), the limiting sensitivity of 3 and 4 mCrab are achieved and 140 and 138 sources are detected in the soft and hard energy bands, respectively. Combining the two energy bands, 170 sources are listed in the MAXI/SSC catalog. All but 2 sources are identified with 22 galaxies including AGNs, 29 cluster of galaxies, 21 supernova remnants, 75 X-ray binaries, 8 stars, 5 isolated pulsars, and 9 non-categorized objects. Comparing the soft-band fluxes at the brightest end in our catalog with the ROSAT survey, which was performed about 20 years ago, 10% of the cataloged sources are found to have changed the flux since the ROSAT era.
1 Introduction
The Monitor of All-sky X-ray Image (MAXI : [Matsuoka et al. (2009)]) is the first astronomical payload aboard the International Space Station (ISS). MAXI has been performing the monitoring observations since its first light in 2009 August. The monitoring data of MAXI are open to the public at the RIKEN web site (http://maxi.riken.jp), where the light curves of more than 380 X-ray sources are available. MAXI is equipped with two types of cameras: the Gas Slit Camera (GSC: [Mihara et al. (2011)], [Sugizaki et al. (2011)]) and the Solid-state Slit Camera (SSC: [Tsunemi et al. (2010)], [Tomida et al. (2011)]). The GSC is an array of position-sensitive gas proportional counters with beryllium windows with a total detection area of 5350 cm2. The SSC is an array of X-ray CCDs with a total detection area of 200 cm2. Both have a fan-beam field of view (FOV) and scan almost the entire sky every 92 minutes. The FOVs of the GSC and SSC are \timeform1.D5\timeform160D and \timeform1.D5\timeform90D, respectively.
The first all-sky catalog for X-ray sources was obtained by UHURU observations ([Forman et al. (1978)]) in the period between 1970 and 1973 and includes 339 sources in 2–6 keV. The Ariel-V satellite, which was active between 1974 and 1980, provided two catalogs: one contains 142 sources in 2–18 keV (\timeform10D, [McHardy et al. (1981)]) and the other, 109 sources in 2–10 keV (\timeform10D, [Warwick et al. (1981)]). The next comprehensive ones were published based on the HEAO1 data between 1977 and 1979: A1 catalog in 1–20 keV (842 sources, [Wood et al. (1984)]), A2 catalog in 0.2–2.8 keV (114 sources, [Nugent et al. (1983)]), and A3 catalog in 13–180 keV (40 sources, [Levine et al. (1984)]). All of these catalogs were based on the data taken with non-focusing optics. ROSAT, equipped with X-ray mirrors, performed all-sky survey during the first half year of the mission in 1990–1991. Its energy range is in 0.1–2.4 keV. The bright source catalog of ROSAT from the survey includes 18811 sources ([Voges et al. (1999)]), and the faint source catalog does 105924 sources ([Voges et al. (2000)]) in 0.1–2.4 keV.
There are two types of instruments to perform all-sky survey. One has a relatively narrow FOV; UHURU (\timeform1D\timeform10D), Ariel-V (\timeform0.D75\timeform12D), HEAO1 (\timeform2D\timeform8D etc.) and ROSAT (\timeform2D circle) are of this type. They can take a long time to cover the entire sky, up to half a year in the case of ROSAT, while individual sources are observed for a relatively short period. As a result, they can miss sources that happen to be in quiet phase during its covering period. The other has a much wider FOV, like MAXI. They periodically scan a large area of, or even the entire, sky with a relatively short interval, for example, 92 minutes with MAXI. The source intensities listed in our MAXI catalog are accordingly the average ones over 3.7 years of our survey period presented in this paper. Hence, MAXI is far less likely to miss sources that fall in quiescence for a relatively short period than the other type of all-sky survey instruments.
All-sky survey in the X-ray band is a powerful tool to investigate the entire spectrum of high-energy phenomena in the universe since most of X-ray sources show strong time variabilities in various time scales, from a milli-second to years. MAXI has a potential to upgrade the existing all-sky X-ray source catalog. Hiroi et al. (2011) presented the first GSC catalog in the 4-10 keV band that contains 143 sources at high galactic latitudes (\timeform10D), using the first 7 months of the monitoring data. Hiroi et al. (2013) later updated the GSC catalog, using the 37-month data that contains more than 500 sources. The limiting sensitivity reaches 7.510-12 erg cm-2 s-1 (0.6 mCrab) in the 4–10 keV band.
Since the MAXI/GSC employs a similar detector to those of UHURU and HEAO1/A1, the GSC catalog covers the energy range between a few keV and a few tens of keV, which is above that of ROSAT. Here, we report the MAXI/SSC catalog that covers the energy range of 0.7–7.0 keV. We describe the data reduction of the MAXI/SSC data in section 2 and method of the source detection with the SSC data in section 3. In section 4, we present the SSC source list and discussions. Summary is presented in section 5.
2 Data reduction
The SSC consists of 2 units: SSC-H and SSC-Z. The two units are identical and are composed of 16 CCDs with a total detection area of 100 cm2 per unit. SSC-H views the forward direction of the ISS, while SSC-Z does the zenith (anti-earth) direction. Each is equipped with a fan-beam collimator of \timeform1.D5\timeform90D. CCDs work in the pixel-sum mode that functions as one-dimensional imager along the long direction of the collimator. The details are given in the literatures (Tsunemi et al. (2010), Tomida et al. (2011))
MAXI has been in operation since 2009 till present. However, we use the data taken between 2010 August 1 and 2014 April 30 only for the catalog presented in this paper, discarding the data before and after for the following reasons. The SSC event data before 2010 August were heavily contaminated with dark-level saturated pixels due to sun-light leak. It was thus difficult to estimate the correct effective area. The data taken after 2014 April were seriously affected by flickering pixels because gradual increase of the dark current since the launch had reached an unacceptable level by then, which generated many flickering pixels.
We exclude the data taken around the geomagnetic pole at high latitude and the South Atlantic Anomaly region, which suffer from many charged-particle events. We also exclude the data obtained during day-time. In order to exclude the charged-particle events, we accept grade-0 (single pixel) events as X-rays below 1.85 keV, and grade-0, 1, and 2 (single pixel and two-pixel split) events above 1.85 keV just as done by Kimura et al. (2013).
The SSC is equipped with the radiator and the peltier cooler, which cools the CCD around \timeform-60DC. Since the temperature of one CCD (SSC-Z/CCDID=0) is rather high due to insufficient function of the peltier cooler attached on it, we exclude it from our analysis. Due to the thermal noise, the events with the energy lower than 0.7 keV are practically unusable and are discarded. Since the collimator is made of copper that generates Cu-K lines on all the CCDs, we set the upper energy limit of the SSC data to be 7.0 keV. Consequently, we accept the X-ray events between 0.7 keV and 7.0 keV.
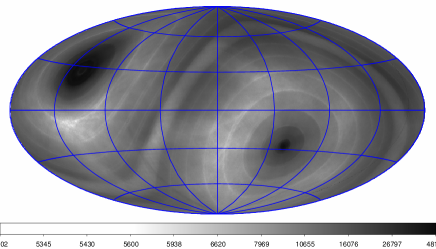
Figure 1 is the exposure map obtained through the above-mentioned screening method. The daily observation coverage of the MAXI/SSC was limited to smaller than 40% of the entire sky, considering the FOV (45∘) and the day-time data discarded. The ISS orbital plane shows a precession in every 70 days (the inclination angle of the ISS orbit is \timeform51.D7). Accordingly, the MAXI/SSC covers the entire sky in a yearly observation. The region around the celestial north pole is more frequently observed than other regions and has a deep exposure (figure 1). The ISS moves around the Earth at the almost constant attitude. This means that MAXI always looks at sky and never sees the dark-Earth nor bright-Earth, which is in stark contrast to other satellites in a low Earth orbit like Suzaku (Tawa et al. (2008)).
3 Analysis
After obtaining the screened X-ray data, we take two steps to detect X-ray sources. The first one is the image production for the entire sky. Then the second one is source finding. We execute these steps for two energy bands, 0.7–1.85 keV (soft band) and 1.85–7.0 keV (hard band), where the energy of 1.85 keV corresponds to the boundary of the grade selection (see the previous section). Since the low-energy limit of the MAXI/GSC detection is 2 keV, the soft-band data of the SSC provide us with a view of the sky that is invisible with the MAXI/GSC. The hard-band data are similar to that of the MAXI/GSC except that the working time is not always the same due to the observation conditions. We can compare sources detected in our hard-band data with those of the GSC catalogs (Hiroi et al. (2011), Hiroi et al. (2013)) to check the consistency, as performed and described in section 3.4.
3.1 Image production
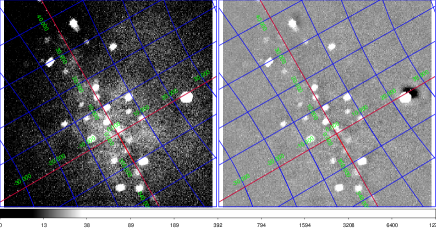
We create 48 square images, which cover the entire sky as a whole. The center position of each square is selected by using Healpix (Hierarchical Equal Area isoLatitude Pixelization: Górski et al. (2005)). We select each image to be \timeform67D.5 square to ensure that it covers one Healpix segment. The left panel of figure 2 is a sample of the square images, near the galactic center. It is neither background-subtracted nor exposure-corrected. We divide each image into 300300 pixels. The pixel is \timeform0D.225 square that is small enough not to affect the shape of the point spread function (PSF) of the SSC (\timeform1D.5 in FWHM). Each square image overlaps its adjacent images. Therefore, when we find a source in an image, we check that it is not doubly counted because of this overlap. When a source is very close to the segment boundary, we make visual inspection.
3.2 Source finding
We employ the SExtractor V2.5.0 (Source Extractor : Bertin & Arnouts (1996)) for source detection in the images produced as described in the previous section. In SSC images, most of detected sources are expected to be point-like. The SExtractor requires the following three parameters to be carefully set to detect point-like sources accurately. The parameter BACK_SIZE is used to subtract the background (extended) component and it is tuned to the size of the PSF. DETECT_THRESHOLD is used to determine the significance of the source candidate. DETECT_MINAREA is the minimum number of adjacent pixels above DETECT_THRESHOLD, which is set to a slightly smaller value than the pixel number in the PSF of the MAXI/SSC. Table 3.2 summarizes these three parameters.
The right panel of figure 2 is a background-subtracted image created with SExtractor from the left panel. With the procedure described above, we create 48 background-subtracted images and combine them to obtain the entire-sky image shown in figure 3 in the galactic coordinates. We have extracted 814 and 754 sources, using SExtractor, in the soft- and hard-band images, respectively. Then we check the Healpix segment, to which each source belongs, to avoid double counts. Some sources are located very close to a segment boundary. When two sources are located within \timeform0D.1, we select one of them. In this way, we filter out duplicated sources and obtain 350 and 347 sources as candidates for the soft and hard bands, respectively.
The parameters for SExtractor in the SSC source-finding BACK_SIZE 10 DETECT_THRESHOLD 1.0 DETECT_MINAREA 18
The next step of the catalog creation is validation of the source candidates. Our method for the validation is rather simple. We compare the number of events in a candidate region with that of the background region. Each candidate region is a circle with a radius of \timeform1D.5, and the background region is an contiguous annular region with the outer radius of \timeform3D.0. We then define the significance level, , as
| (1) |
where is the number of events in a candidate region, is that of the background region, and is the ratio of the areas of the candidate to the background regions. We define 5.0 as the threshold for significant detection.
Crowded regions must be treated with caution. When a region overlaps those of other sources, we simply exclude the overlapping region. However, when the nearby source is determined to be insignificant (or fake), we recalculate the source and/or background region. We iterate this process to calculate the significance until no fake source is obtained. In this way, we extract the list of the true sources from candidates.
For each of the true sources, we calculate the center of gravity of events in the source region and assign it as the candidate source position. Then, we re-define the circle of the source region and calculate the center of gravity again. We iterate this procedure until the shift of the source position becomes smaller than \timeform0D.02. Since we do not take into account the potential effects from nearby sources, the position accuracies may be worse than \timeform0D.02, particularly in crowded regions.
The source flux is evaluated from the number of events in the background-subtracted image. We then compare it with the number of events in the Crab simulation, where we assume the photon index of 2.1, the interstellar absorption NH of 3.41021 cm-2 with the solar abundance111The spectral parameters are adopted from the INTEGRAL General Reference Catalog (ver. 40). http://www.isdc.unige.ch/integral/catalog/40/catalog.html, and the photon flux density at 1.0 keV of 10 photon sec-1 cm-2 keV-1. We perform the simulation, using XSPEC version 12.8.2 and the spectrum response files created in the same way as those distributed at the MAXI web site. The flux is expressed in units of erg sec-1 cm-2.
In our SSC data of the Crab observations, we find the flux to be 8.2110-9 and 1.82410-8 erg sec-1 cm-2 for the soft and the hard bands, respectively. On the other hand, our simulation of the Crab gives 9.3410-9 and 1.80710-8 erg sec-1 cm-2, respectively. Hence, the observed results with the SSC are 0.88 and 1.01 times that of the simulation. Although this difference depends partially on the systematic error of the SSC normalization, the differences mainly depends on the spectral model. The Crab model that we employed was determined with the INTEGRAL mission, of which the energy range is 3 keV. Then, the discrepancy in the soft band is larger than that of the hard band.
3.3 False detection
In order to study how probable the detected source candidates originate in the potential background fluctuations, as opposed to true sources, we search for negative peaks in the 48 images the same as by Hiroi et al. (2011). The procedure of the negative-peak search is the same as in the positive-peak search. Consequently, we detected 21 candidates with 5.0 as negative peaks. We find all of them to be close to bright sources. Indeed, in the background-subtracted images, some dark regions close to the bright source are visible (see the right panel of figure 2, where Sco X-1 is in the right edge). These dark regions are most likely to be mainly caused by inappropriate background estimation. The PSF of the SSC is a box-car shape of \timeform2D.0\timeform3D.0 in the single scan image (figure 10 in Tsunemi et al. (2010)). The SSC scans each source many times, while the scan direction is not always randomly distributed but is determined preferentially by the ISS orbit. As a result, the PSF of the SSC is clearly skewed from a cirlce even in the integrated image for 4 years of the data, although the PSF is expected to be considerably smoothed out after integration. We set the parameter BACK_SIZE to 10 (section 3.2 and table 1). However, this is not appropriate for some directions of scan, particularly in the vicinity of bright sources. We find that all of the 21 negative peaks are visible only in the background-subtracted images. Therefore, they all must be false detection. We also find that 5.0 is large enough to avoid the false detection due to the background fluctuation. Applying this threshold of , more than half of the sources in the source lists are filtered out, and 154 and 154 sources remain as significant in the soft and hard bands, respectively.
For all the significant sources, we perform visual inspection and find some false detections, as described below. In the hard-band image of figure 3, we see some bright regions, which are suspected artificial structures: stripes parallel to the celestial equator and a region around the celestial south pole. From our visual inspection, we find 23 sources that must originate from the fluctuation of the background. Then, the number of the sources are reduced to 140 and 138 for the soft and hard bands, respectively, after the 23 sources are excluded.
By comparing the source positions in the two energy bands, we find that 108 sources are common in both the energy bands, where their positional separations are smaller than \timeform0D.5. Consequently, the final SSC catalog contains 170 unique sources. Table 2 summarizes the number of source candidates at each source-finding step.
The number of source candidates at each step in creating the SSC catalog. soft hard first candidates by Sextractor 814 754 duplicate check 350 347 significance () 5.0 154 154 visual inspection 140 138
3.4 Source identification
X-ray sources usually show strong variabilities in various time scales. Hence, we compare the SSC source catalog with that obtained by the MAXI/GSC rather than those obtained in the past by other satellites. We employ the source list in the MAXI web-site and the MAXI/GSC high-galactic source catalog (GSC Catalog: Hiroi et al. (2013)).
First, we focus on the hard-band sources at high galactic latitudes, because the energy bands and periods of observations are almost identical between the SSC and GSC catalogs except for the detection limits. We find that all of the 58 hard sources at 10.0 in the SSC catalog have a counter part in the GSC catalog. This fact confirms that our analysis procedure is appropriate.
Then, for the SSC soft band, we employ the ROSAT Bright Source Catalog (ROSAT/BSC: Voges et al. (1999)) for source identification, as the GSC is insensitive to the energy band. The ROSAT/BSC does not include highly extended objects like supernova remnants (SNR) and cluster of galaxies. Therefore, we also employ the SNR catalog (Green (2014)) and REFLEX galaxy cluster survey catalog (Böhringer et al. (2004)). Taking into account the positional accuracy of the SSC, we set the upper threshold for the angular distance for identification to be \timeform0D.5.
4 Results and Discussion
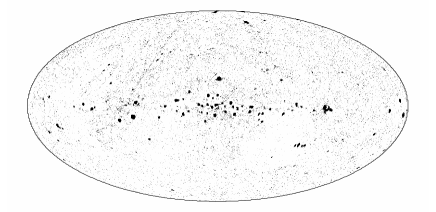
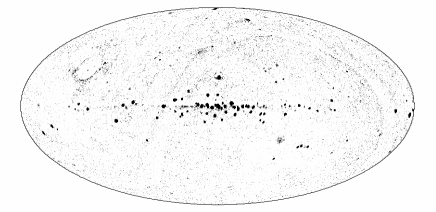
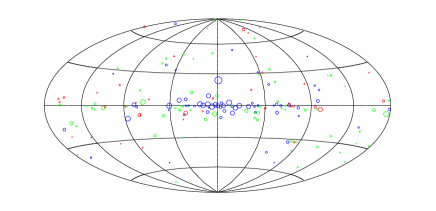
We summarize the MAXI/SSC catalog in table References, in which sources with S5.0 are listed. The columns in the table are (1) identification number, (2) MAXI-SSC name, (3) Right Ascension (degree in J2000), (4) Declination (degree in J2000), (5)(6) detection significances in the soft and hard bands, respectively, (7)(8) flux in the soft and hard bands, respectively, (9) source identification, and (10) counterpart in the MAXI/GSC catalog. The source locations in the galactic coordinates are plotted in figure 4.
4.1 Source category
In table 4.1, we summarize the statistics of the source identifications, referring to the 9 th column of table References. The MAXI/SSC catalog contains more binary sources than the MAXI/GSC catalog, because the MAXI/SSC catalog includes sources at low galactic latitudes. The high sensitivity of the SSC in the soft band yields detection of many SNRs.
Source category of the SSC catalog Category Number of sources Galaxies/AGNs 22 Cluster of Galaxies 29 SNRs 21 X-ray binaries 75 stars 8 Isolated pulsar 5 unknown/no identification 11 {tabnote} The number of sources in table References is 170, while the sum of the numbers in this list is 171. This is because the source ID=43 in table References consists of two sources: Vela pulsar and SNR.
4.2 Position accuracy
From the source identification result, we estimate the positional errors of the MAXI/SSC as a function of (the columns 5 and 6 in table References). Figure 5 shows the distribution of the angular separation between the MAXI/SSC sources and the identified sources for three intervals of detection significance. As can be seen, sources with higher significance have smaller angular separations. In the top panel, relevant to sources with , the statistical errors are smaller than the systematic errors. When the significance is high enough, (top panel), the statistical errors must be dominant, compared with the systematic errors. Thus, we estimate the systematic error of the source positions, using the 43 sources with . Out of the 43 sources, three sources have the separation \timeform0D.2: GX 3+1, Pup A, and LMC X-1. GX 3+1 is near the galactic center, and LMC X-1 is in the Large Magellanic Cloud. These two are very close to bright sources, which affect the accuracies of source positions. Pup A is an extended SNR that is on the edge of the large SNR, Vela-SNR, which also affects the positional accuracy. Therefore, these three sources are exceptional. The separation angle of any of the other 40 sources than these three sources with is smaller than \timeform0D.2. We conclude that the systematic error of the position determination for the MAXI/SSC is at largest \timeform0D.2.

4.3 log-log relation
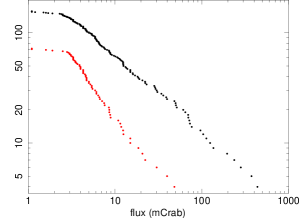
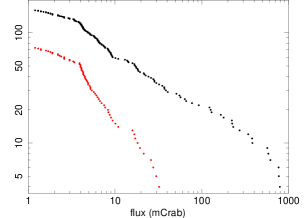
The log-log relation from a survey observation provides us with the fundamental information of the source population, where is the number of sources brighter than the flux . Figure 6 shows the one based on the SSC catalog. Red marks in figure 6 are the sources at high galactic latitude (\timeform10D) : this distribution is well fit by a straight line with a slope of 1.5 above 3 mCrab and 4 mCrab for the soft and hard band plots, respectively. The break points should correspond to the sensitivity limit of the SSC catalog. Consequently, the limiting sensitivities of the MAXI/SSC catalog are 3 mCrab and 4 mCrab for the soft and hard bands, respectively.
4.4 Comparison with the ROSAT era
Since the MAXI/SSC catalog in the soft band covers the all sky below 2 keV, we compare it with the ROSAT all-sky catalog. We find that 18 out of 140 sources in the SSC soft-band catalog have no counterpart in the ROSAT/BSC (Voges et al. (1999)). We find that 9 out of the 18 sources with no counterpart are highly extended sources (8 SNRs including Cygnus supper bubble and M87/Virgo). They were clearly detected by ROSAT, although are not included in the BSC, which does not list highly extended sources. Six out of the remaining 9 sources are new transients after the ROSAT survey: MAXI J0556332 (Sugizaki et al. (2013)), MAXI J1836194 (Negoro et al. (2011)), HETE J1900.12455 (Vanderspek et al. (2005)), Swift J1753.50127 (Palmer et al. (2005)), MAXI J1910057/Swift J1910.20546 (Usui et al. (2012), Krimm et al. (2012)), and GRS 1915+105 (Castro-Tirado et al. (1994)). The rests are 4U 160852 and two unidentified sources. 4U 160852 is an Atoll source, which shows a transition (Hasinger & van der Klis (1989)). It was likely to be in the quiescent phase at the time of the ROSAT survey. The two unidentified sources (ID=137 and 141 in table References) are on the galactic plane. Hence, we can not exclude the possibility that they may be fluctuations of the galactic ridge emission and are mistakenly identified as sources.
Next, we search the SSC catalog for the brightest 50 ROSAT sources, and find that 35 sources have a counterpart. Table 4.4 summarizes the nature of the other 15 sources with no counterpart in the SSC catalog, taken from the SIMBAD222http://simbad.u-strasbg.fr/simbad database. Eight out of the 15 sources are transient, and 6 out of the 8 have not been detected with the MAXI/GSC, either. The 6 sources are 1RXS J074833.8674505, 1RXS J112623.5684040, 1RXS J173413.0260527, 1RXS J173602.0272541, 1RXS J175840.1334828, and 1RXS J215852.2301338. They had been active in the ROSAT era, but were quiescent during the MAXI survey period. The other two out of the 8 were detected with the MAXI/GSC: 1RXS J152040.8571007 and 1RXS J170248.5484719. This difference in detection is probably due to the difference in the coverage periods between the GSC and the SSC. We should note that GX3394 was in an almost quiescent phase during the period of the SSC survey, used in this paper. It became bright in 2014 October (Yan et al. (2014)). Another 4 of the 15 are white dwarfs (1RXS J064509.3164241, 1RXS J131621.4+290555, 1RXS J150209.2+661220, and 1RXS J200542.0+223955). White dwarfs are bright only below 0.7 keV, which is below the energy band of the SSC. One source out of the four white dwarfs is a cataclysmic variable of AM Her type, 1RXS J200542.0+223955. AM Her-type cataclysmic variables are known to emit hard X-rays and 1RXS J200542.0+223955 is not an exception. However, the hard X-ray flux from it measured with the Ginga/Lac (Beardmore et al. (1995)) is far below the detection limit of the SSC, which is consistent with our non-detection. Another undetected source, 1RXS J052502.8693840, is SNR N132D in Large Magellanic Cloud, and is located close to a bright source LMC X-1. MAXI/SSC can not separate N132D from LMC X-1 due to the small angular distance. Another undetected source, 1RXS J233733.3+462736, is an RS CVn type star, which shows large X-ray flares in a time scale of hours. ROSAT/BSC might have detected a flare(s). The fluxes in this MAXI/SSC catalog are the average values for 4-years observations. Therefore, the SSC catalog may have missed short (hour- or day-scale) transients like 1RXS J233733.3+462736. The short transient search with the MAXI/SSC will be presented in a future paper.
Bright ROSAT sources that the SSC did not detect. BSC name (1RXS ) identification class* comment J052502.8-693840 N132D C SNR close to LMC X-1 J064509.3-164241 H1504+65/Sirius-B B White Dwarf J074833.8-674505 EXO 0748676 A X-ray burster J112623.5-684040 GRS 1124683 A Black hole J131621.4+290555 HZ43 B White Dwarf J150209.2+661220 H1504+65 B White Dwarf J152040.8-571007 Cir X-1 A Neutron Star. Detected with MAXI/GSC J161741.2-510455 E J170248.5-484719 GX3394 A Black hole. Detected with MAXI/GSC J173413.0-260527 KS 1731260 A X-ray burster. J173602.0-272541 GS 1732273/KS 1732273 A Black hole J175840.1-334828 4U 1755338 A Black hole J200542.0+223955 QQ Vu B CV of AM Her type J215852.2-301338 QSO B2155304/1H 2156304 A BL Lac J233733.3+462736 lam And D Variable of RS CVn {tabnote} * The third column indicates A:transient source, B:very soft source(white dwarf), C:source confusion, D:flare star, E:others.
5 Summary
We present the first MAXI/SSC catalog produced from an unbiased X-ray survey for 45 months in the 0.7–1.85 keV (soft) and 1.85–7.0 keV (hard) bands. The limiting sensitivity of 3 and 4 mCrab are achieved and 140 and 138 sources are detected for the soft and hard bands, respectively. Combining the data in the two bands, the MAXI/SSC catalog contains 170 unique sources. The breakdown is 22 galaxies including AGNs, 29 cluster of galaxies, 21 supernova remnants, 75 X-ray binaries, 8 stars, 5 isolated pulsars, 9 non-categorized objects, and 2 unidentified objects. Comparing the soft-band catalog with the ROSAT survey, which was performed about 20 years ago, we find that roughly 10% of sources have changed in intensity.
This research has made use of the MAXI data provided by RIKEN, JAXA and the MAXI team. Some of the results in this paper have been derived using the HEALPix (Górski et al. (2005)) and the SExtractor (Bertin & Arnouts (1996)). This research is partially supported by the Ministry of Education, Culture, Sports, Science and Technology (MEXT), Grant-in-Aid No.23000004 and No.24103002.
References
- Beardmore et al. (1995) Beardmore, A. P., Ramsay, G., Osborne, J. P., et al. 1995, MNRAS, 273, 742
- Bertin & Arnouts (1996) Bertin, E., & Arnouts, S. 1996, A&AS, 117, 393
- Böhringer et al. (2004) Böhringer, H., Schuecker, P., Guzzo, L., et al. 2004, A&A, 425, 367
- Castro-Tirado et al. (1994) Castro-Tirado, A. J., Brandt, S., Lund, N., et al. 1994, ApJS, 92, 469
- Forman et al. (1978) Forman, W., Jones, C., Cominsky, L., et al. 1978, ApJS, 38, 357
- Górski et al. (2005) Górski, K. M., Hivon, E., Banday, A. J., et al. 2005, ApJ, 622, 759
- Green (2014) Green, D. A. 2014, Bulletin of the Astronomical Society of India, 42, 47
- Hasinger & van der Klis (1989) Hasinger, G., & van der Klis, M. 1989, A&A, 225, 79
- Hiroi et al. (2011) Hiroi, K., Ueda, Y., Isobe, N., et al. 2011, PASJ, 63, 677
- Hiroi et al. (2013) Hiroi, K., Ueda, Y., Hayashida, M., et al. 2013, ApJS, 207, 36
- Kimura et al. (2013) Kimura, M., Tsunemi, H., Tomida, H., et al. 2013, PASJ, 65, 14
- Krimm et al. (2012) Krimm, H. A., Barthelmy, S. D., Baumgartner, W., et al. 2012, The Astronomer’s Telegram, 4139, 1
- Levine et al. (1984) Levine, A. M., Lang, F. L., Lewin, W. H. G., et al. 1984, ApJS, 54, 581
- Matsuoka et al. (2009) Matsuoka, M., Kawasaki, K., Ueno, S., et al. 2009, PASJ, 61, 999
- McHardy et al. (1981) McHardy, I. M., Lawrence, A., Pye, J. P., & Pounds, K. A. 1981, MNRAS, 197, 893
- Mihara et al. (2011) Mihara, T., Nakajima, M., Sugizaki, M., et al. 2011, PASJ, 63, 623
- Negoro et al. (2011) Negoro, H., Nakajima, M., Nakahira, S., et al. 2011, The Astronomer’s Telegram, 3611, 1
- Nugent et al. (1983) Nugent, J. J., Jensen, K. A., Nousek, J. A., et al. 1983, ApJS, 51, 1
- Palmer et al. (2005) Palmer, D. M., Barthelmey, S. D., Cummings, J. R., et al. 2005, The Astronomer’s Telegram, 546, 1
- Sugizaki et al. (2011) Sugizaki, M., Mihara, T., Serino, M., et al. 2011, PASJ, 63, 635
- Sugizaki et al. (2013) Sugizaki, M., Yamaoka, K., Matsuoka, M., et al. 2013, PASJ, 65, 58
- Tawa et al. (2008) Tawa, N., Hayashida, K., Nagai, M., et al. 2008, PASJ, 60, 11
- Tomida et al. (2011) Tomida, H., Tsunemi, H., Kimura, M., et al. 2011, PASJ, 63, 397
- Tsunemi et al. (2010) Tsunemi, H., Tomida, H., Katayama, H., et al. 2010, PASJ, 62, 1371
- Usui et al. (2012) Usui, R., Nakahira, S., Tomida, H., et al. 2012, The Astronomer’s Telegram, 4140, 1
- Vanderspek et al. (2005) Vanderspek, R., Morgan, E., Crew, G., Graziani, C., & Suzuki, M. 2005, The Astronomer’s Telegram, 516, 1
- Voges et al. (1999) Voges, W., Aschenbach, B., Boller, T., et al. 1999, A&A, 349, 389
- Voges et al. (2000) —. 2000, VizieR Online Data Catalog, 9029, 0
- Warwick et al. (1981) Warwick, R. S., Marshall, N., Fraser, G. W., et al. 1981, MNRAS, 197, 865
- Wood et al. (1984) Wood, K. S., Meekins, J. F., Yentis, D. J., et al. 1984, ApJS, 56, 507
- Yan et al. (2014) Yan, Z., Zhang, W., Zhang, H., Stiele, H., & Yu, W. 2014, The Astronomer’s Telegram, 6649, 1
cccccccclc the MXAI/SSC catalog.
The flux is calculated only when S5.0 in the energy band.
(1)
(2)
(3)
(4)
(5)
(6)
(7)
(8)
(9)
(10)
No.
MAXI SSC Name
RA
DEC
flux
identification
GSC-ID
degree
degree
10-11erg sec-1 cm-2
soft
hard
soft
hard
\endfirsthead (1)
(2)
(3)
(4)
(5)
(6)
(7)
(8)
(9)
(10)
No.
MAXI SSC Name
RA
DEC
flux
identification
GSC ID
degree
degree
10-11erg sec-1 cm-2
soft
hard
soft
hard
\endhead\endfoot\endlastfoot1 1MAXIS J0006+728 1.73 72.87 6.0 1.7 3.3 - CTA 1(SNR) 2MAXI J0004+726
2 1MAXIS J0025+641 6.41 64.14 28.4 22.9 22.9 31.1 Tycho SNR(SNR)
3 1MAXIS J0034+596 8.61 59.65 4.3 5.9 - 8.6 1ES 0033+595(AGN)
4 1MAXIS J0042-094 10.52 -9.45 8.1 4.9 3.7 - Abell 85(GC) 2MAXI J0041-092
5 1MAXIS J0056+606 14.04 60.68 8.7 9.7 5.1 13.0 Gamma Cas(Star)
6 1MAXIS J0116-735 19.16 -73.52 5.9 12.3 2.3 13.0 SMC X-1(Binary-Pulsar) 2MAXI J0117-734
7 1MAXIS J0146+617 26.65 61.75 10.7 6.8 6.8 11.4 4U 0142+61(Isolated Pulser)
8 1MAXIS J0153+361 28.31 36.14 5.3 3.0 3.0 - Abell 262(GC) 2MAXI J0151+361
9 1MAXIS J0246-584 41.61 -58.47 6.8 0.4 2.5 - 2MAXI J0243-582(Unknown) 2MAXI J0243-582
10 1MAXIS J0254+415 43.74 41.55 7.2 6.7 4.7 10.1 AWM 7(GC) 2MAXI J0254+416
11 1MAXIS J0258+133 44.65 13.35 7.2 10.2 2.8 10.7 Abell 401(GC) 2MAXI J0258+135
12 1MAXIS J0320+415 50.01 41.52 42.4 49.5 37.0 94.3 Perseus Cluster(GC) 2MAXI J0319+415
13 1MAXIS J0326+286 51.59 28.62 9.0 3.6 2.7 - UX Ari(Star) 2MAXI J0326+287
14 1MAXIS J0337+006 54.28 0.66 10.0 5.2 5.0 6.9 HR1099(Star) 2MAXI J0336+006
15 1MAXIS J0338+100 54.63 10.04 6.1 4.4 3.3 - ZwCl 0335+0956(GC) 2MAXI J0339+100
16 1MAXIS J0339-353 54.83 -35.39 9.5 3.6 5.8 - FORNAX(GC)
17 1MAXIS J0354+310 58.72 31.05 15.9 38.0 8.5 50.7 X Per(Binary-Pulsar) 2MAXI J0355+311
18 1MAXIS J0413+105 63.44 10.54 6.6 7.5 2.6 6.9 Abell 478(GC) 2MAXI J0413+106
19 1MAXIS J0430-613 67.61 -61.36 5.8 4.2 3.5 - Abell 3266(GC) 2MAXI J0431-613
20 1MAXIS J0433-132 68.39 -13.27 8.1 4.9 3.4 - Abell 496(GC) 2MAXI J0433-131
21 1MAXIS J0450+450 72.63 45.02 7.0 10.8 4.8 15.5 3C 129(AGN)
22 1MAXIS J0451-037 72.91 -3.75 2.2 5.9 - 2.4 MCG -01-13-025(AGN) 2MAXI J0450-035
23 1MAXIS J0500+518 75.10 51.82 16.7 1.3 12.5 - G156.2+5.7(SNR)
24 1MAXIS J0500+461 75.24 46.17 8.1 -0.6 6.3 - HB9(SNR)
25 1MAXIS J0514-401 78.60 -40.15 9.0 9.7 6.7 11.5 4U 0513-40(Binary-NS) 2MAXI J0514-399
26 1MAXIS J0517+459 79.37 45.97 9.1 -2.1 6.0 - 1RXS J051642.2+460001(GC)
27 1MAXIS J0518-720 79.66 -72.02 17.3 27.1 9.6 36.4 LMC X-2(Binary-NS) 2MAXI J0520-719
28 1MAXIS J0531-661 82.98 -66.12 15.5 8.5 8.8 8.7 LMC X-4(Binary-Pulsar) 2MAXI J0532-663
29 1MAXIS J0534+220 83.64 22.03 309.5 366.4 816.2 1816.0 Crab(Isolated-Pulsar)
30 1MAXIS J0535-054 83.78 -5.40 15.9 10.6 6.8 11.0 2MAXI J0535-052(Star Culster) 2MAXI J0535-052
31 1MAXIS J0536-697 84.20 -69.72 36.4 31.0 30.7 46.9 LMC X-1(Binary-BH) 2MAXI J0539-696
32 1MAXIS J0538-641 84.65 -64.18 25.0 21.9 17.2 28.2 LMC X-3(Binary-BH) 2MAXI J0539-640
33 1MAXIS J0539+263 84.81 26.31 7.5 25.7 3.5 31.3 A 0535+262(Binary-Pulsar)
34 1MAXIS J0551-074 87.97 -7.48 0.5 5.7 - 8.3 NGC 2110(AGN) 2MAXI J0552-073
35 1MAXIS J0556-332 89.18 -33.22 7.2 8.3 4.0 9.7 MAXI J0556-332(Binary-NS) 2MAXI J0556-331
36 1MAXIS J0602+286 90.65 28.69 5.9 5.6 2.9 6.4 MAXI J0602+291(Unknown)
37 1MAXIS J0603+292 90.79 29.23 5.2 6.7 2.1 5.7 MAXI J0602+291(Unknown)
38 1MAXIS J0617+091 94.30 9.17 69.9 68.9 55.8 108.3 H 0614+091(Binary-NS)
39 1MAXIS J0617+225 94.30 22.59 39.9 9.1 21.7 10.0 IC 443 SNR(SNR)
40 1MAXIS J0743+288 115.93 28.84 6.8 4.0 2.9 - 2MAXI J0744+288(Unknown) 2MAXI J0744+288
41 1MAXIS J0817-075 124.40 -7.58 6.7 5.4 2.5 5.8 Abell 644(GC) 2MAXI J0817-074
42 1MAXIS J0822-429 125.71 -42.94 152.1 19.1 339.3 29.6 Pup A(SNR)
43 1MAXIS J0834-455 128.65 -45.54 19.4 15.6 9.6 22.2 Vela Pulsar/SNR(Isolated Pulsar/SNR)
44 1MAXIS J0850-461 132.56 -46.19 27.6 7.0 26.5 7.1 RX J0852.0-4622(SNR)
45 1MAXIS J0902-406 135.51 -40.60 4.0 39.0 - 65.1 Vela X-1(Binary-Pulsar)
46 1MAXIS J0908-097 137.23 -9.77 7.4 7.5 3.6 9.0 Abell 754(GC) 2MAXI J0909-096
47 1MAXIS J0917-120 139.44 -12.06 6.3 5.2 2.4 4.5 MAXI J0918-121(Unknown) 2MAXI J0918-119
48 1MAXIS J0920-553 140.09 -55.30 13.4 15.9 10.1 23.7 1H 0918-548(Binary-NS)
49 1MAXIS J0922-631 140.70 -63.14 3.4 5.5 - 7.0 2S 0921-63(Binary-NS)
50 1MAXIS J0924-317 141.15 -31.76 4.3 7.2 - 8.8 X 0922-314(Unknown) 2MAXI J0924-316
51 1MAXIS J0947-310 146.83 -31.04 0.9 5.2 - 8.7 MCG -05-23-016(AGN) 2MAXI J0947-308
52 1MAXIS J1009-583 152.38 -58.36 3.0 24.0 - 38.2 GRO J1008-57(Binary-Pulsar)
53 1MAXIS J1020-038 155.12 -3.81 2.3 5.6 - 1.4 2MAXI J1020-034(AGN) 2MAXI J1020-034
54 1MAXIS J1029-353 157.39 -35.40 6.1 3.1 4.5 - 2MAXI J1030-351(Unknown) 2MAXI J1030-351
55 1MAXIS J1036-274 159.24 -27.43 7.5 5.3 3.3 7.6 Abell 1060(GC) 2MAXI J1036-275
56 1MAXIS J1045-597 161.26 -59.76 15.6 9.7 11.6 12.6 Eta Car(Star)
57 1MAXIS J1102-610 165.50 -61.05 6.2 -8.9 5.2 - MSH 11-61A(SNR)
58 1MAXIS J1104+381 166.11 38.16 29.0 15.2 16.1 17.1 Mrk 421(AGN) 2MAXI J1104+382
59 1MAXIS J1120-606 170.15 -60.68 14.6 52.1 7.8 85.5 Cen X-3(Binary-Pulsar)
60 1MAXIS J1123-593 170.96 -59.37 22.4 21.8 13.0 6.4 MSH 11-54(SNR)
61 1MAXIS J1139-654 175.00 -65.45 9.6 5.8 4.6 7.4 4U 1137-65(Star)
62 1MAXIS J1144+197 176.16 19.77 10.3 9.0 4.1 7.2 Abell 1367(GC) 2MAXI J1144+198
63 1MAXIS J1147-623 176.99 -62.32 6.1 7.2 3.7 7.0 1E1145.1-6141(Binary-Pulsar)
64 1MAXIS J1210+392 182.64 39.22 0.6 9.3 - 14.2 NGC 4151(AGN) 2MAXI J1210+394
65 1MAXIS J1216-652 184.06 -65.26 7.5 -0.6 4.5 - 4U 1210-64(Binary-NS)
66 1MAXIS J1219+301 184.95 30.17 11.5 6.9 4.7 6.9 Mrk 766(AGN) 2MAXI J1220+300
67 1MAXIS J1225-629 186.43 -62.91 2.1 15.8 - 23.5 GX 301-2(Binary-Pulsar)
68 1MAXIS J1229+020 187.27 2.09 7.2 9.8 3.7 8.3 3C 273(AGN) 2MAXI J1229+021
69 1MAXIS J1229+082 187.50 8.26 6.4 4.8 2.3 - 1H1228+081(Unknown)
70 1MAXIS J1230+123 187.69 12.37 57.2 39.0 39.3 46.2 M 87(AGN) 2MAXI J1230+124
71 1MAXIS J1249-413 192.27 -41.32 14.2 13.6 11.6 18.4 Centaurus Cluster(GC) 2MAXI J1249-412
72 1MAXIS J1250-592 192.61 -59.25 7.8 9.3 5.2 10.7 1A 1246-588(Binary-NS)
73 1MAXIS J1253-295 193.45 -29.52 8.7 12.4 5.6 12.0 EX Hya(Binary-WD) 2MAXI J1252-291
74 1MAXIS J1257-693 194.27 -69.35 25.5 40.9 18.0 63.0 4U 1254-690(Binary-NS)
75 1MAXIS J1259+278 194.87 27.89 28.2 28.7 14.4 32.7 Coma Cluster(GC) 2MAXI J1259+279
76 1MAXIS J1300-617 195.18 -61.72 0.3 23.2 - 36.7 GX 304-1(Binary-Pulsar)
77 1MAXIS J1316-163 199.09 -16.33 5.9 2.8 2.8 - NGC 5044(GC)
78 1MAXIS J1325-431 201.39 -43.15 -1.5 11.5 - 15.9 Cen A(AGN) 2MAXI J1325-429
79 1MAXIS J1325-626 201.49 -62.62 0.0 7.3 - 7.3 4U 1323-619(Binary-NS)
80 1MAXIS J1329-316 202.48 -31.66 8.3 4.3 5.9 - Abell 3558(GC) 2MAXI J1329-315
81 1MAXIS J1347-329 206.95 -32.90 4.9 7.7 - 7.9 Abell 3571(GC) 2MAXI J1347-328
82 1MAXIS J1349+265 207.26 26.56 7.0 4.1 3.1 - Abell 1795(GC) 2MAXI J1348+267
83 1MAXIS J1349-303 207.32 -30.39 4.0 6.2 - 7.8 IC 4329A(AGN) 2MAXI J1349-302
84 1MAXIS J1413-033 213.46 -3.31 0.0 8.4 - 7.6 NGC 5506(AGN) 2MAXI J1413-030
85 1MAXIS J1441-627 220.44 -62.73 17.6 3.0 14.0 - RCW 86(SNR)
86 1MAXIS J1502-420 225.75 -42.04 10.9 5.2 6.7 6.8 SN 1006(SNR) 2MAXI J1503-421
87 1MAXIS J1511+058 227.98 5.85 5.6 8.7 3.1 7.2 Abell 2029(GC) 2MAXI J1511+059
88 1MAXIS J1513-591 228.40 -59.14 7.0 10.1 4.7 12.4 PSR B1509-58(Isolated Pulsor)
89 1MAXIS J1520-572 230.07 -57.28 1.2 18.3 - 15.0 Cir X-1(Binary-NS)
90 1MAXIS J1541-525 235.49 -52.52 -0.8 12.6 - 15.0 4U 1538-52(Binary-Pulsar)
91 1MAXIS J1544-563 236.05 -56.39 1.2 8.7 - 10.5 MAXI J1543-564(Binary-BH)
92 1MAXIS J1547-626 236.82 -62.67 25.8 36.0 22.6 59.2 4U 1543-624(Binary-NS/BH)
93 1MAXIS J1558+270 239.64 27.09 5.3 6.3 2.3 7.6 Abell 2142(GC) 2MAXI J1558+272
94 1MAXIS J1603+162 240.77 16.22 7.9 6.3 3.9 5.0 Abell 2147(GC) 2MAXI J1602+161
95 1MAXIS J1603-608 241.00 -60.82 10.4 19.7 2.5 13.9 1H 1556-605(Binary-NS/BH)
96 1MAXIS J1610-608 242.69 -60.81 14.1 19.2 5.4 11.8 2MASX J16115141-6037549(AGN)
97 1MAXIS J1612-524 243.11 -52.47 44.1 107.1 49.9 303.0 4U 1608-52(Binary-NS)
98 1MAXIS J1614+338 243.67 33.89 8.4 1.2 5.2 - HB89 1611+343(AGN)
99 1MAXIS J1619-156 244.98 -15.63 801.6 1270.3 5258.0 20635.5 Sco X-1(Binary-NS) 2MAXI J1619-155
100 1MAXIS J1629+393 247.29 39.36 6.1 9.0 4.3 12.9 Abell 2199(GC) 2MAXI J1628+396
101 1MAXIS J1632-675 248.05 -67.56 15.0 19.1 9.7 29.1 4U 1626-67(Binary-Pulsar) 2MAXI J1632-674
102 1MAXIS J1638-644 249.64 -64.43 9.2 13.6 5.1 15.2 TrA Cluster(GC) 2MAXI J1638-643
103 1MAXIS J1640-538 250.18 -53.80 40.1 59.4 39.1 112.0 H 1636-536(Binary-NS)
104 1MAXIS J1645-456 251.41 -45.67 11.6 160.3 9.6 648.5 GX 340+0(Binary-NS)
105 1MAXIS J1654+396 253.64 39.66 11.7 10.6 9.2 14.0 Mrk 501(AGN) 2MAXI J1653+398
106 1MAXIS J1657+352 254.48 35.29 6.4 11.0 3.1 14.8 Her X-1(Binary-Pulsar) 2MAXI J1658+353
107 1MAXIS J1705+787 256.42 78.79 7.5 9.7 2.7 6.7 Abell 2256(GC) 2MAXI J1704+785
108 1MAXIS J1705-364 256.44 -36.46 116.4 267.9 184.9 1293.8 GX 349+2(Binary-NS)
109 1MAXIS J1706+240 256.59 24.01 2.5 5.8 - 6.6 4U 1700+24(Binary-NS) 2MAXI J1706+240
110 1MAXIS J1708-440 257.13 -44.09 36.9 127.3 39.9 390.0 4U 1705-440(Binary-NS)
111 1MAXIS J1712-407 258.06 -40.76 13.9 37.2 1.9 29.5 4U 1708-40(Binary-NS)
112 1MAXIS J1712-234 258.09 -23.41 22.2 34.9 14.9 48.1 Ophiuchus Cluster(GC)
113 1MAXIS J1713-399 258.32 -39.94 16.8 33.2 7.2 11.0 RX J1713.7-3946(SNR)
114 1MAXIS J1727-308 261.90 -30.83 12.3 27.7 8.1 41.1 Terzan 2/4U 1722-30(Binary-NS)
115 1MAXIS J1730-215 262.73 -21.59 14.5 2.1 9.5 - Kepler SNR(SNR)
116 1MAXIS J1731-169 262.93 -16.96 93.9 148.6 105.2 377.9 GX 9+9(Binary-NS)
117 1MAXIS J1732-338 263.02 -33.87 12.2 68.6 10.7 155.6 GX 354-0(Binary-NS)
118 1MAXIS J1738-444 264.70 -44.49 60.4 102.6 80.7 279.6 H 1735-444(Binary-NS)
119 1MAXIS J1745-292 266.40 -29.26 1.1 85.4 - 214.2 KS 1741-293(Binary-NS)
120 1MAXIS J1746-322 266.52 -32.26 1.5 19.7 - 24.4 H 1743-322(Binary-BH)
121 1MAXIS J1747-267 266.94 -26.78 44.5 177.7 47.2 639.8 GX 3+1(Binary-NS)
122 1MAXIS J1749-370 267.50 -37.05 20.4 41.6 17.2 68.8 4U 1746-37(Binary-NS)
123 1MAXIS J1753-014 268.36 -1.43 55.9 38.8 38.7 54.8 Swift J1753.5-0127(Binary-BH) 2MAXI J1753-013
124 1MAXIS J1801-250 270.28 -25.09 50.7 313.3 53.8 1759.5 GX 5-1(Binary-NS)
125 1MAXIS J1801-205 270.38 -20.52 58.6 229.6 59.3 965.7 GX 9+1(Binary-NS)
126 1MAXIS J1811-229 272.87 -22.98 5.6 7.6 4.0 14.5 V5588 Sgr(Binary-WD)
127 1MAXIS J1814-171 273.64 -17.15 31.3 176.1 23.8 578.2 GX 13+1(Binary-NS)
128 1MAXIS J1816-140 274.01 -14.03 58.6 250.6 53.7 1047.3 GX 17+2(Binary-NS)
129 1MAXIS J1823-303 275.90 -30.37 95.2 143.6 150.7 461.8 NGC 6624(Binary-NS)
130 1MAXIS J18250000 276.36 -0.01 14.8 31.5 8.8 48.5 H 1822-000(Binary-NS/BH)
131 1MAXIS J1825-371 276.37 -37.15 2.9 18.6 - 30.9 4U 1822-371 V691 CrA(Binary-NS) 2MAXI J1825-370
132 1MAXIS J1829-238 277.37 -23.83 17.2 40.2 12.4 62.6 GS 1826-238(Binary-NS)
133 1MAXIS J1832-103 278.09 -10.31 -1.3 9.6 - 14.3 G21.5-0.9(SNR)
134 1MAXIS J1835-193 278.94 -19.31 9.8 5.8 4.7 5.7 MAXI J1836-194(Binary-BH)
135 1MAXIS J1840+050 280.02 5.06 76.7 125.0 96.4 377.6 Ser X-1(Binary-NS)
136 1MAXIS J1841-053 280.33 -5.30 7.3 13.0 1.1 10.7 1E 1841-045(Isolated Pulsar)
137 1MAXIS J1844-058 281.03 -5.81 8.9 7.8 2.0 3.1
138 1MAXIS J1846-029 281.59 -2.97 0.8 11.3 - 10.9 AX J1844.8-0258/AX J1845-0258(Binary-NS/BH)
139 1MAXIS J1852+797 283.09 79.79 5.4 9.4 1.2 4.1 3C 390.3(AGN) 2MAXI J1842+797
140 1MAXIS J1853-086 283.27 -8.69 12.3 11.2 7.5 15.8 4U 1850-086(Binary-NS)
141 1MAXIS J1855-009 283.86 -0.98 5.0 1.5 4.6 -
142 1MAXIS J1855+013 283.99 1.32 9.5 8.0 5.8 9.7 1H1852+015(Unknown)
143 1MAXIS J1900-249 285.03 -24.95 26.3 27.5 23.3 44.1 HETE J1900.1-2455(Binary-NS) 2MAXI J1900-248
144 1MAXIS J1910-057 287.61 -5.78 114.9 80.9 218.3 219.5 MAXI J1910-057(Binary-BH)
145 1MAXIS J1911+005 287.81 0.50 12.8 17.0 9.6 28.4 Aql X-1(Binary-NS)
146 1MAXIS J1912+048 288.05 4.88 5.2 8.1 3.3 9.6 SS 433(Binary-NS/BH)
147 1MAXIS J1915+110 288.84 11.03 37.3 257.6 28.3 1294.7 GRS 1915+105(Binary-BH)
148 1MAXIS J1918-051 289.74 -5.18 6.6 12.2 0.9 15.6 4U 1916-053(Binary-NS)
149 1MAXIS J1921+438 290.35 43.87 10.0 9.4 6.9 10.4 Abell 2319(GC) 2MAXI J1921+440
150 1MAXIS J1930+097 292.74 9.79 5.3 6.1 1.9 -6.1 2FGL J1931.1+0938(AGN)
151 1MAXIS J1933+312 293.32 31.25 7.8 0.5 4.3 - G65.3+5.7(SNR)
152 1MAXIS J1937-062 294.40 -6.22 5.0 1.5 2.5 - 1H 1934-063(AGN) 2MAXI J1937-060
153 1MAXIS J1958+351 299.58 35.14 306.3 274.7 1054.8 1348.8 Cyg X-1(Binary-BH)
154 1MAXIS J1959+116 299.86 11.68 38.0 51.1 30.1 96.8 4U 1957+115(Binary-BH)
155 1MAXIS J2001+651 300.29 65.16 12.4 7.7 6.6 8.0 1ES 1959+650(AGN) 2MAXI J1959+651
156 1MAXIS J2019+404 304.89 40.41 7.8 1.1 5.0 - Cygnus Super Bubble(SNR)
157 1MAXIS J2032+374 308.07 37.48 -2.1 11.8 - 14.5 EXO 2030+375(Binary-Pulsar)
158 1MAXIS J2032+409 308.09 40.91 2.6 87.7 - 208.9 Cyg X-3(Binary-BH)
159 1MAXIS J2044-106 311.05 -10.68 6.0 6.5 2.0 3.7 Mrk 509(AGN) 2MAXI J2044-106
160 1MAXIS J2051+308 312.77 30.80 98.5 5.8 56.9 2.9 Cygnus Loop(SNR)
161 1MAXIS J2053+314 313.27 31.47 103.0 3.3 86.6 - Cyg Loop(SNR)
162 1MAXIS J2103+456 315.95 45.67 3.0 6.1 - 6.1 V407 Cyg(Binary-WD)
163 1MAXIS J2110+466 317.63 46.67 5.9 1.0 4.6 - Cygnus Super Bubble(SNR)
164 1MAXIS J2130+121 322.54 12.17 22.3 22.6 11.6 26.9 M 15/4U 2127+119(Binary-NS) 2MAXI J2130+122
165 1MAXIS J2144+382 326.18 38.29 149.9 224.5 289.7 990.8 Cyg X-2(Binary-NS) 2MAXI J2144+383
166 1MAXIS J2253+167 343.41 16.75 6.7 3.4 3.9 - IM Peg(Star) 2MAXI J2253+166
167 1MAXIS J2256-030 344.11 -3.07 2.8 6.4 - 2.9 AO Psc(Binary-WD) 2MAXI J2255-030
168 1MAXIS J2302+589 345.53 58.96 12.4 3.0 10.5 - 2E 2259.0+5836(Binary-NS/BH)
169 1MAXIS J2323+588 350.83 58.81 59.6 61.1 74.6 130.4 Cas A(SNR)
170 1MAXIS J2355+286 358.92 28.67 6.4 1.2 2.5 - II Peg(Star) 2MAXI J2354+286