Terrestrial planets across space and time
Abstract
The study of cosmology, galaxy formation and exoplanets has now advanced to a stage where a cosmic inventory of terrestrial planets may be attempted. By coupling semi-analytic models of galaxy formation to a recipe that relates the occurrence of planets to the mass and metallicity of their host stars, we trace the population of terrestrial planets around both solar-mass (FGK type) and lower-mass (M dwarf) stars throughout all of cosmic history. We find that the mean age of terrestrial planets in the local Universe is Gyr for FGK hosts and Gyr for M dwarfs. We estimate that hot Jupiters have depleted the population of terrestrial planets around FGK stars by no more than , and that only of the terrestrial planets at the current epoch are orbiting stars in a metallicity range for which such planets have yet to be confirmed. The typical terrestrial planet in the local Universe is located in a spheroid-dominated galaxy with a total stellar mass comparable to that of the Milky Way. When looking at the inventory of planets throughout the whole observable Universe, we argue for a total of and terrestrial planets around FGK and M stars, respectively. Due to light travel time effects, the terrestrial planets on our past light cone exhibit a mean age of just Gyr. These results are discussed in the context of cosmic habitability, the Copernican principle and searches for extraterrestrial intelligence at cosmological distances.
Subject headings:
Planets and satellites: terrestrial planets – galaxies: formation – cosmology: miscellaneous – extraterrestrial intelligence1. Introduction
The use of transit photometry and radial velocity measurements have in recent years allowed the detection and characterization of large numbers of exoplanets in the same size and mass range as Earth (see Winn & Fabrycky 2015 for a recent review). By coupling the observed occurrence rate of such terrestrial planets to models of star and galaxy formation, it has now become possible to predict the prevalence of Earth-like planets in the Milky Way (e.g. Gonzalez et al., 2001; Lineweaver, 2001; von Bloh et al., 2003; Lineweaver et al., 2004; Prantzos, 2008; Gowanlock et al., 2011; Guo et al., 2009; Bonfils et al., 2013) and Andromeda (Carigi et al., 2013; Spitoni et al., 2014), in other galaxies in the local volume (Gonzalez et al., 2001; Sundin, 2006; Suthar & McKay, 2012; Dayal et al., 2015; Forgan et al., 2015) and even throughout the observable Universe (Wesson, 1990; Lineweaver et al., 2007; Behroozi & Peeples, 2015; Olson, 2015; Dayal et al., 2016; Loeb et al., 2016).
The cosmic evolution of the planet population is relevant for a number of issues in the intersection between astrobiology, cosmology and SETI (the Search for Extraterrestrial Intelligence). The formation time and current age distribution of such planets enters arguments concerning the timing of biogenesis (e.g. von Bloh et al., 2003; Cirkovic, 2004; Vukotic & Cirkovic, 2007), the rate of planet-sterilizing events (Tegmark & Boström, 2005) and anthropic selection biases affecting cosmological parameters (e.g. Lineweaver et al., 2007; Egan & Lineweaver, 2008; Barreira & Avelino, 2011; Larsen et al., 2011), whereas the distributions of planets among galaxies of different type in the local Universe and throughout the observable Universe (i.e. galaxies on our past light cone) are relevant for the prospects of SETI on extragalactic scales (e.g. Annis, 1999; Wright et al., 2014a, b; Griffith et al., 2015; Olson, 2015; Zackrisson et al., 2015; Garrett, 2015). Here, we extend on previous attempts to model the cosmological distribution of planets by coupling semi-analytical models of galaxy formation to a recipe for planet formation that depends on both stellar mass and stellar metallicity. Using this machinery, we predict the spatial and temporal distribution of terrestrial planets (hereafter TPs) in both the local and distant Universe. Throughout this paper, we define TPs as planets in the size and mass range –2.0 , –10 (i.e. both Earth-like planets and and Super-Earths), thereby including solid-surface planets up to largest sizes that could potentially allow habitable conditions according to the definition by Alibert (2014).
Our computational approach is similar to that of Behroozi & Peeples (2015), but differs in the details of the recipe for TP formation, by extending the inventory from solar-like stars (spectral type FGK) to also include low-mass stars (M dwarfs), in the treatment of the stellar metallicity distribution within each galaxy, by considering the impact of the lifetimes of FGK stars on the inventory of present-day TPs, and by presenting our census of TPs in the observable Universe in terms of galaxies on our past light cone (the case relevant for high-redshift SETI) rather than for the galaxies in the present-day Hubble volume.
In section 2, we describe our recipe for TP formation and the galaxy formation models used. Our predicted cosmic inventory of TPs in the local and distant Universe is presented in section 3. Section 4 features a discussion on the potential habitability of these planets and the relevance of our results for the Copernican principle and extragalactic SETI. We also present a comparison to previous estimates to characterize the properties of the exoplanet population on cosmological scales and discuss the associated uncertainties. Section 5 summarizes our findings.
2. Models
2.1. Planet formation
Our recipe for TP formation is similar to that of Lineweaver (2001), in which different metallicity-dependent probabilities are adopted for the formation of terrestrial and giant planets, and in which TPs are assumed to be destroyed by close-orbit giants (“hot Jupiters”). This computational machinery is here applied to a wider class of stars, with parameters updated to reflect recent advances in exoplanet studies and with planet formation probabilities that depend on both stellar metallicity and mass.
Kepler data show that the occurrence rate of TPs of size – with orbital periods days around solar type FGK-stars may be as high as (Petigura et al., 2013). Furthermore, the consensus of both transit and Doppler radial velocity surveys is that the occurrence rate of small rocky planets with orbiting M-dwarf stars is (e.g. Dressing & Charbonneau, 2013, 2015; Bonfils et al., 2013; Tuomi et al., 2014).
Both observations and simulations indicate that stars in metal-enriched environments yield a greater number of giant planets compared to metal-poor environments (e.g. Armitage & Rice, 2008; Johnson et al., 2010). With increasing evidence for a metallicity correlation, Fischer & Valenti (2005) proposed that the occurrence rate of close-in Jupiter-sized giant planets orbiting FGK-type stars can be described by a simple power law. Further investigations by e.g. Gaidos & Mann (2014) suggests that the power law cannot be described by the same parameters for solar type stars (FGK) and low-mass M-dwarfs, implying that there is also a mass correlation embedded in the prevalence of giant planets. Here, we approximate the probability of forming giant planets as the giant planet occurrence rate described by Gaidos & Mann (2014):
| (1) |
where is the mass of the star in solar masses, a constant factor estimated to be 0.07 by Gaidos & Mann (2014), is the metallicity parameter estimated to be and for spectral types FGK and M respectively and the mass correlation parameter assumed to be 1.
Following Lineweaver (2001), we assess the probability of harboring TPs, , by estimating the number of TPs formed as described above, and appraise how many are destroyed by migrating giant planets described by Equation ( 1) as
| (2) |
where is the probability of forming a TP and is the probability of forming a close-orbit giant planet, thus destroying the prospect of harboring a TP in the process. This approach admittedly neglects the intriguing possibility that TPs may reform in the wake of a migrating Jupiter or otherwise survive the ordeal (e.g. Fogg & Nelson, 2009). Moreover, by adopting the parameter values for equation (1) from Gaidos & Mann (2014), we are implicitly assuming that all close-in giant planets considered in their study (orbital period years) are detrimental for TPs – including those that would be classified as warm rather than hot Jupiters. This likely overestimates the impact of close-in giants on the prevalence of TPs, since some warm Jupiters are known to have TP companions (Steffen et al., 2012; Huang et al., 2016). Because of these uncertainties, we in Section 3 present the fraction of TPs that is predicted to be lost due to close-in giants, so that the size of the population potentially missing from our inventory may be estimated.
It is very likely that the probability of forming TPs requires a minimum threshold of metallicity for the host star. At the low-metallicity end, we therefore assume a gradual decrease in the probability of forming terrestrial planets. In earlier work by e.g. Prantzos (2008), the probability to form Earth-like planets is envisioned as a step function going from zero probability to maximum probability at [Fe/H]. In our baseline model, we instead include stars with metallicities all the way down to [Fe/H], which corresponds to the level where the minimum mass solar nebula (Hayashi, 1981) would have insufficient solid materials to form a terrestrial planet () in an Earth-like orbit. Since stars at such low metallicites would most likely struggle to form terrestrial planets, we adopt a function that includes a smooth cut-off at the low-metallicity end:
| (3) |
Here, we adopt for M dwarfs and for FGK stars and a low-metallicity cut-off given by:
| (4) |
for [Fe/H] , but for [Fe/H] . We also assume that the probability for TP formation stays constant at [Fe/H] with at all higher metallicities. The function is admittedly arbitrarily chosen, but as we demonstrate in Section 3.1 and 4.5.4, the exact choice of cut-off function has an insignificant impact on our results.
To be consistent with the isochrones used to estimate stellar lifetimes (see Section 2.2), we adopt a solar metallicity of .
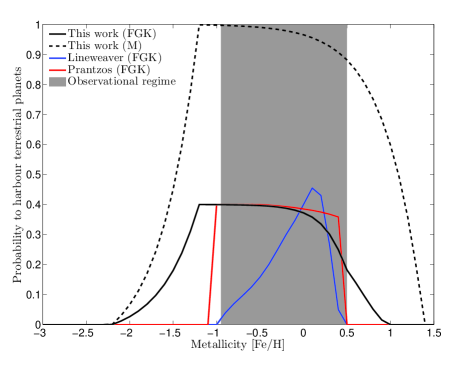
The resulting probability for FGK and M stars to harbor TPs is shown in Figure 1. Our recipe implies an identical metallicity dependence at the low-metallicity end for FGK and M type stars, but a more pronounced probability decrease at the high-metallicity end in the case of FGK stars. This machinery for relating the formation and destruction probability for TPs is very similar to that used by Lineweaver (2001) and Prantzos (2008) for FGK stars, but differs in the details of the adopted metallicity dependencies. As a result, our probability distribution for the occurrence of TPs around FGK stars is far less peaked around the solar value than that of Lineweaver (2001), but still features a high-metallicity drop-off less pronounced than that of Prantzos (2008).
Our TP model also differs in a number of ways compared to the recent works of Behroozi & Peeples (2015) and Dayal et al. (2015), which do not assume that close-in giants have any adverse effects on the formation of TPs around FGK stars, or specifically treat the difference between FGK and M dwarfs. It should be stressed that in contrast to both Behroozi & Peeples (2015) and Dayal et al. (2015), our function in Equation. 2 offers no indication to whether TPs could be habitable or not. A discussion about the prospects of habitability is instead provided in Section 4.1. Behroozi & Peeples (2015) adopt a minimum metallicity for TP occurrence of [Fe/H] based on Johnson & Li (2010), and a constant occurrence at higher metallicities, whereas Dayal et al. (2015) explore cases where either has no metallicity dependence, or a very strong one ().
2.2. Galaxy formation
Semi-analytical models represents a powerful tool to connect high-redshift galaxies to their present-day descendants (for a review, see Baugh, 2006). Here, we use such models to trace the formation of stars and the build-up of heavy elements within galaxies throughout cosmic history.
In this paper, we base our primary results on the version of the Durham semi-analytic model GALFORM described in Baugh (2005) The Durham model has been demonstrated to reproduce the luminosity function of Lyman-break galaxies at , present-day optical and near- and far-infrared luminosity functions and the size-luminosity relation for late-type galaxies (Baugh, 2005; González et al., 2009). It is also in fair agreement with the observed cosmic star formation history (Madau & Dickinson, 2014). When possible, we also use the independent semi-analytic model Galacticus (Benson, 2012) to cross-check the robustness of important conclusions.
From the Durham semi-analytical model, we extract the galaxy population within a simulated comoving box of side 64Mpc/h in 50 redshifts snapshots between z=0 and z=10. This gives us between () and () galaxies per snapshot. The stellar mass range of these galaxies is to at z=0. However, to avoid potential resolution problems at the low-mass end, we will throughout this paper focus on galaxies in the mass range. This is not likely to affect our results in any significant ways, since both our own models and extrapolations of the observed galaxy stellar mass function to lower-mass objects (Kelvin et al., 2014; Moffett et al., 2016a) indicate that the fraction of stellar mass locked up in galaxies is at the sub-percent level.
From every redshift, we extract the internal age and metallicity distribution of the stars of all galaxies. By adopting the Kroupa (2001) universal stellar initial mass function (IMF), we derive the number of FGK type (assumed mass range 0.6–1.2 ) and M dwarf (0.08–0.6 ) subtypes in each metallicity and age bin. According to this IMF, of all stars in the 0.08–120 are born in the M dwarf mass regime whereas are born in the mass range of FGK stars. We then use mass- and metallicity-dependent main sequence lifetimes from the PARSEC v1.2S isochrones (Bressan et al., 2012; Chen et al., 2014; Tang et al., 2014) to remove dead stars from the inventory. In these models, the lifetimes increase with metallicity, going from Gyr at to Gyr at for a mass with a zero age main sequence mass of 1.0 . M dwarfs () always have lifetimes longer than the present age of the Universe throughout this metallicity range and are therefore never removed. The adopted lifetimes are based on scaled solar elemental abundances, and while non-solar abundance ratios will affect the lifetimes, the enhancement of individual elements at the 0.3 dex level is not expected to affects the lifetimes of FG stars by more than (Dotter et al., 2007).
Finally, we apply the mass- and metallicity dependent planet occurrence recipe of Section 2.1 to calculate the number of TPs within the age and metallicity bin of each galaxy at every redshift.
2.3. Cosmology
When converting redshifts into time and computing cosmological volumes required to reconstruct our past light cone, we adopt a flat Cold Dark Matter (CDM) cosmology with , and Hubble constant km s-1 Mpc-1 (Planck collaboration, 2015), giving a current age to the Universe of Gyr. When comparing ages of typical planetary ages at various cosmological epochs to the age of the Earth, Earth is assumed to be 4.54 Gyr old (Dalrymple, 2001).
3. Results
3.1. Terrestrial planets in the local Universe
In Table LABEL:statistics_local, we present a number of statistical quantities predicted by our model for the population of TPs in the local Universe (i.e. averaged over all galaxies within the simulated volume at redshift ). According to our model, the global number of TPs per stellar population mass has a current average of at redshift . Since M dwarfs greatly outnumber the FGK stars, this quantity is completely dominated by TPs around M dwarfs, and the corresponding value for TPs around FGK hosts is about 30 times lower (). Close-in giants are expected to have diminished the current population of TPs around FGK stars by no more than . Given our assumptions in Section 2.1, this fraction is even smaller for M dwarfs (). By , the exhausted lifetimes of FGK host stars have reduced the TP population around such stars by , although this fraction varies slightly with galaxy mass.
3.1.1 Age distribution at
As shown in Table LABEL:statistics_local, the average age of TPs around FGK stars and M dwarfs is currently Gyr and Gyr, respectively (i.e. 2.8 and 3.9 Gyr older than Earth, respectively). The oldest TPs in our simulation have ages of around Gyr (by comparison, the oldest TP known so far has an age of Gyr; Campante et al. 2015). The reason for the slightly lower ages of FGK host planets is mainly due to the shorter lifetimes of such stars. However, the fraction of FGK planets lost due to the exhausted lifetimes of their host stars is no more than 35%, since only the most massive stars (mass higher than , although with a slight metallicity dependence) have main sequence lifetimes shorter than the current age of the Universe.
| Host | ||||
|---|---|---|---|---|
| FGK | M | FGKM | ||
| Mean age of terrestrial planet (Gyr) | 7.3 | 8.4 | 8.3 | |
| Terrestrial planets per | 0.045 | 1.3 | 1.4 | |
| Fraction lost to close-in giants | 0.11 | 0.02 | 0.02 | |
| Fraction outside observed [Fe/H] range | 0.04 | 0.1 | 0.09 |
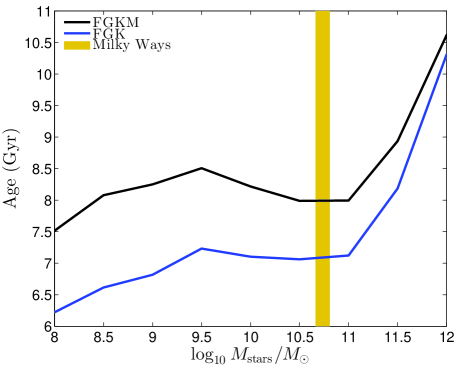
The mean age of TPs shows a dependence on current galaxy mass, as shown in Figure 2. The highest-mass galaxies (giant elliptical galaxies) harbor the oldest planets, as expected from the high average ages of stars in such systems. While the age difference between TPs around FGK and M stars in these galaxies is insignificant, TPs around FGK stars become slightly younger than those around M stars in lower-mass galaxies, and this offset reaches a maximum value of 1.2 Gyr at the low-mass end. This trend is due to a complicated interplay between the mass-metallicity relation of galaxies, the metallicity-lifetime relation for stars and the different star formation histories of low- and high-mass galaxies.
Galaxies at the high-mass end of Figure 2 have higher metallicities, which leads to FGK stars with longer lifetimes. On the other hand, the stars in the highest-mass systems are also typically older than in the lowest-mass galaxies. This leads to a similar fraction of TPs around FGK stars being lost due to exhausted stellar lifetimes in and systems. However, the effect on the mean age of stars surviving until is different in the two cases, since the galaxy populations have far more varied star formation histories and consequently a much broader age distribution. In the galaxies, the removal of the very oldest FGK stars has an insignificant impact on the mean age, since most stars already lie in a limited age interval close to the mean.
3.1.2 Metallicity distribution at
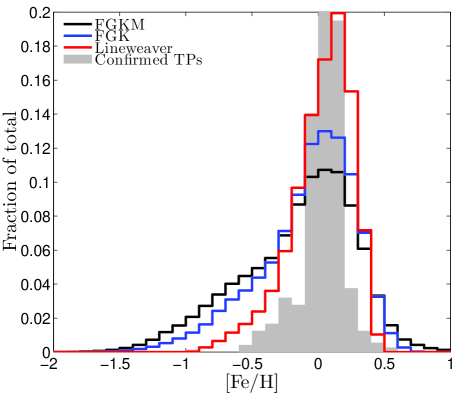
The full metallicity distribution of the TP population in the local Universe is shown in Figure 3. The distribution for FGK hosts (blue), is slightly narrower than that for FGKM hosts (black; dominated by M dwarfs) due to two separate mechanisms that preferentially remove FGK stars in the low- and high-metallicity tails, respectively. Low-metallicity FGK planets have shorter lifetimes than high-metallicity ones, which means that a larger fraction of TP stars are lost at the low-metallicity end of the distributions. TPs around high-metallicity stars are on the other hand more efficiently destroyed by migrating giants, which removes TPs from the high-metallicity end as well.
The red line demonstrates the effect of using the original metallicity relation by Lineweaver (2001), which makes the distribution peak more strongly around the solar metallicity. For comparison, we also plot the distribution of stellar metallicities for currently confirmed TPs (Data from exoplanets.org; Han et al., 2014), which is heavily biased by the selection function of stars in the Milky Way disk and consequently much narrower than our predictions for the cosmological distribution of TPs.
Our model predicts that at redshift , of the TPs are orbiting FGK and M type stars in the metallicity range for which TPs have yet to be detected ([Fe/H] and [Fe/H]; Morton et al. 2016). As further discussed in Section 4.5.4, this conclusion is remarkably robust to the details of the adopted metallicity dependence of the planet occurrence model at [Fe/H]. Even if the probability to harbor TPs were to remain constant down to zero metallicity, this would boost the total number of TPs outside the metallicity range of current detections by less than 1%, simply because the fraction of stars at these very low metallicities is so small.
3.1.3 Terrestrial planets as a function of galaxy mass at
As seen in Figure 3, our predicted distribution has more planets at [Fe/H] than predicted by the Lineweaver (2001) metallicity relations. This directly affects the expected prevalence of TPs in low-mass galaxies, where such metallicities are common. The Lineweaver (2001) recipe would render galaxies at largely barren of TPs. No corresponding decline in planet numbers is predicted by our model, as demonstrated in Figure 4, where the predicted number of TPs per stellar population mass is plotted as a function of galaxy mass.
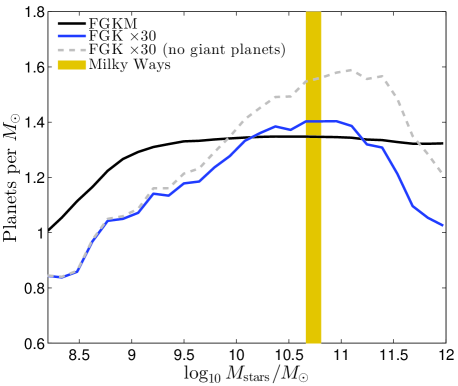
Instead, this quantity stays roughly constant at TPs per stellar population mass for TPs around FGKM host stars throughout the – galaxy mass range, and only drops by % for FGKM host stars in low-mass galaxies () compared to galaxies in the mass range of the Milky Way (stellar mass 4–6; McMillan 2011). This reduction in TPs per total stellar mass in low-mass galaxies is due to a lack of heavy elements from which TPs are made, and is further augmented in the case of FGK host stars due to the reduced lifetimes of such stars at low metallicities. The number of TPs around FGK stars also drops at high metallicities, primarily because of the high average ages of stars in the most massive galaxies. These systems also have the highest metallicities, but the boosted stellar lifetimes resulting from this are not quite sufficient to counterweight the exhausted-lifetimes effect. The gray dashed line shows the corresponding predictions with the effect of close-in giants on TPs around FGK stars switched off. As seen, close-in giants have also reduced the planet population in high-mass galaxies, but this effect affects a much wider range of galaxy masses and is not responsible for the downturn in the the number of TPs around FGK stars per stellar population mass at .
A typical galaxy in the mass range of the Milky Way (stellar mass 4–6; McMillan 2011) is expected to harbor 5– TPs around M stars and 2– TPs around FGK stars. While our simulated galaxy catalogs are inadequate for addressing planet formation for galaxies , the observed-mass metallicity relation for dwarf galaxies (Kirby et al., 2013) suggests that the low-metallicity cut-off in planet formation adopted in this work would not cause any order-of-magnitude decline in the planet population of galaxies until one enters the galaxy mass range.
Another interesting consequence of Figure 4 is that galaxies like the Large Magellanic Cloud (LMC; stellar mass ; Harris & Zaritsky 2009) are predicted not to be significantly depleted in TPs, but to harbor (around FGK stars) and (FGKM stars) of these. This is stark contrast to the conclusion reached by Zinnecker (2003), who argued that galaxies in the LMC metallicity range may be unable to form TPs as large as Earth. However, we note that transit data have already started to turn up rocky planets even larger than Earth (Buchhave et al., 2012; Torres et al., 2015) at metallicities at the upper range of those relevant for the inner regions of LMC (Piatti & Geisler, 2013). Based on the observed age-metallicity relation for the LMC (Piatti & Geisler, 2013) and the LMC star formation history of Harris & Zaritsky (2009), our metallicity recipe for planet occurrence suggests that the average TP in the LMC should be significantly younger than the cosmic average – the mean age is predicted to be about 1 Gyr older than Earth for TPs around M dwarfs, and 0.8 Gyr younger than Earth for TPs around FGK stars.
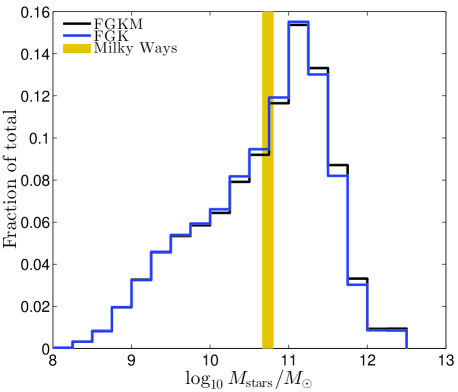
In Figure 5, we show the distribution of TPs across the galaxies of different masses at . The median galaxy mass of the TP-weighted distribution is , i.e. quite similar to that of the Milky Way (wheres the mean is ). Interestingly, this suggests that most TPs are locked up in spheroid-dominated galaxies and not in a disk-dominated galaxy like the Milky Way, since the former type starts to dominate at stellar masses (Kelvin et al., 2014; Moffett et al., 2016a). The fact that Earth does not appear to be located in the most common type of TP-bearing galaxy, and the how this relates to the Copernican/mediocrity principle, is further discussed in Section 4.2.
3.2. Terrestrial planets throughout the observable Universe
In our census of TPs throughout the observable Universe, we consider the population of TPs within all galaxies on our past light cone – i.e. within a spherical volume whose outer radius is bounded by the maximum light travel time distance allowed by the current age of the Universe, and within which the cosmic epoch considered is a function of distance (or, equivalently, redshift ) from us. Galaxies, stars and planets at larger distances within this volume are seen at progressively earlier epochs in the history of the Universe. This definition of “observable Universe” differs from that of Behroozi & Peeples (2015), which instead consider the current state of the planet population in a cosmological volume of this order. However, due to the finite speed of light, the latter population cannot be directly observed.
In Table LABEL:statistics_highz we present our results concerning the statistical quantities for the population of TPs on our past light cone. The total number of TPs around FGKM stars in the observable Universe is estimated to be . Analogous to the case at (Section 3.1), this number is completely dominated by M dwarf planets (), and the corresponding number for FGK stars is .
3.2.1 Age distribution at high redshift
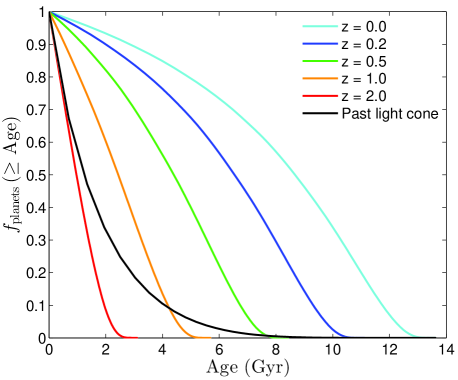
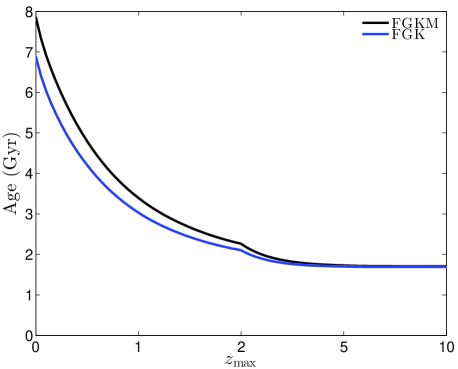
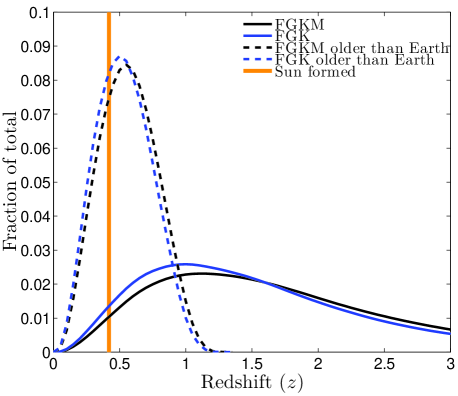
Since the typical ages of TPs decrease as more distant regions on our past light cone are considered, the average TP age in the observable Universe comes out at billion year, i.e. almost 3 Gyr younger than Earth. The age distribution at a few different redshifts, along with the total distribution for the whole observable Universe is shown in Figure 7a. In Figure 7b, we show how the mean TP age for all objects on the past light cone evolves as the maximum considered redshift is increased. This mean TP age approaches the average age of TPs throughout the whole observable Universe reported in Table LABEL:statistics_highz at and changes insignificantly as higher redshifts are considered, due to the small number of planets at earlier epochs (as further discussed in Section 3.2.3). The difference in mean age between FGK and M-type host planets also becomes increasingly insignificant at larger limiting redshifts, since fewer FGK stars in the high redshift have died because of old age.
3.2.2 Terrestrial planets as a function of galaxy mass at high redshift
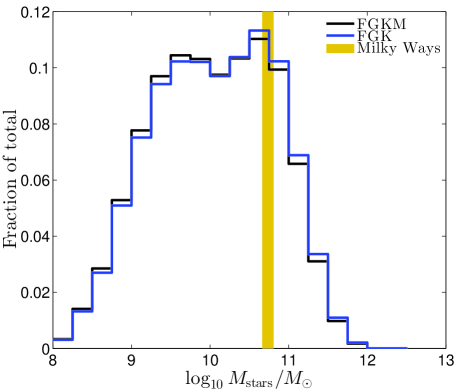
Since galaxy formation progresses hierarchically, high-mass galaxies were more rare in the past. The mean galaxy mass was therefore lower at earlier epochs on our past light cone, and the distribution of TPs across the galaxy population is therefore somewhat different compared to the local Universe. This is demonstrated in Figure 6, which shows that the typical TP on our past light cone is sitting inside a galaxy with a typical mass considerably lower than the that at (Figure 5). The median galaxy mass in the distribution in Figure 6 is , whereas the mean galaxy mass is .
3.2.3 Distribution on the past light cone
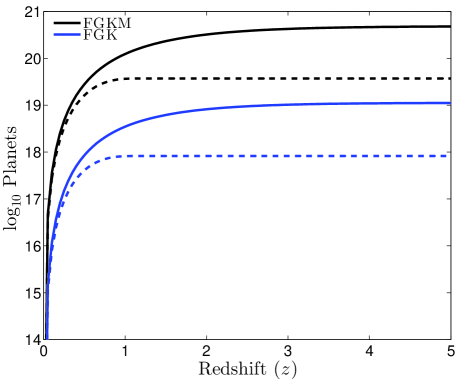
The small contribution from the highest-redshift TPs to the statistics for the whole observable Universe can be understood from Figure 8, where we plot the number distribution of TPs as a function of redshift within the volume spanned by our observable Universe. The modest contribution from TPs at the highest redshift is mainly due to inefficient star formation (and not inefficient TP formation) at these early epochs. Even though the light cone volume increases by a factor of between and , this is offset by the lower star formation rate density and the smaller time interval per unit redshift in the early history of the Universe. Consequently, stars at only add a few percent to the total stellar mass on our past light cone.
In Figure 8, we also show the cumulative number of TP within the volume subtended by our past light cone out to a redshift . As this redshift limit approaches that of the earliest epochs of star formation, the cumulative number of TPs approaches the total number of TPs in the whole observable Universe. As seen, the number increases relatively little beyond the peak of cosmic star formation (; Madau & Dickinson, 2014), and we consequently find that 90% of all TPs on our past light cone are at . When considering only planets older than Earth, this limit is reached at even lower redshifts, since no objects older than Earth can exist at in the adopted cosmology. Hence, we find that 90% of the TPs older than Earth are at .
4. Discussion
4.1. Habitability
While the focus of this paper is on the prevalence of TPs on cosmological scales, it is primarily the subset of TPs that are able to sustain life that are relevant for astrobiology and SETI. While the requirements for planet habitability remains much debated (for a recent review see Gonzalez, 2014), the most common approach when discussing habitability on galactic scales is to start from a condition on the ability for planets to maintain liquid water (usually based on some variation on the moist greenhouse circumstellar zone of Kasting et al. 1993; e.g. Kopparapu 2013; Petigura et al. 2013).
Current attempts to estimate the occurrence rate of TPs located in the circumstellar habitable zone indicate a fraction for solar-type stars (Petigura et al., 2013; Batalha, 2014) and –0.5 for M dwarfs (Kopparapu et al., 2013; Dressing & Charbonneau, 2015). These estimates are lower by factors of (FGK hosts) and –1/2 (M dwarfs) compared to the occurrence rates adopted in section 2.1 (; ) for the full TP population. Hence, a first-order approach would be to simply scale down the number of planets in Table LABEL:statistics_local and LABEL:statistics_highz by factors of this order.
| Host | ||||
|---|---|---|---|---|
| FGK | M | FGKM | ||
| Total number | 1.1e19 | 4.7e20 | 4.8e20 | |
| Mean age of terrestrial planet (Gyr) | 1.7 | 1.7 | 1.7 | |
| Terrestrial planets per | 0.035 | 1.3 | 1.3 | |
| Fraction lost to close-in giants | 0.11 | 0.01 | 0.02 | |
| Fraction outside observed [Fe/H] range | 0.06 | 0.15 | 0.15 |
So far, we have included all planets of size in our definition of TPs. However, the habitability of super-Earths () is still a matter of debate. Seager et al. (2013) argue that super-Earths need to be studied in individual cases, as those that develop a gaseous envelope may not be very habitable. Adibekyan et al. (2015) also argue for a metallicity dependency for the potential habitability of super-Earths, arguing that super-Earths around metal-poor stars are found on tighter orbits than super-Earths around more metal-rich stars. By removing super-Earths from our estimates (and hence only include terrestrial planets of size ) using the relative distribution of sizes from Petigura et al. (2013) for FGK hosts and Dressing & Charbonneau (2015) for M-dwarf hosts, we reduce the occurrence rates of TPs in habitable zones to and , i.e. a reduction by a factor of to the corresponding estimates including super-Earths.
Another open question is whether M-dwarfs can be associated with habitability in the same sense as solar-type stars. The inward migration of the habitable zone during the early stages of evolution of M dwarfs, along with the X-rays, extreme ultraviolet radiation and flares produced by these stars, may drastically erode a stable atmosphere and the prospects of liquid water (e.g. Segura et al., 2005; Scalo, 2007; Ramirez & Kaltenegger, 2014; Luger & Barnes, 2015; Tian & Ida, 2015). Sengupta (2015) argue that only a handful of the M-dwarfs with confirmed planets in the habitable zone meet the criteria for having Earth-like habitable conditions. Planets within the habitable zone of low-mass stars may also experience synchronous rotation and be tidally locked (Kasting et al., 1993), leading to an unstable climate (Kite et al., 2011).
Hence, a most conservative approach could involve excluding M dwarfs from the habitability discussion altogether and simply consider the FGK planets in Table LABEL:statistics_local and LABEL:statistics_highz. Adopting this strategy and removing super-Earths from the TP inventory would then scale down these estimates by a factor , giving habitable planets around FGK stars per unit total stellar population mass () and habitable planets around FGK stars in the observable Universe.
On galactic scales, there are possibly mechanisms other than the circumstellar habitable zone that affects the ability of planets to sustain life. Proposed effects include supernovae (e.g. Ruderman, 1974; Lineweaver et al., 2004; Prantzos, 2008; Gowanlock et al., 2011; Carigi et al., 2013; Spitoni et al., 2014; Dayal et al., 2015), gamma-ray bursts (e.g. Thomas et al., 2005; Ejzak et al., 2007; Piran & Jimenez, 2014; Dayal et al., 2016), active galactic nuclei (Clarke, 1981; Gonzalez, 2005; Dayal et al., 2016), cosmic rays (e.g. Atri et al., 2013), Oort cloud comet perturbations (e.g. Feng & Bailer-Jones, 2014), encounters with interstellar clouds (Kataoka et al., 2013) and the dynamical and annihilation effects of dark matter (Rampino, 2015). Mellot & Thomas (2011) presents an excellent review on various types of radiation-based threats to life.
While mechanisms of this type are outside the scope of this paper, the expected redshift trend (which is relevant for the SETI argument in section 4.3) is to make life on TPs more difficult to sustain at earlier times in the history of the Universe (see also Dayal et al., 2016). High-redshift galaxies have higher specific star formation rates (e.g. Feulner et al., 2005) and a higher prevalence of active nuclei (e.g. Aird et al., 2012). Since high-redshift galaxies are also more compact (Shibuya et al., 2015), supernovae, gamma-ray burst and active galactic nuclei will affect larger number of planets, and the size evolution may also increase the Oort cloud perturbations due to close encounters with other stars.
4.2. Why are we not living in an elliptical galaxy?
If we assume that all currently habitable terrestrial planets have a small but non-zero probability to develop intelligent life at around the present cosmic epoch, then the probability distribution for the emergence of intelligent life is expected to trace the spatial distribution of such planets. In other words, we expect to find ourselves in the type of environments where most such terrestrial planets are located. It is of course entirely possible that Earth could lie in the tail of this distribution, but this is an improbable outcome, and would violate the Copernican/mediocrity principle.
By convolving the mass distribution of TPs from Figure 5 with the distribution of morphological types as a function of galaxy mass from Kelvin et al. (2014) or Moffett et al. (2016a), we estimate that of TPs are locked up in spheroid-dominated galaxies (with in elliptical galaxies and early-type disks), and not in disk-dominated galaxies like the Milky Way (likely morphological type Sbc). Hence, if Earth had been randomly drawn from the cosmological population of TPs, the most likely outcome would have been for it not to be located in a Milky Way-type system, but in an elliptical. While many spheroid-dominated galaxies do contain a disk component, and vice versa, TPs in disks remain in minority even when the estimated stellar mass fractions in bona fide disks and spheroids (Moffett et al., 2016b; Thanjavur et al., 2016) are considered.
This, by itself, does not constitute any significant violation of the Copernican/mediocrity principle, since there is nothing conspicuously improbable111At any rate no more improbable than the offsets between the properties of the Sun and other similar stars discussed by Robles et al. (2008)) about the type of host galaxy in which we happen to find ourself (probability ). However, the fact that the raw distribution of TPs is not already heavily skewed towards disk galaxies results in a slight puzzle once other habitability constraints are factored in, as these seem to tip the scales even further in favour of ellipticals.
When considering the role of supernova sterilization on galactic habitability, Dayal et al. (2015) argue that massive ellipticals – which exhibit much less current star formation activity than disks – should exhibit much better conditions for life than actively star-forming galaxies like the Milky Way, and that this boosts the relative number of habitable planets per total stellar mass by 1-2 orders of magnitude in such galaxies at redshift . This implies that if our planet were randomly drawn from the cosmic distribution of habitable TPs at , we should with probability expect to find our self living in an elliptical galaxy.
But maybe there is more to the lottery than we have hitherto realized? If supernovae are less detrimental for life than commonly assumed, or if some other life-threatening mechanism turns out to be more efficient in ellipticals than in disks, this could restore the balance between habitable TPs in spheroids and disks. We note that there are several important differences between disks and spheroids that have so far received very little attention in the context of astrobiology – including the prevalence and properties of active galactic nuclei (but see Dayal et al. 2016 for a recent discussion on this), the propagation of cosmic rays and the fraction of stars in high-density regions. More detailed studies of the impact that mechanisms of this type can have on the habitability of planets may hopefully shed light on this matter.
4.3. The prospects of extragalactic SETI
While most SETI projects have so far focused on the Milky Way, the case for Extragalactic SETI remains compelling (e.g. Wright et al., 2014a; Zackrisson et al., 2015; Olson, 2015). If the probability for the emergence of intelligent life is sufficiently small, we could well be the only advanced civilization in the Milky Way. If so, our only chance of detecting intelligent life elsewhere in the Universe would be to extend the search radius. Extragalactic SETI would also seem the only way to gauge the prevalence of civilizations very high on the Kardashev (1964) scale (close to type III), since the Milky Way does not appear to host such a super-civilization.
If one adopts the admittedly anthropocentric view that intelligent life primarily develops on TPs, then our results have some bearing on the maximum distance to which it would make sense to push extragalactic SETI. Naively, one would expect that the probability for the emergence of an advanced civilization in an given cosmological volume is proportional to the number of TPs, modulo some correction for habitability and age effects.
By extending the redshift limit of such searches, one increases the cosmological volume probed, but since one is – due to the finite light travel time – at the same time probing earlier epochs in the history of the Universe, the number of TPs within the search radius does not increase indefinitely. As discussed in section 3.2 and shown in Figure 8b, the cumulative growth of the number of planets in the observable Universe slows down considerably beyond the peak of cosmic star formation ().
If one furthermore assumes that it typically takes several billion years for intelligent life to arise (some 4.5 Gyr in the case of humans – and please note that the Carter (1983) argument suggests that the typical time scale may be much longer than this), then only the part of the Universe becomes relevant. For TPs older than Earth, only a very small fraction () will be at . When factoring in habitability considerations (section 4.1), which will tend to further favour the low-density environment in the low-redshift Universe, and the escalating difficulties in detecting signatures (either signals or signs of astroengineering) of intelligent lifeforms at large distances, it seems that the prospects of extragalactic SETI should peak at redshifts below –2.
4.4. Comparison to previous studies
A small number of previous studies have attempted to assess the properties – both ages and absolute numbers – of terrestrial or Earth-like planets on cosmological scales.
A coarse, early estimate of the total number of “habitable planets” (without clearly defining what was meant by this) in the observable Universe was presented by Wesson (1990). This estimate, despite being based on a different cosmological model and an unevolving galaxy population – happens to lie within two orders of magnitude of our more modern estimate. By assuming habitable planets per galaxy and galaxies in the Universe, Wesson argues for habitable planets in the observable Universe. This is of the same order as our estimate on the total number of TPs (Table LABEL:statistics_highz) and two orders of magnitudes higher than our estimate for the number of habitable planets around FGK stars (section 4.1).
Lineweaver (2001) estimate the average TP in the Universe to be Gyr older than Earth. While consistent with our estimate within the errorbars, this is still 1 Gyr lower than our best estimate for TPs around FGK stars ( Gyr older than Earth; see Table LABEL:statistics_local). As far as we can tell, this discrepancy is largely driven by the much stronger metallicity dependence adopted by Lineweaver, which pushes the peak of TP formation forward in time by cutting off planet formation at subsolar metallicities (see Figure 1 for a comparison).
Behroozi & Peeples (2015) also present formation time statistics for Earth-like planets (assumed to make up a fixed fraction of TPs around FGK stars) both in Milky Way-mass galaxies and over cosmological volumes. This is not expected to exactly match the age statistics at that we present for FGK host TPs in Table LABEL:statistics_local and Figure 2, since the current age distribution is affected both by the formation and demise of planets (due to the exhausted lifetimes of their host stars). However, since lifetime effects are unimportant for M dwarfs, we can still compare our results for M dwarf TPs with theirs to shed light on potential differences in the underlying computational machinery. In this case, we find that the difference in median ages is Gyr. Behroozi & Peeples (2015) also report that there are Earth-like planets on the past light cone, which – when taking into account the scaling factor of between our mutual definitions of terrestrial and Earth-like – lies within a factor of a few from our estimate.
A simple and commonly used exercise to estimate the number of terrestrial/habitable/Earth-like planets in the observable Universe is to adopt a literature value for the corresponding number in the Milky Way, assign this number to the large number of galaxies detected in a deep, high-redshift survey like the Hubble Ultra Deep Field or the Hubble Extreme Deep Field, and correct the outcome for the limited sky coverage of the survey. This estimate not only neglects differences in both metallicity and mass between high-redshift galaxies and the Milky Way, but also the completeness of the imaging survey used. Due to the redshift evolution of the galaxy mass function (e.g. Torrey et al., 2015; Conselice et al., 2016) and the redshift evolution of gas-phase metallicities in star-forming galaxies (e.g. Zahid et al., 2013), average galaxy masses and metallicties are both lower at high redshifts. The modest difference in the number of planets per stellar mass in the Milky Way compared to the cosmic average (cmp. Table LABEL:statistics_local & LABEL:statistics_highz) implies that mass, according to our models, is more important in this context. If we were to adopt our estimate for the number of TPs around FGKM stars in the Milky Way (; see section 3.1), multiply by the number of galaxies in the Hubble Ultra Deep Field () and correct for the limited sky coverage of the latter (), we would arrive at – a factor of 20 higher than our estimate. The primary reason for this discrepancy is that the typical galaxy mass on our past light cone is lower than that of the Milky Way. In our simulations, the mean galaxy mass in the observable Universe (without any weighting by the probability of this object to host TPs) is . After applying this correction, this observational method results in an estimate that lies within a factor of of our result.
4.5. Uncertainties
A study such as this, which attempts to extrapolate results on the TP population from our local neighborhood to the whole Universe obviously carries substantial uncertainties. In the following, we attempt to identify the factors that dominate the error budget, and to attach reasonable error bars to our main results.
4.5.1 Galaxy formation
The results presented in this paper rely heavily on semi-analytic models of galaxy formation to trace the formation of TPs across space and time, but consistency checks using observational data can in some cases be carried out to test the robustness of our results. For instance, the mean age of TPs is primarily determined by the cosmic star formation history, and while the star formation history predicted by GALFORM is already in reasonable agreement with observations at , we can derive an alternative estimate by simply adopting the fitting function for the cosmic star formation history presented by Madau & Dickinson (2014) while keeping the metallicity distribution from GALFORM. The resulting average age differs from that presented in Table LABEL:statistics_local by Gyr and in Table LABEL:statistics_highz by Gyr. This approach also alters the total number of planets in the observable Universe by . A comparison between our best estimate on the number of planets in the observable Universe and that resulting from either the Behroozi & Peeples (2015) study, or from attaching the model-inferred number of planets per galaxy to galaxy counts in deep fields (section 4.4), suggests consistency to within a factor of a few. We therefore adopt a conservative 0.5 dex uncertainty on all estimates of planet numbers in Tables LABEL:statistics_local and LABEL:statistics_highz. We take the outcome of the minor age offsets seen when compared to the results of Behroozi & Peeples (2015) in Section 4.4 to reflect the likely age uncertainties stemming from systematic uncertainties in semi-analytic models and conservatively adopt a 0.05 dex error on all age estimates.
4.5.2 Cosmological parameters
Uncertainties on the parameters of the adopted cosmological model (within the framework of CDM cosmology) primarily translate into an uncertainty on the age of the Universe as a function of redshift and on the calculation of cosmological volumes in our analysis, thereby shifting the age scale for the cosmic population of TPs and the planet counts. However, variations in , and at the level motivated by the differences between the parameter sets favored by the recent WMAP-9 (Hinshaw et al., 2013) and Planck (Planck collaboration, 2015) surveys have a relatively small impact on our results, amounting to age uncertainties of Gyr and dex uncertainties in planet counts. A somewhat larger uncertainty comes from the fact that the galaxy catalogs originally generated by GALFORM (Baugh, 2005) were based on the , , km s-1 Mpc-1 version of the CDM cosmology, with (a somewhat higher power spectrum normalization than favored by the Planck collaboration 2015), whereas the Galacticus catalogs were originally based on , , km s-1 Mpc-1, . However, the shift in the age-redshift relation resulting from these slight inconsistencies remains at the Gyr level. Other effects on the predicted galaxy population are degenerate with the many assumptions going into the semi-analytic machinery (e.g. chemical yields, the progenitors mass limits for different kinds of supernovae), giving errorbars on planet counts that are likely to be captured by the 0.5 dex uncertainty we argue for in section 4.5.1.
4.5.3 Stellar initial mass function
The results presented in this paper are based on the assumption that the fraction of FGKM stars can be estimated using the Kroupa (2001) universal stellar initial mass function (IMF). To assess how this affects our estimates of the number of TPs, we have recomputed the planet formation history assuming the Chabrier (2003) instead of the Kroupa (2001) IMF when estimating the fraction of FGK and M stars forming within each age bin of the simulated galaxies. Both of these IMFs predict that of all stars in the 0.08–120 are born in the M dwarf mass regime (here 0.08–) whereas are born in the mass range of FGK stars (here 0.6–). Consequently, the predicted difference in TP statistics is very small – at the 0.02 dex level for number statistics and 0.01 dex for age estimates. However, the possibility that the stellar IMF may be a function of both time and environment has been raised (e.g. Chabrier et al., 2014), and this could introduce uncertainties significantly larger than the ones considered here.
4.5.4 Planet formation
The occurrence rates of TPs at low metallicities are admittedly highly uncertain, but as argued in Section 3.1, our results are remarkably robust to the reasonable adjustments of the planet occurrence recipe at the low metallicity end, simply because of the insignficant fraction of stars at such low metallicities. Adopting the minimum metallicity for the formation of low-mass planets (including the TPs discussed here) of [Fe/H] advocated by Hasegawa & Pudritz (2014) would affect the number estimates at the sub-percent level. By assuming a step function similar to that of Prantzos (2008) with a steep drop to zero probability for forming terrestrial planets at [Fe/H], we decrease the total number of terrestrial planets on our past light-cone by . On the other hand, in a scenario where terrestrial planet formation has no metallicity dependency at all and we let the occurrence of terrestrial planets be constant at the low-metallicity end, we obtain an increment of terrestrial planets by .
The possibility that TPs may reform in the wake of migrating Jupiters (e.g. Fogg & Nelson, 2009) may boost the fraction of TPs somewhat, but according to our estimates (Tables LABEL:statistics_local and LABEL:statistics_highz), this only affects the total population of TPs at the level for FGK hosts and at the –2 % level for M dwarf hosts.
When it comes to the fraction of TPs in the circumstellar habitable zone, the uncertainties become much larger, since the observational occurrence rate of such planets around FGK stars alone is uncertain by almost an order of magnitude (e.g. Lissauer et al., 2014), and the the habitability of both M-dwarfs and super-Earths are debatable.
4.5.5 Total error budget
Based on the considerations above, we adopt an error of dex on our age estimates (e.g. average TP age Gyr for and Gyr for our past light cone) and an error on the total number of TPs of 0.5 dex. This does not, however, include uncertainties related to potential variations of the shape/slope of the stellar initial mass function at the low-mass end with time and/or environment, since such variations remain poorly constrained and could have a very large impact on the number of M dwarfs.
5. Summary
Our model for cosmic planet formation indicates that:
-
•
The average age of TPs orbiting FGK stars in the local volume is Gyr, whereas the corresponding value for TPs orbiting M dwarfs is Gyr. The difference is primarily due to the limited lifetimes of FGK stars compared to the current age of the Universe. The average ages of TPs (around both FGK and M-type stars) in the whole observable Universe (on our past light cone) is Gyr. The lower age compared to the local volume stems from the lookback-time effect, in which distant regions of the Universe are seen at an earlier cosmic epochs.
-
•
While the median TP in the local Universe is sitting in a galaxy of mass comparable to that of the Milky Way, the median TP on our past light cone is sitting in a galaxy with mass a factor of lower.
-
•
The number of TPs per unit stellar mass at remains almost constant (to within ) for galaxies in the stellar mass range –. As a result, large satellite galaxies like the LMC are expected not to be depleted in TPs. Based on the observed mass-metallicity relation for dwarf galaxies and the recipe for metallicity-dependent TP formation adopted in this work, significant TP depletion is not expected to set in until , which is below the resolution limit of our simulations.
-
•
The total number of TPs in a Milky way-mass galaxy at is for TPs around FGK stars and for TPs around M dwarfs.
-
•
The numbers of TPs in the whole observable Universe are (FGK hosts) and (M dwarf hosts).
-
•
There are conservatively habitable TPs around FGK stars per unit total stellar population mass () and habitable TPs around FGK stars in the observable Universe
-
•
About of the TPs in the local Universe are orbiting stars at metallicities lower or higher than those for which such planets have so far been detected. The corresponding fraction for the whole observable Universe is estimated at
-
•
Our model suggests that the typical TP in the local Universe is not sitting in a disk-dominated system like the Milky Way, but in a spheroid-dominated galaxy – with about 1/2 of the local TP population in ellipticals. This leads to a mild violation of the Copernican/mediocrity principle once habitability considerations related to supernova sterilization (Dayal et al., 2015) are factored in. Since the Dayal et al. (2015) predicts much better conditions for life on planets in massive ellipticals compared to actively star-forming systems like the Milky Way, the distribution of habitable TPs would become biased in favour of ellipticals and make the Earth an outlier in the distribution of TP across the current galaxy population.
-
•
Only a small fraction () of the TPs on our past light cone are at redshifts , and when considering the subset of these planets older than Earth, this redshift limit drops to . Under the assumption that the emergence of intelligent life is tied to the formation of TPs, the prospects of extragalactic SETI efforts are therefore expected to peak at relatively low redshifts.
References
- Adibekyan et al. (2015) Adibekyan, V., Figueira, P., & Santos, N. C. 2015, arXiv:1509.02429
- Aird et al. (2012) Aird, J., et al. 2012, ApJ, 746, 90
- Alibert (2014) Alibert, Y. 2014, A&A 561, 41
- Annis (1999) Annis, J. 1999, JBIS, 52, 33
- Armitage & Rice (2008) Armitage, P. J., & Rice, W. K. M. 2008, In: A Decade of Extrasolar Planets around Normal Stars, Proceedings of the Space Telescope Science Institute Symposium, Edited by Mario Livio, Kailash Sahu and Jeff Valenti, Space Telescope Science Institute, Baltimore Series: Space Telescope Science Institute Symposium Series No. 19, p. 66 (astro-ph/0507492)
- Atri et al. (2013) Atri, D., Hariharan, B., Grießmeier, J.-M. 2013, Astrobiology, 13, 910
- Barreira & Avelino (2011) Barreira, A., Avelino, P.P. 2011 PhRvD 83, 3001
- Batalha (2014) Batalha, N. M. 2014, PNAS, 111, 12647
- Baugh (2006) Baugh, C. M., 2006, Reports on Progress in Physics, 69, 3101-3156 (astro-ph/0610031).
- Baugh (2005) Baugh, C. M., Lacey, C. G., Frenk, C. S., Granato, G. L., Silva, L., Bressan, A., Benson, A. J., Cole, S. 2005, MNRAS, 356, 1191
- Behroozi & Peeples (2015) Behroozi, P., Peeples, M. 2015, MNRAS, 454, 1811
- Benson (2012) Benson, A. J. 2012, New Astronomy 17, 175
- von Bloh et al. (2003) von Bloh, W., Franck, S., Bounama, C., Schellnhuber, H.-J. 2003, Origins of Life and Evolution of the Biosphere, v. 33, Issue 2, p. 219
- Bonfils et al. (2013) Bonfils, X., Delfosse, X., Udry, S., et al. 2013, A&A, 549, A109
- Bressan et al. (2012) Bressan, A., Marigo, P., Girardi, L., Salasnich, B., Dal Cero, C., Rubele, S., Nanni, A. 2012, MNRAS, 427, 127
- Buchhave et al. (2012) Buchhave, L. A., et al. 2012, Nature 486, 375
- Campante et al. (2015) Campante, T. L., et al. 2015, ApJ, 799, 170
- Carter (1983) Carter, J. 1983, Philosophical Transactions of the Royal Society of London. Series A, Mathematical and Physical Sciences, 310, 347
- Carigi et al. (2013) Carigi, L., Garcá-Rojas, J., Meneses-Goytia, S. 2013, RMxAA 49, 253
- Chabrier (2003) Chabrier, G. 2003, PASP 115, 763
- Chabrier et al. (2014) Chabrier, G., Hennebelle, P., Charlot, S. 2014, ApJ 796, 75
- Chen et al. (2014) Chen, Y., Girardi, L., Bressan, A., Marigo, P., Barbieri, M., Kong, X. 2014, MNRAS, 444, 2525
- Cirkovic (2004) Cirkovic, M. M., 2004, Astrobiology 4, 225
- Clarke (1981) Clarke, J. N. 1981, Icarus, 46, 94
- Conselice et al. (2016) Conselice, C. J., Wilkinson, A., Duncan, K., Mortlock, A. 2016, ApJ in press (arXiv:1607.03909)
- Dalrymple (2001) Dalrymple, G. B. 2001, Geological Society, London, Special Publications, 190, 205
- Dayal et al. (2015) Dayal, P., Cockell, C., Rice, K., Mazumdar, A. 2015, ApJ, 810, L2
- Dayal et al. (2016) Dayal, P., Ward, M., Cockell, C., arxiv1606.09224
- Dotter et al. (2007) Dotter, A., Chaboyer, B., Ferguson, J. W., Lee, H.-C., Worthey, G., Jevremovic, D., Baron, E. 2007, ApJ, 666, 403
- Dressing & Charbonneau (2013) Dressing, C. D., & Charbonneau, D. 2013, ApJ, 767, 95
- Dressing & Charbonneau (2015) Dressing, C. D., & Charbonneau, D. 2015, ApJ, 807, 45
- Egan & Lineweaver (2008) Egan, C. A., Lineweaver, C. H. 2008 PhRvD 78, 3528
- Ejzak et al. (2007) Ejzak, L. M., Melott, A. L., Medvedev, M. V., Thomas, B. C. 2007, ApJ, 654, 373
- Feng & Bailer-Jones (2014) Feng, F., Bailer-Jones, C. A. L. 2014, MNRAS, 442, 3653
- Feulner et al. (2005) Feulner, G., Gabasch, A., Salvato, M., Drory, N., Hopp, U., Bender, R. 2005, ApJ 633, L9
- Fischer & Valenti (2005) Fischer, D. A., & Valenti, J. 2005, ApJ, 622, 1102
- Fogg & Nelson (2009) Fogg, M. J., Nelson, R. P. 2009, A&A 498, 575
- Forgan et al. (2015) Forgan, D., Dayal, P., Cockell, C. Libeskind, N. 2015, arXiv1511.01786
- Gaidos & Mann (2014) Gaidos, E., & Mann, A. W. 2014, ApJ, 791, 54
- Garrett (2015) Garrett, M, 2015, A&A, 581, L5
- González et al. (2009) González, J. E., Lacey, C. G., Baugh, C. M., Frenk, C. S., Benson, A. J. 2009, MNRAS 397, 1254
- Gonzalez et al. (2001) Gonzalez, G. Brownlee, D., Ward, P. 2001, Icarus 152, 185
- Gonzalez (2005) Gonzalez, G. 2005, Origins of Life and Evolution of Biospheres, Volume 35, Issue 6, pp.555
- Gonzalez (2014) Gonzalez, G., 2014, Life, 4, 35 (arXiv1403.6761)
- Gowanlock et al. (2011) Gowanlock, M. G., Patton, D. R., McConnell, S. M. 2011, AsBio 11, 855
- Griffith et al. (2015) Griffith, R. L., Wright, J. T., Maldonado, J., Povich, M. S., Sigursson, S., Mullan, B. 2015, ApJS, 217, 25
- Guo et al. (2009) Guo J., Zhang F., Chen X. Han Z. 2009, Ap&SS, 323, 367
- Han et al. (2014) Han, E., Wang, S. X., Wright, J. T., Feng, Y. Katherina; Z. M., Fakhouri, O., Brown, J. I., Hancock, C. 2014, PASP, 126, 827
- Harris & Zaritsky (2009) Harris, J., Zaritsky, D., 2009, AJ, 138, 1243
- Hasegawa & Pudritz (2014) Hasegawa, Y., Pudritz, R. E. 2014, ApJ, 794, 25
- Hayashi (1981) Hayashi, C., Progress of Theoretical Physics Supplement, 70, 35
- Hinshaw et al. (2013) Hinshaw, G., Larson, D., Komatsu, E., Spergel, D. N 2013, ApJS, 208, 19
- Huang et al. (2016) Huang, C., Wu, Y., Triaud, A. H. M. J. 2016, ApJ, 825, 98
- Johnson et al. (2010) Johnson, J. A., Aller, K. M., Howard, A. W., & Crepp, J. R. 2010, PASP, 122, 905
- Johnson & Li (2010) Johnson, J. L., Li, H. 2013, MNRAS, 431, 972
- Kardashev (1964) Kardashev, N. S. 1964, Transmission of Information by Extraterrestrial Civilizations, Soviet Astronomy, 8, 217
- Kasting et al. (1993) Kasting, J. F., Whitmire, D. P., Reynolds, R. T. 1993, Icarus, 101, 108
- Kataoka et al. (2013) Kataoka, R., Ebisuzaki, T., Miyahara, H., Maruyama, S. 2013, New Astronomy 21, 50
- Kelvin et al. (2014) Kelvin, L.S., et al. 2014, MNRAS, 444, 1647
- Kite et al. (2011) Kite, E. S., Gaidos, E., Manga, M. 2011, ApJ, 743, 41
- Kirby et al. (2013) Kirby, E. N., Cohen, J. G., Guhathakurta, P., Cheng, L., Bullock, J. S., Gallazzi, A. 2013, ApJ, 779, 102
- Kopparapu (2013) Kopparapu, R. K. 2013, ApJL, 767, L8
- Kopparapu et al. (2013) Kopparapu, R. K., Ramirez, R., Kasting, J. F., et al. 2013, ApJ, 765, 131
- Kroupa (2001) Kroupa, P. 2001, MNRAS, 322, 231
- Larsen et al. (2011) Larsen, G., Nomura, Y., Roberts, H. L. L. 2011, PhysRevD. 84, 123512
- Lineweaver (2001) Lineweaver, C. H. 2001, Icarus, 151, 307
- Lineweaver et al. (2004) Lineweaver, C. H., Fenner, Y., Gibson, B. K. 2004, Science 303, 59L
- Lineweaver et al. (2007) Lineweaver, C. H., Egan, Chas A. 2007, ApJ 671, 853L
- Lissauer et al. (2014) Lissauer, J. J., Dawson, R. I., Tremaine, S. 2014, Nature, 513, 336
- Loeb et al. (2016) Loeb, A., Batista, R. A., Sloan, D. 2016, JCAP, 08, 040
- Luger & Barnes (2015) Luger, R. & Barnes, R. 2015, Astrobiology, 15, 119
- Madau & Dickinson (2014) Madau, P., & Dickinson, M. 2014, Annual Review of Astron and Astrophys, 52, 415
- McMillan (2011) McMillan, P. J. 2011, MNRAS, 414, 2446
- Mellot & Thomas (2011) Melott, A. L., Thomas, B. C. 2011, Astrobiology, 11, 343
- Moffett et al. (2016a) Moffett, A. J., et al. 2016a, MNRAS, 457, 1308
- Moffett et al. (2016b) Moffett, A. J., et al. 2016b, MNRAS, in press (arXiv:1608.05526)
- Morton et al. (2016) Morton, T. D., Bryson, S. T., Coughlin, J. L., Rowe, J. F., Ravichandran, G., Petigura, E. A., Haas, M. R., Batalha, N. M. 2016, ApJ, 822, 86
- Olson (2015) Olson, S. J. 2015, arXiv1507.05969
- Petigura et al. (2013) Petigura, E. A., Howard, A. W., & Marcy, G. W. 2013, PNAS, 110, 19273
- Piatti & Geisler (2013) Piatti, A. E., Geisler, D. 2013, AJ, 145, 17
- Piran & Jimenez (2014) Piran, T., Jimenez, R. 2014, PhRvL, 113, 1102
- Planck collaboration (2015) Planck Collaboration: Ade, P. A. R., et al., arXiv1502.01589
- Prantzos (2008) Prantzos, N. 2008, Space Science Reviews, 135, 313
- Ramirez & Kaltenegger (2014) Ramirez, R. M.; Kaltenegger, L. 2014, ApJ, 797, L25
- Rampino (2015) Rampino, M. R. 2015, MNRAS, 448, 1816
- Robles et al. (2008) Robles, J. A., Lineweaver, C. H., Grether, D., Flynn, C., Egan, C. A., Pracy, M. B., Holmberg, J., Gardner, E. 2008, ApJ, 684, 691
- Ruderman (1974) Ruderman, M. A. 1974, Science, 184, 1079
- Scalo (2007) Scalo, J., Kaltenegger, L., Segura, A. G., et al. 2007, Astrobiology, 7, 85
- Seager et al. (2013) Seager, S., Bains, W., & Hu, R. 2013, ApJ, 777, 95
- Segura et al. (2005) Segura, A., Kasting, J. F., Meadows, V., et al. 2005, Astrobiology, 5, 706
- Sengupta (2015) Sengupta, S. 2015, arXiv150107148
- Shibuya et al. (2015) Shibuya, T., Ouchi, M., Harikane, Y. 2015, ApJS, 219, 15
- Spitoni et al. (2014) Spitoni, E., Matteucci, F., Sozzetti, A. 2014 MNRAS 440, 2588
- Steffen et al. (2012) Steffen, J. H., et al. 2012, PNAS 109, 7982
- Sundin (2006) Sundin M. 2006, Int. J. Astrobiol. 5, 325
- Suthar & McKay (2012) Suthar F., McKay C.P. 2012, Int. J. Astrobiol. 11, 157
- Tang et al. (2014) Tang, J., Bressan, A., Rosenfield, P., Slemer, A., Marigo, P., Girardi, L., Bianchi, L. 2014, MNRAS, 445, 4287
- Tegmark & Boström (2005) Tegmark, M., Boström, N. 2005, Nature 438, 754
- Tian & Ida (2015) Tian, F., Ida, S. 2015, Nature Geoscience, 8, 177
- Thanjavur et al. (2016) Thanjavur, K., Simard, L., Bluck, A. F. L., Mendel, T. 2016, MNRAS, 459, 44
- Thomas et al. (2005) Thomas, B. C., et al. 2005, ApJ, 634, 509
- Torres et al. (2015) Torres, G., et al. 2015, ApJ, 800, 99
- Torrey et al. (2015) Torrey, P., et al. 2015, MNRAS, 454, 2770
- Tuomi et al. (2014) Tuomi, M., Jones, H. R. A., Barnes, J. R., Anglada-Escudé, G., & Jenkins, J. S. 2014, MNRAS, 441, 1545
- Vukotic & Cirkovic (2007) Vukotic, B., Cirkovic, M. M. 2007, SerAJ, 175, 45
- Winn & Fabrycky (2015) Winn, J. N., Fabrycky, D. C. 2015, ARAA, 53. 409
- Wesson (1990) Wesson, P. S. 1990, QJRAS 31, 161
- Wright et al. (2014a) Wright, J. T., Mullan, B., Sigursson, S., Povich, M. S. 2014a, ApJ, 792, 26
- Wright et al. (2014b) Wright, J. T., Griffith, R., Sigursson, S., Povich, M. S., Mullan, B. 2014b, ApJ, 792, 27
- Zackrisson et al. (2015) Zackrisson, E., Calissendorff, P., Asadi, S., Nyholm, A. 2015, ApJ, 810, 23
- Zahid et al. (2013) Zahid, H. Jabran, G., Margaret, J.; Kewley, L. J., Hwang, H. S., Fabricant, D. G., Kurtz, M. J. 2013, ApJ, 771, L19
- Zinnecker (2003) Zinnecker, H., 2003, Chances for Earth-Like Planets and Life Around Metal-Poor Stars. In: Bioastronomy 2002: Life Among the Stars, Proceedings of IAU Symposium 213. Eds. R. Norris, F. Stootman. San Francisco: Astronomical Society of the Pacific, 2003., p. 45 (astro-ph/0301080)