Neutronization During Carbon Simmering In Type Ia Supernova Progenitors
Abstract
When a Type Ia supernova (SN Ia) progenitor first ignites carbon in its core, it undergoes years of convective burning prior to the onset of thermonuclear runaway. This carbon simmering phase is important for setting the thermal profile and composition of the white dwarf. Using the MESA stellar evolution code, we follow this convective burning and examine the production of neutron-rich isotopes. The neutron content of the SN fuel has important consequences for the ensuing nucleosynthesis, and in particular, for the production of secondary Fe-peak nuclei like Mn and stable Ni. These elements have been observed in the X-ray spectra of SN remnants like Tycho, Kepler, and 3C 397, and their yields can provide valuable insights into the physics of SNe Ia and the properties of their progenitors. We find that weak reactions during simmering can at most generate a neutron excess of . This is lower than that found in previous studies that do not take the full density and temperature profile of the simmering region into account. Our results imply that the progenitor metallicity is the main contributor to the neutron excess in SN Ia fuel for . Alternatively, at lower metallicities, this neutron excess provides a floor that should be present in any centrally-ignited SN Ia scenario.
Subject headings:
convection – nuclear reactions, nucleosynthesis, abundances – methods: numerical – stars: evolution – supernovae: general – white dwarfs1. Introduction
Type Ia supernovae (SNe Ia) are the thermonuclear explosions of white dwarf (WD) stars (Maoz et al., 2014). They play a key role in galactic chemical enrichment through Fe-peak elements (Iwamoto et al., 1999), as cosmological probes to investigate dark energy (Riess et al., 1998; Perlmutter et al., 1999) and constrain CDM parameters (Betoule et al., 2014; Rest et al., 2014), and as sites of cosmic ray acceleration along with other SN types (Maoz et al., 2014). However, the exact nature of their progenitor systems remains mysterious. While it is clear that the exploding star must be a C/O WD in a binary system (Bloom et al., 2012), decades of intensive observational and theoretical work have failed to establish whether the binary companion is a non-degenerate star (the so-called single degenerate, or SD, scenario), another WD (double degenerate, DD – see Wang & Han 2012; Maoz et al. 2014 for recent reviews), or some combination of scenarios. Both cases result in the explosion of a relatively massive WD after one or potentially many more mass accretion episodes, but there are key differences between them. In the SD scenario, the accretion happens over relatively long timescales (yr, Hachisu et al., 1996; Han & Podsiadlowski, 2004) until the mass of the WD gets close to the Chandrasekhar limit ( , where is the mean number of electrons per baryon, Nomoto et al. 1984; Thielemann et al. 1986; Hachisu et al. 1996; Han & Podsiadlowski 2004; Sim et al. 2010). In the DD scenario, the explosion is the result of the violent interaction or merging of two WDs on a dynamical timescale (Iben & Tutukov, 1984), and the mass of the exploding object is not expected to be directly tied to (Sim et al., 2010; van Kerkwijk et al., 2010). Attempts to discriminate between SD and DD systems based on these differences have had varying degrees of success. On the one hand, it is known that WDs in the Milky Way merge at a rate comparable to SN Ia explosions (Badenes & Maoz, 2012), and statistical studies of the ejecta and 56Ni mass distribution of SN Ia indicate that a significant fraction of them are not near-Chandrasekhar events (Piro et al., 2014; Scalzo et al., 2014). On the other hand, the large amount of neutron-rich material found in solar abundances (Seitenzahl et al., 2013) and in some supernova remnants (SNRs) believed to be of Type Ia origin (Yamaguchi et al., 2015) seems to require burning at high densities, which indicates that at least a non-negligible fraction of SNe Ia explode close to .
Here we focus on the role that these neutron-rich isotopes play as probes of SN Ia explosion physics and progenitor evolution channels. In particular, we explore the effect of carbon simmering, a process wherein slowly accreting near- WDs develop a large convective core due to energy input from 12C fusion on timescales of yr before the onset of explosive burning (Woosley et al., 2004; Wunsch & Woosley, 2004; Piro & Chang, 2008). Previous studies (Chamulak et al., 2008; Piro & Bildsten, 2008) have pointed out that weak nuclear reactions during this phase enhance the level of neutronization in the fuel that will be later consumed in the different regimes of explosive nucleosynthesis. Here, we perform detailed models of slowly accreting WDs with the stellar evolution code MESA (Paxton et al., 2011, 2013, 2015), paying close attention to the impact of carbon simmering on the neutron excess.
This paper is organized as follows. In Section 2, we provide an overview of the main processes contributing to neutronization in SNe Ia, and the importance of understanding these processes in the context of observational probes of SN Ia explosion physics and the pre-SN evolution of their stellar progenitors. In Section 3, we outline our simulation scheme and describe our grid of MESA models for accreting WDs. In Section 4, we present the main results obtained from our model grid, and in Section 5, we summarize our conclusions and suggest directions for future studies.
2. Neutronization in Type Ia Supernovae
It is commonly accepted that WDs are the end product of most main-sequence stars (see Althaus et al., 2010, and references therein). A typical WD is a stellar object made up by a C/O core that encompasses most of its size, surrounded by an thin He envelope that, in turn, has a shallower H layer on top (Althaus et al., 2010). On the other hand, massive WDs () are believed to have O/Ne cores. Therefore, the composition of the core and the outer layers strongly depends on the characteristics of the initial star (Ritossa et al., 1996). The specific chemical composition of a WD determines its properties, which can vary after the AGB phase, along the cooling track, via important processes such as convection, phase transitions of the core and gravitational settling of the chemical elements (Althaus et al., 2010). For this abundance differentiation the main role is played by 22Ne (García-Berro et al., 2008; Althaus et al., 2010) because its neutron excess makes it sink towards the interior as the WD cools. The released gravitational energy by this process influences both the cooling times of WDs (Deloye & Bildsten, 2002) and the properties of SNe Ia (Bravo et al., 2011).
A critical parameter that controls the synthesis of neutron-rich isotopes in SN Ia explosions is the neutron excess
| (1) |
where , and are the neutron number, the nucleon number and charge of species with mass fraction , respectively. The starting value of in the SN Ia progenitor is set by its metallicity. This works as follows. Stars with zero-age main-sequence masses burn hydrogen through the CNO cycle (Thielemann et al., 1986). The slowest step is , which causes all the C, N and O present in the plasma to pile up at . Subsequently, during the hydrostatic He burning, converts to the neutron-enriched isotope 22Ne through the reaction chain .
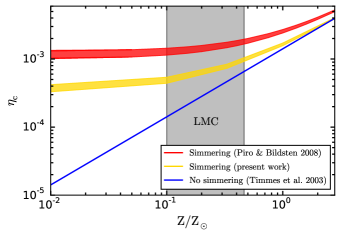
Because all CNO elements are converted to 22Ne during He burning, there is a linear relationship between the metallicity of a main sequence star and the neutron excess in the WD it eventually produces. Indeed, Timmes et al. (2003) found that this process relates the neutron excess of the WD and its progenitor metallicity via , where refers to the mass fraction of CNO elements, resulting in a value for solar metallicity material of . Gravitational settling of might enhance the relative neutronization in the core, but only at the expense of shallower material from the outer layers (Piro & Chang, 2008).
2.1. Neutron production during carbon simmering
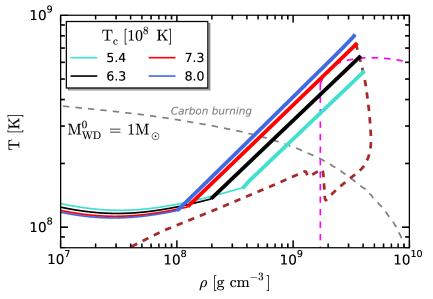
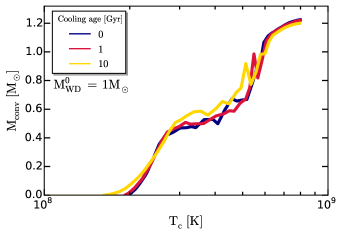
This relation between and can subsequently be modified by carbon simmering (Piro & Bildsten, 2008; Chamulak et al., 2008), and we summarize the main features of this process in Figure 1. Carbon ignition in the core of a WD takes places through the channels and with a branching ratio 0.56/0.44 for (Caughlan & Fowler, 1988) when the heat from these nuclear reactions surpasses the neutrino cooling. This burning regime (Nomoto et al., 1984), which starts at the gray, dashed line in Figure 1, marks the onset of simmering. The central conditions then trace out the rising dashed, brown line as the star heats and decreases slightly in density. At the same time, a convective region grows outward (Woosley et al., 2004; Wunsch & Woosley, 2004), shown at four different epochs with thick, solid lines. This convection encompasses during a period of yr before the final thermonuclear runaway at a central temperature of and the explosion as a Type Ia SN (Piro & Chang, 2008).
During carbon simmering, the protons produced by the reaction capture onto 12C, producing 13N. Subsequently, the electron-capture reactions N(, )13C (discussed in detail in Section 2.2 of Chamulak et al., 2008) and Na(, )23Ne (Chamulak et al., 2008; Piro & Bildsten, 2008) produce an enhancement in the neutronization of the core. These reactions consume the products of carbon fusion, so this increase in is directly related to the amount of carbon consumed prior to the explosion. This proceeds until sufficiently high temperatures or low densities are reached such that timescale for the 23Na electron captures becomes longer than the heating timescale. (The location where these timescales are equal is shown as a magenta, dashed line in Figure 1.) Additionally, as we find here, Ne carried into lower density regions of the convection zone can be converted back to 23Na by beta decay. These nuclear processes determine the final composition and properties of the ejected material (Iwamoto et al., 1999) and are crucial to obtain synthetic spectra (Brachwitz et al., 2000).
Using these basic arguments, Piro & Bildsten (2008) semi-analytically calculated the amount of carbon consumed during simmering to estimate that the increase in the neutron excess should be with an upper bound of 0.93 known as the “simmering limit”. Such a floor to the neutron excess is important to identify because it should be present in any SN Ia progenitor that went through a simmering phase, regardless of how low the progenitor’s metallicity is. Using a more detailed nuclear network, but only focusing on the central conditions of the convective zone, Chamulak et al. (2008) predicted a decrement in the mean number of electrons per baryon of , which corresponds to . Although both these works found similar levels of neutronization, they also made strong simplifications, and this is an important motivation for revisiting these results here.
2.2. Urca-process cooling
Weak reactions can also affect the thermal state of the WD. An Urca pair consists of two nuclei and that are connected by electron-capture and beta-decay . Below a threshold density the beta-decay reaction is favored and above it the electron-capture reaction is favored. Near this threshold density, both reactions occur at a significant rate, and since each produces a neutrino that then free-streams from the star, this has the net effect of cooling the plasma (Gamow & Schoenberg, 1941).
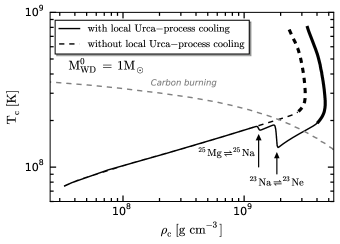
As the WD is compressed, its density increases above the threshold density of numerous Urca pairs. For the compositions and densities of our WD models, the two most important Urca pairs are 25Mg–25Na (with ) and 23Na–23Ne (with ) (Iben, 1978). These threshold densities are below the density at which carbon ignition occurs, and hence in the central parts of the WD this local Urca-process cooling occurs before the simmering phase begins. This effect was discussed in the context of accreting C/O cores by Paczyński (1973), but is often not included in progenitor models.111This effect was included in a recent study by Denissenkov et al. (2015), who used a large nuclear network that incorporated new weak rate tabulations from Toki et al. (2013). We make use of new capabilities of MESA that allow these processes to be easily included (Paxton et al., 2015). As shown in Figure 2, additional cooling shifts the point at which carbon ignition occurs to higher densities. The specific energy loss rate due to Urca-process neutrinos scales (Tsuruta & Cameron, 1970), so this effect is most pronounced in hotter WDs (those with short cooling ages).
After carbon ignition occurs and the simmering phase begins, the Urca process continues to operate as convection mixes material from regions where it has electron-captured into regions where it will beta-decay and vice-versa. This convective Urca process and its effects have been an object of considerable study (e.g., Paczyński, 1972; Bruenn, 1973; Shaviv & Regev, 1977; Barkat & Wheeler, 1990; Lesaffre et al., 2005). We allow for the operation of the convective Urca process in our MESA models, inasmuch as we incorporate appropriate weak rates and allow composition to mix throughout the convective zone. However, limitations imposed by the temporal and spatial averaging that enter into a formulation of 1D mixing-length theory do not allow us to self-consistently treat the effects of the Urca process on the convection itself. In some of our models, in particular those with the solar or super-solar metallicities and hence the highest abundances of 25Mg and 23Na, we observe that, when the convective zone first reaches the Urca shell, the former splits in two and remains split for the remainder of the calculation. It seems likely this behavior is a manifestation of these limitations, so when we report our results in Tables 4-6, we mark these models with the note “Convection zone splits during simmering”. The development of a model able to fully incorporate the interaction of convection and the Urca process is beyond the scope of this work and will likely require multi-dimensional hydrodynamics simulations (e.g., Stein & Wheeler, 2006). Given the existing uncertainties, Denissenkov et al. (2015) explored the possible effects of the convective Urca process in MESA models by employing a series of mixing assumptions, such as limiting the mass of the convective core to the mass coordinate of the 23Na–23Ne Urca shell. Future work could employ a similar approach to explore the potential effects of the convective Urca process on neutronization.
3. White Dwarf Models
Motivated by the discussion above, we next explore the impact of the neutron-rich isotopes at WD formation and during carbon simmering using MESA222http://mesa.sourceforge.net/index.html (Paxton et al., 2011, 2013, 2015). We create WDs with five different metallicities: 333Our intention was to create a 3 star. However, MESA presents several convergence problems for this high metallicity during the AGB phase and a 2.79 WD was created instead., where (Asplund et al., 2009). In each case, we start from 4.5 ZAMS-models by using the inlists from the suite case make_co_wd, which makes a protostar go through the MS until the AGB thermal pulses and then reveals its C/O core. These models are stopped when the total luminosity reaches . MESA presents convergence problems due to the unstable He shell burning on accreting WDs (Shen & Bildsten, 2009), so we artificially remove the H/He shallower envelope via a negative accretion rate. The resulting WDs have . Then, we rescale the initial masses of our WDs to 0.70, 0.85 and 1.00 without changing the chemical composition as a function of the Lagrangian mass coordinate.
To evaluate the effect of cooling times in the properties of WDs (Lesaffre et al., 2006; Althaus et al., 2010), we let our stars cool for 1 and 10 Gyr, ages that are consistent with the spread for the delay-time distribution (DTD) of SNe Ia (40 Myr–10 Gyr, Maoz et al., 2012, 2014). We do not account for residual heating by the external H/He envelope (Althaus et al., 2010), as this material has already been removed in our models. We also do not include the effects of diffusion, sedimentation, or crystallization, as the development of MESA’s treatment of these processes is ongoing. With these caveats in mind, we classify our WDs as “hot” (no cooling applied), “warm” (1 Gyr) and “cold” (10 Gyr).
We use these 45 WDs (five metallicities, three masses, and three cooling ages) as an input for our simmering MESA inlists, based on the suite case wd_ignite, which models the accretion in the Type Ia SNe SD channel by considering a C/O WD, a uniform, pure C/O accretion and a stopping condition such that the total luminosity from the nuclear reactions reaches . We use a nuclear network consisting of 48 isotopes, shown in Table 1, and the reactions linking them. This is the main difference between the present study and the one performed by Chen et al. (2014), who also examined the properties of accreting C/O WDs, but used a more limited network. We use a version of MESA based on release 7624, but modified to incorporate a rate for the N(, )13C reaction that is appropriate for the high density conditions of a WD interior. We motivate and describe our modifications in Appendix A.
| Isotope | Isotope | ||
|---|---|---|---|
| n | 1 | O | 14–18 |
| H | 1–2 | F | 17–19 |
| He | 3–4 | Ne | 18–24 |
| Li | 7 | Na | 21–25 |
| Be | 7 | Mg | 23–26 |
| Be | 9–10 | Al | 25–27 |
| B | 8 | Si | 27–28 |
| C | 12–13 | P | 30–31 |
| N | 13–15 | S | 31–32 |
For the accreted material, we consider uniform accretion with three different rates, , and , which yield accretion ages yr that agree with the literature (Hachisu et al., 1996; Han & Podsiadlowski, 2004). The chemical abundances of the accretion are set equal to the initial surface composition of each WD. This makes a total of 135 different models whose results are presented in Section 4.2. In order to achieve a higher spatial and temporal resolution during the Urca-process cooling and carbon simmering phases, we stop our accreting models when the WD mass reaches 1.3 , which corresponds to central densities below the Urca cooling densities discussed in Section 2.2. We then continue the models with controls that incorporate timestep limits based on the the variation of the central density and temperature. To confirm that our models are converged, we perform runs with increased temporal and spatial resolution. To corroborate that our results are insensitive to the treatment of the outer boundary of the central convection zone, we execute a run with overshooting. We verify that the quantities of interest are unchanged and refer the reader to Appendix B for more detailed information.
For the stopping condition of our inlists, we choose the one derived by Woosley et al. (2004), and broadly discussed in Chamulak et al. (2008), Piro & Bildsten (2008) and Piro & Chang (2008), which estimates that simmering should end when dynamical burning is triggered. This requires , i.e., . In turn, Piro & Bildsten (2008) argued that the final thermonuclear runaway should ensue when the heating time scale (where is the specific heat of the liquid ions) gets comparable to the dynamical time scale . Our conclusion is that, in general, when , so that does not hold. Figure 3 shows that simmering ends when the heating time scale approaches the convective time scale in the core of the WD (Piro & Chang, 2008). Here, , where is the convective velocity, the extent of the convective zone and the pressure scale height, which MESA calculates as .
4. Results
We next summarize the main results of our survey of simmering WD models. We begin in Section 4.1 by focusing on a fiducial model, a 1 , solar-metallicity WD with an accretion rate of . This is used to compare and contrast with our large grid of models in Section 4.2.
4.1. Fiducial model
In Figure 4, we show the evolution of the chemical profiles of 12C, 16O and 22Ne for our fiducial model during the different stages of the accretion process and through the simmering phase. We have labeled our curves at different time steps with the corresponding central temperature because of our stopping condition (Woosley et al., 2004). After carbon simmering, all the chemical profiles become homogeneous within the convective core (shown by the thick, fairly flat regions of the profiles). In turn, the accreted material eventually gets mixed into the core when the edge of this convective region reaches the initial mass of the star, which is why the carbon fraction increases at the center (carbon-rich material is mixed in rate higher than the consumption by carbon burning). The last profiles show a clear distinction between convection, which encompasses of the star by mass, and the outer, non-convective regions of the WD.
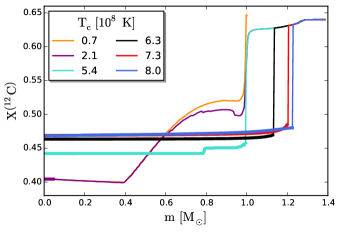
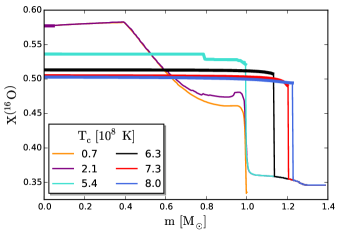
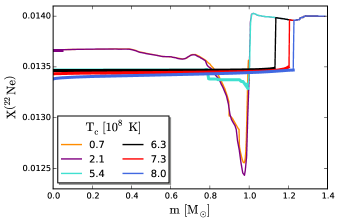
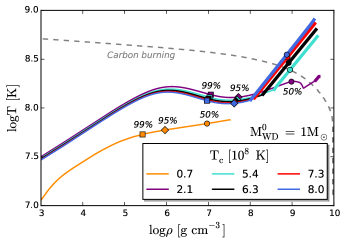
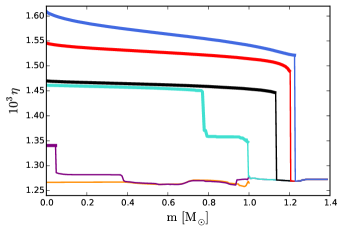
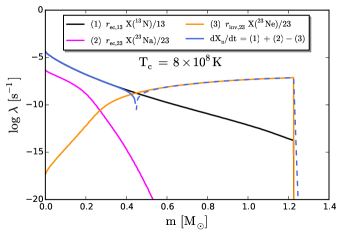
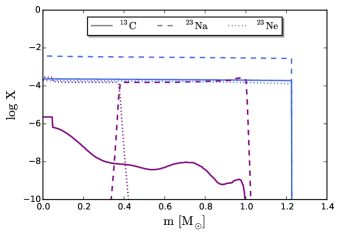
Figure 5 shows the profiles for the fiducial model. Initially, the hot, accreted material increases the effective temperature of the WD, while the interior of the star remains unchanged. After years, the temperature gradient steepens due to the energy lost via neutrinos (, Chen et al., 2014), so that a temperature inversion arises in the outer regions of the WD. This is critical because, for high accretion rates and cold WDs, the outer layers will be hotter than the core and off-center ignitions might take place (Chen et al., 2014). Finally, there is a change in the thermal structure of the star after the onset of simmering. Since convection is very efficient in the core given the high thermal conduction timescale yr, the convective profile is nearly an adiabat (Piro, 2008).
Figure 6 shows the neutron excess as a function of depth. This starts relatively constant with depth at a value of set by the progenitor metallicity. Then, as the simmering proceeds, a region with an increased neutron excess is seen to grow out in mass. At the onset of thermonuclear runaway, the central neutron excess is enhanced by an amount , so that is reduced by . This is smaller than the decrement within the convective zone at the center predicted by Chamulak et al. (2008), as well as than the maximum neutronization estimate calculated by Piro & Bildsten (2008). The reason for this discrepancy is that we have resolved the entire convective zone at each time and the range of densities encompassed by it. The electron captures are very sensitive to density, and thus the outer, lower-density regions do not experience the same level of electron captures and corresponding neutronization. This can be appreciated in Figures 7 and 8. As we find here, 23Ne can be converted back to 23Na when it is carried into the portion of the convection zone below the threshold density. In contrast, both Piro & Bildsten (2008) and Chamulak et al. (2008) focused on the central, highest-density conditions for deriving rates, and thus overestimated the amount of neutronization.
4.2. Cooled models and global results
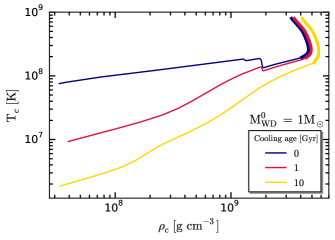
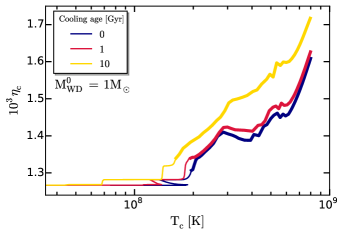
We next consider more broadly the results of the 135 models of our parameter survey. Figure 9 shows the behavior of the central density and temperature, the growth of the central neutron excess and the evolution of the convective core for the “hot” fiducial model discussed in Section 4.1, as well as the “warm” and “cold” versions of it. The effect of the Urca-process neutrino cooling disappears as the cooling age of the WD increases and the central temperature of the WD at the electron capture threshold density decreases. The local Urca-process cooling can also be appreciated in the evolutionary track of , where decreases while increases above its initial value (which is mainly determined by the original abundance of 22Ne, as discussed in Section 2.1). In addition, it decreases around when the outer edge of the convection zone crosses the 23Na–23Ne Urca shell.
The central neutron excess is slightly larger for the “cold” WD because the electron captures increase for higher densities. The central temperature at the onset of simmering is approximately the same for the three WDs, as well as the final extent of the convective core. At the onset of the thermal runaway, is the main relic of the cooling process, whereas accretion has “erased” the memory of the initial mass of the WD.
The remainder of our results are summarized in Figures 10, 11, 12, and 13, and in Tables 4, 5 and 6. Note that there are no fast accretors () in the case of the cooled WDs because they lead to off-center ignitions (Chen et al., 2014). In our tabulated results, we indicate these models with the note “Off-center carbon ignition”.
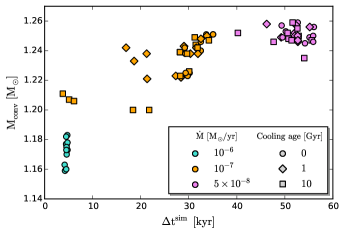
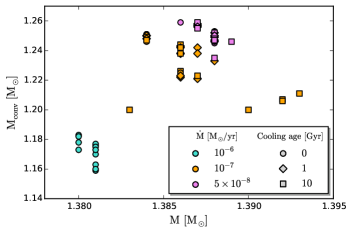
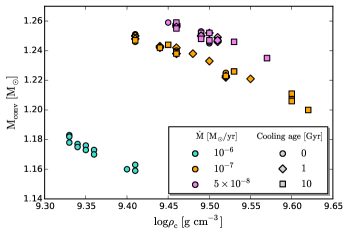
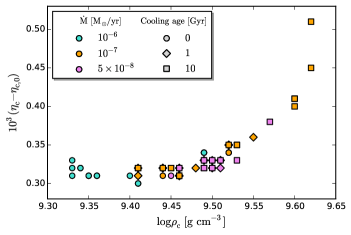
Some of the general trends are as follows. The final masses of the convective core (shown in Figures 10, 11, and 12) have relatively similar values , encompassing % of the final stars. This result agrees with the estimates of Piro & Chang (2008). The elapsed times during simmering are longer when the convective core is larger (see Figure 10) and are typically years. The only models with years are the fast accretors and the “cold” WDs with an initial mass of . Accretion times for these models are smaller and the shallower heat is unable to get to the core until a long time has elapsed. This, in turn, translates into higher ignition densities and more brief elapsed times during simmering. This is somewhat different from the estimate of years obtained by Piro & Chang (2008), which was based on the central conditions. This work does note that a realistic value for the simmering time depends on the size of the region heated (see Equation (8) of Piro & Chang, 2008, which describes this). The neutron excess increases with higher central densities (see Figure 13) as the electron captures get more favored.
Finally, our results concerning the impact of simmering on the neutronization are summarized in Figure 14, where we plot the expected neutron excess of a SN Ia progenitor versus its initial metallicity. The blue curve shows the linear relationship of derived by Timmes et al. (2003). The red region shows the range of maximum neutronization estimates, in the range of 0.93, from Piro & Bildsten (2008) and demonstrates the role played by the simmering floor. Namely, at sufficiently low metallicity, the neutron excess no longer reflects that of the progenitor but instead the amount of neutronization during simmering. Although we do find some small differences between models, Figure 13 demonstrates that the range of possible neutron excesses is relatively small, and thus we take the fiducial simmering limit to be 0.22 (yellow, shaded region in Figure 14), well below the value found by Piro & Bildsten (2008) for the reasons outlined in the discussions above.
5. Conclusions
We have performed the first study of carbon simmering in SNe Ia progenitors with numerical models that fully resolve the extent of the convective region and include a complete nuclear network with Urca processes. We find that the final mass of the convective zone in the accreting WD is in the range of . Our final values for the increase in the central neutron excess before the onset of thermonuclear runaway are fairly constant at . These values are lower than those found by previous studies (Piro & Bildsten, 2008; Chamulak et al., 2008), with the difference stemming from our ability to properly resolve the full density profile of the convection zone and determine accurately where and at what rate electron captures occur. As the convection zone grows, it eventually spans many density scale heights, with electron captures favored in regions above the threshold density and beta decays favored in regions below it. While the convective zone remains fully mixed, the overall neutronization is determined by the mass-weighted average of the reaction rates across the convection zone.
As summarized in Figure 14, the lower simmering floor that we obtain makes it more challenging to find an observational “smoking gun” for the presence of simmering in SN Ia progenitors with metallicities , typical of the thin disk of the Milky Way (Nordström et al., 2004). The strongest constraints on the degree of neutronization in individual SN Ia progenitors come from the analysis of the X-ray emission from Fe-peak nuclei (Mn, Cr, Fe, and Ni) in Galactic SNRs like Tycho, Kepler and 3C 397 (see Badenes et al., 2008; Park et al., 2013; Yamaguchi et al., 2015). In the dynamically young SNRs Tycho and Kepler, where the bulk of the shocked Fe-peak elements were synthesized in the explosive Si burning regime (Park et al., 2013), the Mn/Cr mass ratio is a clean tracer of progenitor neutronization. Badenes et al. (2008) and Park et al. (2013) found a high level of neutronization in these SNRs, which translates to super-solar progenitor metallicities and if the contribution from simmering is neglected. The constraints on the progenitor neutronization in SNR 3C 397 are more model-dependent because this is a dynamically older object, and the shocked ejecta has a large contribution from neutron-rich NSE material. Nevertheless, Yamaguchi et al. (2015) also found that, neglecting the contribution from simmering, Chandrasekhar-mass explosion models for this SNR require very high () progenitor metallicities. These high levels of neutronization in Galactic Type Ia SNRs seem to be in tension with our results, because simmering is unable to reconcile the observations with a population of progenitors that is typical of the thin disk of the Milky Way, which contains very few stars with . We hope to gain further insight on this apparent mismatch between models and observations by examining Type Ia SNRs in the LMC, which should have progenitor metallicities (Piatti & Geisler, 2013, see Figure 14), low enough to clearly determine whether their progenitors underwent a carbon simmering phase and constrain the resulting degree of neutronization.
In the future, our models could be used as an input for SNe cosmology and explosion studies, as done by Moriya et al. (2015) and Piro & Morozova (2015), who created models with MESA and then employed a different code (Morozova et al., 2015) to track the evolution of the supernova light curves. Using our models as inputs for explosive burning calculations would also be helpful for exploring the impact of the centrally neutron-enhanced core on the explosion and the resulting light curve (e.g. Bravo et al., 2010). For example, Townsley et al. (2009) and Jackson et al. (2010) studied the influence of 22Ne on the laminar flame speed, energy release, and nucleosynthesis during the SN explosion. The enhanced neutronization would have a similar impact, and although the influence of the 22Ne was found to be modest in these studies, we also predict spatial differences caused by the presence of the convection zone.
In addition, there are pieces of physics that could be added to our simmering models. As mentioned in Section 3, the gravitational settling of will be implemented in an upcoming MESA release. We expect to revisit these models with a more complete approach including this process, as well as an in-depth treatment of the chemical diffusion and rotation during convection. Piro & Chang (2008) and Piro (2008) initially explored these effects with a series of semi-analytic models, and it will be interesting to revisit them with a more realistic treatment. The properties of the convective zone and neutron excess we found here are fairly homogeneous over a wide range of parameters. Therefore, it will be useful to see if other effects can add more diversity.
Appendix A Modifications to MESA and key weak reactions
In this appendix, we describe our use and extension of MESA’s on-the-fly weak rates capabilities.444 We incorporate fixes that correct errors present in Paxton et al. (2015), as documented in the published erratum (Paxton et al. 2016 in prep.). An accurate treatment of the key weak reaction rates is necessary to resolve the effects of the Urca process and to include the effects of neutronization due to the electron-capture reactions during simmering. In order to illustrate their importance, Figure 15 shows the differences between our work and a MESA calculation which does not include these choices and changes.
A.1. Weak rates for , , and
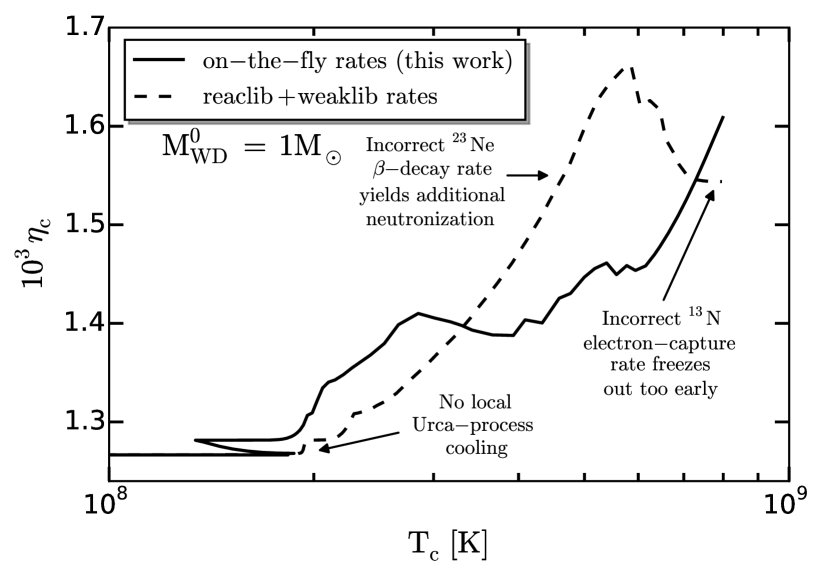
Coarse tabulations of weak rates can severely underestimate cooling by the Urca process (e.g., Toki et al., 2013; Paxton et al., 2015). To circumvent this limitation, we use MESA’s capability to calculate weak reaction rates on-the-fly. We use input nuclear data drawn from the MESA test suite problem 8.8M_urca, which includes Urca-process cooling by the 25Mg–25Na and 23Na–23Ne Urca pairs. This choice allows us to include the significant and often neglected effects of local Urca process cooling via these isotopes (see Section 2.2). As indicated in Figure 15, the decrease in temperature associated with the Urca-process cooling is not seen in a calculation that does not make use of the on-the-fly rates.
The Urca-process cooling leads to an increase in the maximum central density reached (see Figure 2). In some cases, this approaches or exceeds the threshold density for electron capture on 24Mg. Therefore, we include weak reactions involving 24Mg and its daughters using input nuclear data drawn from the MESA test suite problem wd_aic.
The Na(, )23Ne reaction plays a key role during the simmering phase (see Section 2.1). As the convection zone grows, it eventually spans many density scale heights, with electron captures favored in regions above the threshold density and beta decays favored in regions below it. While the convective zone remains fully mixed, the overall neutronization is determined by the mass-weighted average of the reaction rates across the convection zone. Interpolation in the coarse weaklib tables leads to a systematic underestimate of the 23Ne beta-decay rates. Figure 15 shows that a calculation using the on-the-fly rates exhibits less neutronization once the outer edge of the convection zone grows beyond the threshold density of 23Na.
A.2. Rate of electron capture on N
In an unmodified version of MESA r7624, the reaction linking 13N to 13C (r_n13_wk_c13) is drawn from JINA reaclib (Cyburt et al., 2010). This reaction rate includes only positron emission and does not include the electron-capture reaction N(,)13C. At the characteristic simmering densities , the electron capture rate is , a factor of more rapid than the positron emission rate. If the proper rate is not included, late in the simmering phase, 13N to 13C will freeze out. This is illustrated on the right in Figure 15, where the neutronization ceases to increase when MESA’s default r_n13_wk_c13 rate is used.
The on-the-fly reaction rate framework described in Paxton et al. (2015) is limited to transitions with , where is the energy difference (including rest mass) between the two states. The energy difference between the ground states of N and 13C is so, in order to incorporate this rate, we extend the on-the-fly weak rate implementation in MESA to include rates with . In the notation of Paxton et al. (2015), the rate for such a transition can be written as
| (A1) |
This integral can also be rewritten in terms of Fermi-Dirac integrals as in Schwab et al. (2015), and as such, the extension is straightforward. A patch demonstrating this implementation will be made available along with the inlists used in this work.
We include the effects of two electron-capture transitions, drawing nuclear energy levels from Ajzenberg-Selove (1991) and -values from the recent experimental results of Zegers et al. (2008). These values are shown in Table 2.
| 0.000 | 0.000 | 3.665 | ||
| 0.000 | 3.685 | 3.460 |
Appendix B Convergence of the models and overshooting
In this appendix, we address the numerical convergence of our models and the effects of overshooting. During the phase where the WD mass is in excess of , which includes both the local Urca-process cooling and simmering phases, the default spatial resolution of our models is specified by the control
mesh_delta_coeff = 1.0 .
The default temporal resolution of our models is specified by imposing a maximum allowed fractional change in the central density and temperature per timestep, via the controls
    delta_lgRho_cntr_hard_limit = 1d-3
    delta_lgT_cntr_hard_limit = 3d-3    .
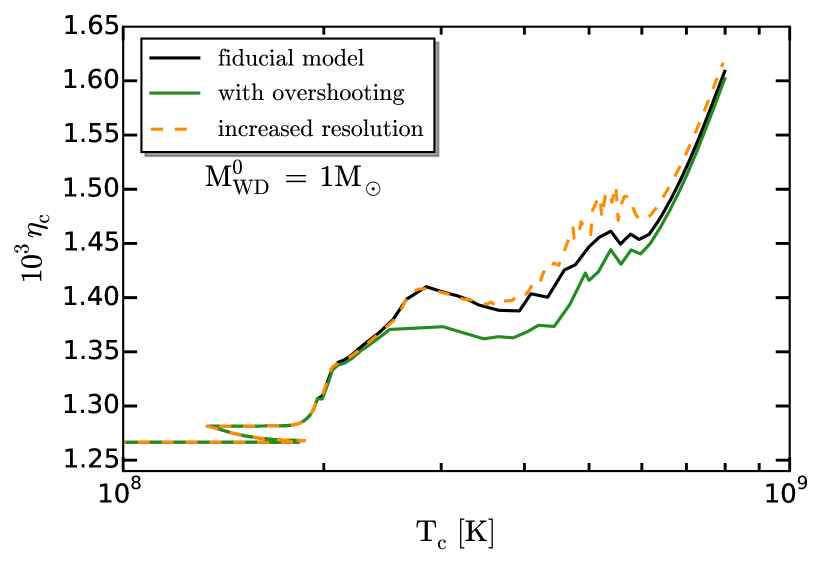
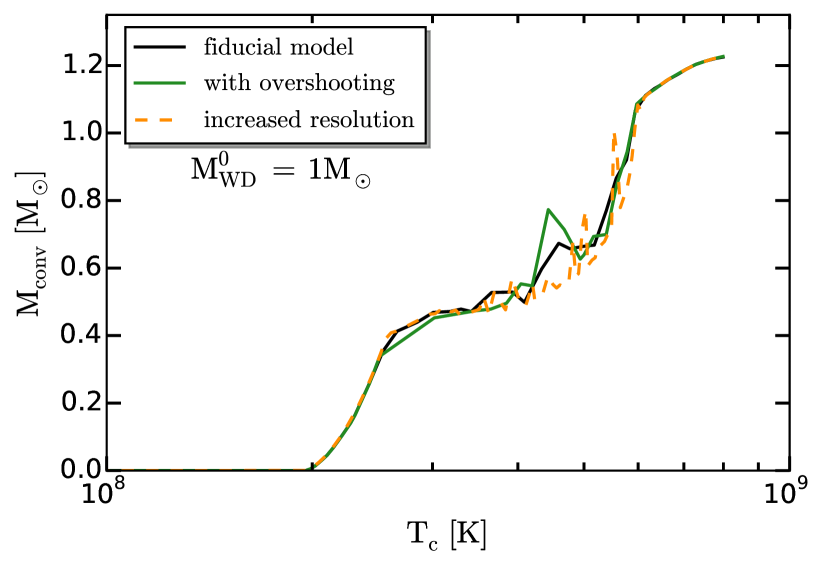
In order to confirm that our results are robust, we repeated our fiducial calculation, but used these controls to increase the spatial resolution by a factor of and the temporal resolution by a factor of . Figure 16 compares our fiducial model (Section 4.1) to this model with increased temporal and spatial resolution. The most conspicuous differences occur for between K and K. It is primarily during this phase that the convective Urca-process is occurring. As mentioned in Section 2.2, limitations imposed by the 1D mixing length theory of convection prevent fully consistent modeling of this phase. Thus, the fine details of the observed behavior during this phase are unlikely to be physically meaningful. As simmering nears its end and the heating timescale falls, the Urca-process reactions begin to freeze out. Once this occurs, the models return to a smooth evolution and to good agreement with each other.
The models shown in the body of the paper use the Schwarzschild convective criterion and no overshooting. Figure 16 also shows the results of our fiducial model with overshooting at the outer boundary of the central convective zone, added by means of the controls
    overshoot_f_above_burn_z_core = 0.010
    overshoot_f0_above_burn_z_core = 0.005  .
Again, the primary differences occur for between K and K, but the model returns to good agreement with the fiducial model by the end of simmering. In Table 3 we compare the values of the quantities of interest at the end of simmering (the same quantities compiled in Tables 4–6) for our fiducial model, the model with increased resolution, and the model including the effects of overshooting. We find sub-to-few per cent level agreement in all quantities of interest, giving us confidence that our results are robust.
| Description | # Zones | Time steps | |||||||||
|---|---|---|---|---|---|---|---|---|---|---|---|
| Fiducial model | 8.29 | 9.61 | 30.2 | 3.86 | 9.52 | 1.386 | 1.225 | 1.61 | 0.34 | 1149 | 1677 |
| With overshooting | 8.29 | 9.61 | 29.6 | 3.86 | 9.52 | 1.386 | 1.227 | 1.60 | 0.34 | 1144 | 1640 |
| Increased resolution | 8.29 | 9.61 | 31.0 | 3.86 | 9.53 | 1.386 | 1.225 | 1.62 | 0.35 | 7235 | 5343 |
References
- Ajzenberg-Selove (1991) Ajzenberg-Selove, F. 1991, NuPhA, 523, 1
- Althaus et al. (2010) Althaus, L. G., Córsico, A. H., Isern, J. & García-Berro, E. 2010, A&ARv, 18(4), 471
- Asplund et al. (2009) Asplund, M., Grevesse, N., Sauval, A. J. & Scott, P. 2009, ARA&A, 47, 481
- Badenes et al. (2008) Badenes, C., Bravo, E. & Hughes, J. P. 2008, ApJ, 680(1), L33-L36
- Badenes & Maoz (2012) Badenes, C. & Maoz, D. 2012, ApJ, 749:L11
- Barkat & Wheeler (1990) Barkat, Z. & Wheeler, J. C. 1990, ApJ, 355, 602
- Betoule et al. (2014) Betoule, M., Kessler, R., Guy, J., et al. 2014, AAP, 568, A22
- Bloom et al. (2012) Bloom, J. S., Kasen, D., Shen, K. J., et al. 2012, ApJ, 744(2), L17
- Brachwitz et al. (2000) Brachwitz, F., Dean, D. J., Hix, W. R., et al. 2000, ApJ, 536, 934
- Bravo et al. (2010) Bravo, E., Domínguez, I., Badenes, C., et al. 2010, ApJL, 711:L66
- Bravo et al. (2011) Bravo, E., Althaus, L. G., García-Berro, E. & Domínguez, I. 2011, A&A, 526, A26
- Bruenn (1973) Bruenn, S. W. 1973, ApJ, 183, L125
- Caughlan & Fowler (1988) Caughlan, G. R. & Fowler, W. A. 1988, At. Data Nucl. Data Tables, 40, 283
- Chamulak et al. (2008) Chamulak, D. A., Brown, E. F., Timmes, F. X. & Dupczack, K. 2008, ApJ, 677(1), 160
- Chen et al. (2014) Chen, X., Han, Z. & Meng, X. 2014, MNRAS, 438, 3358
- Cyburt et al. (2010) Cyburt, R. H., Amthor, A. M., Ferguson, R., et al. 2010, ApJS, 189, 240
- Deloye & Bildsten (2002) Deloye, C. J. & Bildsten, L. 2002, ApJ, 580, 1077
- Denissenkov et al. (2015) Denissenkov, P. A., Truran, J. W., Herwig, F., et al. 2015, MNRAS, 447, 2696
- Gamow & Schoenberg (1941) Gamow, G. & Schoenberg, M. 1941, Phys. Rev. 59, 539
- García-Berro et al. (2008) García-Berro, E., Althaus, L. G., Córsico, A. H. & Isern, J. 2008, ApJ, 677, 473
- Hachisu et al. (1996) Hachisu, I., Kato, M. & Nomoto, K. 1996, ApJ, 470(2), L97-L100
- Han & Podsiadlowski (2004) Han, Z. & Podsiadlowski, P. 2004, MNRAS, 350, 1301
- Iben (1978) Iben, I. 1978, ApJ, 219, 213
- Iben & Tutukov (1984) Iben, I. & Tutukov, A. V. 1984, ApJS, 54, 335
- Iwamoto et al. (1999) Iwamoto, K., Brachwitz, F., Nomoto, K., et al. 1999, ApJS, 125, 439
- Jackson et al. (2010) Jackson, A. P., Calder, A. C., Townsley, D. M., et al. 2010, ApJ, 720, 99
- Lesaffre et al. (2005) Lesaffre, P., Podsiadlowski, P. & Martin, C. A. 2005, MNRAS, 356, 131
- Lesaffre et al. (2006) Lesaffre, P., Han, Z., Tout, C. A., et al. 2006, MNRAS, 368, 187
- Maoz et al. (2012) Maoz, D., Mannucci, F. & Brandt, T. D. 2012, MNRAS, 426, 3282
- Maoz et al. (2014) Maoz, D., Mannucci, F. & Nelemans, G. 2014, ARAA, 52, 107
- Moriya et al. (2015) Moriya, T. J., Pruzhinskaya, M. V., Ergon, M., et al. 2016, MNRAS, 455, 423
- Morozova et al. (2015) Morozova, V., Piro, A. L., Renzo, M., et al. 2015, ApJ, 814, 63
- Nomoto et al. (1984) Nomoto, K., Thielemann, F.-K. & Yokoi, K. 1984, ApJ, 286, 644
- Nordström et al. (2004) Nordström, B., Mayor, M., Andersen, J., et al. 2004, A&A, 418, 989
- Paczyński (1972) Paczyński, B. 1972, Ap. Lett., 11, 53
- Paczyński (1973) Paczyński, B. 1973, Acta Astr., 23, 1
- Park et al. (2013) Park, S., Badenes, C., Mori, K., et al. 2013, ApJL, 767, L10
- Paxton et al. (2011) Paxton, B., Bildsten, L., Dotter, A., et al. 2011, ApJS, 192, 3
- Paxton et al. (2013) Paxton, B., Cantiello, M., Arras, P., et al. 2013, ApJS, 208, 1
- Paxton et al. (2015) Paxton, B., Marchant, P., Schwab, J., et al. 2015, ApJS, 220, 15
- Perlmutter et al. (1999) Perlmutter, S., Aldering, G., Goldhaber, G., et al. 1999, ApJ, 517, 565
- Piatti & Geisler (2013) Piatti, A. E. & Geisler, D. 2013, ApJ, 145, 17
- Piro (2008) Piro, A. L. 2008, ApJ, 679, 616
- Piro & Bildsten (2008) Piro, A. L. & Bildsten, L. 2008, ApJ, 673, 1009
- Piro & Chang (2008) Piro, A. L. & Chang, P. 2008, ApJ, 678, 1158
- Piro et al. (2014) Piro, A. L., Thompson, T. A. & Kochanek, C. S. 2014, MNRAS, 438(4), 3456
- Piro & Morozova (2015) Piro, A. L. & Morozova, V. S. 2015, arXiv: 1512.03442, submitted to ApJ
- Rest et al. (2014) Rest, A., Scolnic, D., Foley, R. J., et al. 2014, ApJ, 795, 44
- Riess et al. (1998) Riess, A. G., Filippenko, A. V., Challis, P., et al. 1998, ApJ, 116, 1009
- Ritossa et al. (1996) Ritossa, C., García-Berro, E. & Iben, I. 1996, ApJ, 460, 489
- Scalzo et al. (2014) Scalzo, R. A., Ruiter, A. J. & Sim, S. A. 2014, MNRAS, 445(3), 2535
- Schwab et al. (2015) Schwab, J., Quataert, E. & Bildsten, L. 2015, MNRAS, 453, 1910
- Seitenzahl et al. (2013) Seitenzahl, I. R., Cescutti, G., Röpke, F. K., Ruiter, A. J., & Pakmor, R. 2013, A&A, 559, L5
- Shaviv & Regev (1977) Shaviv, G. & Regev, O. 1977, A&A, 54, 581
- Shen & Bildsten (2009) Shen, K. J. & Bildsten, L. 2009, ApJ, 699, 1365
- Sim et al. (2010) Sim, S. A., Röpke, F. K., Hillebrandt, W., et al. 2010, ApJ, 714(1), L52
- Stein & Wheeler (2006) Stein, J. & Wheeler, J. C. 2006, ApJ, 643, 1190
- Thielemann et al. (1986) Thielemann, F. K., Nomoto, K. & Yokoi, K. 1986, A&A, 158, 17
- Timmes et al. (2003) Timmes, F. X., Brown, E. F. & Truran, J. W. 2003, ApJ, 590(2) L83-L86
- Toki et al. (2013) Toki, H., Suzuki, T., Nomoto, K., et al. 2013, Phys. Rev. C, 88, 1
- Townsley et al. (2009) Townsley, D. M., Jackson, A. P., Calder, A. C., et al. 2009, ApJ, 701, 1582
- Tsuruta & Cameron (1970) Tsuruta, S. & Cameron, A. G. W. 1970, Ap&SS, 7, 374
- van Kerkwijk et al. (2010) van Kerkwijk, M. H., Chang, P. & Justham, S. 2010, ApJ, 722(2) L157
- Wang & Han (2012) Wang, B. & Han, Z. 2012, New Astr. Rev., 56(4), 122
- Woosley et al. (2004) Woosley, S. E., Wunsch, S. & Kuhlen, M. 2004, ApJ, 607(2), 921
- Wunsch & Woosley (2004) Wunsch, S. & Woosley, S. E. 2004, ApJ, 616(2), 1102
- Yamaguchi et al. (2015) Yamaguchi, H., Badenes, C., Foster, A., et al. 2015, ApJ, 801:L31
- Zegers et al. (2008) Zegers, R. G. T., Brown, E. F., Akimune, H., et al. 2008, arXiv: 0710.2944
[ 0.01 0.7 8.43 9.38 4.76 0.680 9.33 1.380 1.178 0.34 0.33 0.01 0.85 8.43 9.38 4.49 0.529 9.33 1.380 1.182 0.34 0.32 0.01 1.0 8.43 9.38 4.72 0.379 9.33 1.380 1.183 0.33 0.31 0.01 0.7 8.36 9.50 32.5 6.84 9.41 1.384 1.246 0.33 0.32 0.01 0.85 8.35 9.49 35.1 5.34 9.41 1.384 1.251 0.33 0.32 0.01 1.0 8.36 9.50 33.6 3.84 9.41 1.384 1.251 0.33 0.31 0.01 0.7 8.32 9.56 56.0 13.7 9.46 1.387 1.256 0.34 0.32 0.01 0.85 8.33 9.56 49.3 10.7 9.46 1.387 1.257 0.33 0.32 0.01 1.0 8.32 9.56 52.7 7.73 9.45 1.386 1.259 0.33 0.31 0.10 0.7 8.42 9.39 4.56 0.681 9.34 1.381 1.175 0.45 0.32 0.10 0.85 8.42 9.39 4.47 0.531 9.34 1.381 1.177 0.45 0.32 0.10 1.0 8.42 9.39 4.56 0.380 9.35 1.381 1.176 0.44 0.31 0.10 0.7 8.34 9.54 29.2 6.86 9.44 1.386 1.242 0.45 0.32 0.10 0.85 8.34 9.54 29.2 5.35 9.44 1.386 1.242 0.45 0.32 0.10 1.0 8.33 9.53 31.5 3.85 9.44 1.386 1.242 0.44 0.31 0.10 0.7 8.30 9.60 49.5 13.8 9.49 1.388 1.249 0.46 0.33 0.10 0.85 8.30 9.59 55.9 10.8 9.49 1.388 1.250 0.46 0.33 0.10 1.0 8.30 9.60 50.2 7.75 9.49 1.388 1.253 0.46 0.33 0.33 0.7 8.41 9.40 4.53 0.681 9.35 1.381 1.173 0.73 0.31 0.33 0.85 8.41 9.40 4.59 0.531 9.36 1.381 1.170 0.73 0.31 0.33 1.0 8.41 9.40 4.77 0.380 9.36 1.380 1.173 0.73 0.31 0.33 0.7 8.33 9.55 29.3 6.86 9.46 1.386 1.238 0.73 0.31 0.33 0.85 8.32 9.55 32.5 5.36 9.46 1.386 1.240 0.73 0.31 0.33 1.0 8.32 9.55 31.8 3.85 9.46 1.386 1.242 0.73 0.31 0.33 0.7 8.29 9.61 55.9 13.8 9.50 1.388 1.246 0.74 0.32 0.33 0.85 8.29 9.61 54.2 10.8 9.50 1.388 1.245 0.75 0.32 0.33 1.0 8.29 9.61 55.1 7.75 9.51 1.388 1.249 0.74 0.32 1.00 0.7 8.39 9.45 4.50 0.681 9.40 1.381 1.160 1.58 0.31 1.00 0.85 8.40 9.46 4.24 0.531 9.41 1.381 1.159 1.57 0.30 1.00 1.0 8.40 9.46 4.17 0.381 9.41 1.381 1.163 1.57 0.30 1.00 0.7 8.29 9.61 29.4 6.86 9.52 1.386 1.225 1.61 0.35 1.00 0.85 8.29 9.61 29.8 5.36 9.52 1.386 1.223 1.61 0.34 1.00 1.0 8.29 9.61 30.2 3.86 9.52 1.386 1.225 1.61 0.34 1.00 0.7 Convection zone splits during simmering 1.00 0.85 Convection zone splits during simmering 1.00 1.0 Convection zone splits during simmering 2.79 0.7 8.37 9.55 3.33 0.679 9.49 1.379 1.131 3.86 0.34 2.79 0.85 8.37 9.55 3.64 0.529 9.49 1.379 1.136 3.86 0.34 2.79 1.0 8.37 9.55 3.62 0.378 9.49 1.378 1.136 3.86 0.34 2.79 0.7 Convection zone splits during simmering 2.79 0.85 Convection zone splits during simmering 2.79 1.0 Convection zone splits during simmering 2.79 0.7 Convection zone splits during simmering 2.79 0.85 Convection zone splits during simmering 2.79 1.0 Convection zone splits during simmering
[ 0.01 0.7 Off-center carbon ignition 0.01 0.85 Off-center carbon ignition 0.01 1.0 Off-center carbon ignition 0.01 0.7 8.36 9.50 32.5 6.84 9.41 1.384 1.248 0.33 0.32 0.01 0.85 8.36 9.50 33.8 5.34 9.41 1.384 1.250 0.33 0.31 0.01 1.0 8.35 9.57 17.0 3.87 9.46 1.387 1.242 0.33 0.31 0.01 0.7 8.32 9.56 55.2 13.7 9.46 1.387 1.256 0.34 0.32 0.01 0.85 8.32 9.56 52.4 10.7 9.46 1.387 1.257 0.33 0.32 0.01 1.0 8.32 9.57 46.2 7.72 9.46 1.387 1.258 0.33 0.31 0.10 0.7 Off-center carbon ignition 0.10 0.85 Off-center carbon ignition 0.10 1.0 Off-center carbon ignition 0.10 0.7 8.33 9.53 31.6 6.85 9.44 1.386 1.242 0.45 0.32 0.10 0.85 8.34 9.54 29.0 5.36 9.44 1.386 1.243 0.45 0.32 0.10 1.0 8.32 9.58 21.2 3.87 9.48 1.387 1.238 0.45 0.32 0.10 0.7 8.30 9.59 52.7 13.8 9.49 1.388 1.250 0.46 0.33 0.10 0.85 8.30 9.59 52.1 10.8 9.49 1.388 1.250 0.46 0.33 0.10 1.0 8.29 9.60 52.1 7.76 9.50 1.388 1.252 0.46 0.33 0.33 0.7 Off-center carbon ignition 0.33 0.85 Off-center carbon ignition 0.33 1.0 Off-center carbon ignition 0.33 0.7 8.33 9.55 30.3 6.86 9.46 1.386 1.238 0.73 0.31 0.33 0.85 8.32 9.55 31.9 5.35 9.46 1.386 1.238 0.73 0.31 0.33 1.0 8.32 9.61 18.6 3.87 9.50 1.388 1.233 0.74 0.32 0.33 0.7 8.29 9.61 52.7 13.8 9.51 1.388 1.247 0.75 0.32 0.33 0.85 8.29 9.61 49.2 10.8 9.51 1.388 1.249 0.75 0.33 0.33 1.0 8.28 9.61 52.7 7.76 9.51 1.388 1.246 0.75 0.33 1.00 0.7 Off-center carbon ignition 1.00 0.85 Off-center carbon ignition 1.00 1.0 Off-center carbon ignition 1.00 0.7 8.30 9.62 27.3 6.86 9.52 1.386 1.223 1.62 0.35 1.00 0.85 8.29 9.62 28.4 5.36 9.52 1.386 1.222 1.61 0.35 1.00 1.0 8.29 9.65 21.3 3.87 9.55 1.387 1.221 1.63 0.36 1.00 0.7 Convection zone splits during simmering 1.00 0.85 Convection zone splits during simmering 1.00 1.0 Convection zone splits during simmering 2.79 0.7 Off-center carbon ignition 2.79 0.85 Off-center carbon ignition 2.79 1.0 Off-center carbon ignition 2.79 0.7 Convection zone splits during simmering 2.79 0.85 Convection zone splits during simmering 2.79 1.0 Convection zone splits during simmering 2.79 0.7 Convection zone splits during simmering 2.79 0.85 Convection zone splits during simmering 2.79 1.0 Convection zone splits during simmering
[ 0.01 0.7 Off-center carbon ignition 0.01 0.85 Off-center carbon ignition 0.01 1.0 Off-center carbon ignition 0.01 0.7 8.36 9.50 34.2 6.84 9.41 1.384 1.247 0.33 0.32 0.01 0.85 8.35 9.51 31.2 5.34 9.41 1.384 1.249 0.33 0.32 0.01 1.0 8.31 9.73 3.79 3.91 9.60 1.393 1.211 0.42 0.40 0.01 0.7 8.32 9.56 52.6 13.7 9.46 1.387 1.255 0.34 0.32 0.01 0.85 8.33 9.56 51.6 10.7 9.46 1.387 1.259 0.33 0.32 0.01 1.0 8.31 9.60 40.2 7.76 9.49 1.388 1.252 0.33 0.32 0.10 0.7 Off-center carbon ignition 0.10 0.85 Off-center carbon ignition 0.10 1.0 Off-center carbon ignition 0.10 0.7 8.33 9.53 31.8 6.83 9.44 1.386 1.242 0.45 0.32 0.10 0.85 8.33 9.54 31.4 5.36 9.45 1.386 1.244 0.45 0.32 0.10 1.0 8.29 9.72 5.10 3.92 9.60 1.392 1.207 0.54 0.41 0.10 0.7 8.30 9.59 50.8 13.8 9.49 1.388 1.248 0.46 0.33 0.10 0.85 8.30 9.59 52.9 10.8 9.49 1.388 1.250 0.45 0.32 0.10 1.0 8.30 9.60 50.6 7.70 9.50 1.388 1.252 0.46 0.33 0.33 0.7 Off-center carbon ignition 0.33 0.85 Off-center carbon ignition 0.33 1.0 Off-center carbon ignition 0.33 0.7 8.33 9.55 29.6 6.86 9.46 1.386 1.238 0.73 0.31 0.33 0.85 8.33 9.56 28.2 5.36 9.46 1.386 1.239 0.73 0.31 0.33 1.0 8.28 9.73 6.12 3.92 9.60 1.392 1.206 0.84 0.41 0.33 0.7 8.29 9.61 51.4 13.8 9.50 1.388 1.247 0.75 0.32 0.33 0.85 8.29 9.61 55.6 10.7 9.51 1.388 1.247 0.75 0.33 0.33 1.0 8.27 9.63 47.7 7.77 9.53 1.389 1.246 0.76 0.33 1.00 0.7 Off-center carbon ignition 1.00 0.85 Off-center carbon ignition 1.00 1.0 Off-center carbon ignition 1.00 0.7 8.29 9.62 28.2 6.86 9.52 1.387 1.223 1.62 0.35 1.00 0.85 8.29 9.61 30.1 5.36 9.53 1.386 1.226 1.62 0.35 1.00 1.0 8.21 9.72 18.4 3.89 9.62 1.390 1.200 1.72 0.45 1.00 0.7 Convection zone splits during simmering 1.00 0.85 Convection zone splits during simmering 1.00 1.0 8.25 9.67 54.0 7.76 9.57 1.388 1.235 1.64 0.38 2.79 0.7 Off-center carbon ignition 2.79 0.85 Off-center carbon ignition 2.79 1.0 Off-center carbon ignition 2.79 0.7 Convection zone splits during simmering 2.79 0.85 Convection zone splits during simmering 2.79 1.0 8.16 9.72 21.8 3.83 9.62 1.383 1.200 4.03 0.51 2.79 0.7 Convection zone splits during simmering 2.79 0.85 Convection zone splits during simmering 2.79 1.0 Convection zone splits during simmering