Unconventional high-energy-state contribution to the Cooper pairing in under-doped copper-oxide superconductor HgBa2Ca2Cu3O8+δ
Abstract
We study the temperature-dependent electronic Raman response of a slightly under-doped single crystal HgBa2Ca2Cu3O8+δ with a superconducting critical temperature =122 K. Our main finding is that the superconducting pair-breaking peak is associated with a dip on its higher-energy side, disappearing together at . This result hints at an unconventional pairing mechanism, whereas spectral weight lost in the dip is transferred to the pair-breaking peak at lower energies. This conclusion is supported by cellular dynamical mean-field theory on the Hubbard model, which is able to reproduce all the main features of the Raman response and explain the peak-dip behavior in terms of a nontrivial relationship between the superconducting and the pseudo gaps.
pacs:
74.72.Gh,74.25.nd,74.20.Mn,74.72.KfConventional superconductors are well understood within the Bardeen-Cooper-Schrieffer (BCS) theory Bardeen et al. (1957): below a critical transition temperature , electrons at a characteristic energy (the Fermi energy) bind into Cooper pairs by an effective attractive interaction mediated by lattice vibrations (phonons) Schrieffer et al. (1963). The Bose condensate of pairs displays then zero resistance to electrical conduction and a gap opens in spectroscopic observables by a transfer of spectral weight from the Fermi level to higher energies. The BCS pairing mechanism, however, has not been able to account for the high observed in copper-oxide (cuprate) superconductors. In these materials the isotopic effect is extremely weak and does not suggest a strongly coupled phonon-mediated superconductivity Batlogg et al. (1987).
The nature of the pairing interaction has therefore remained controversial. Possible proposals include strong electronic correlations stemming from Mott physics Anderson (1987) or the competition with other exotic phases such as charge Kivelson et al. (2003); Wang and Chubukov (2014); Meier et al. (2014), spin density Demler et al. (2001); Moon and Sachdev (2009); Scalapino (2012) waves or loop currentsVarma (1997).
The scenario is further complicated by the presence of another gap (the pseudogap), which is an ingredient missing in the BCS description. The pseudogap manifests itself above as a loss of quasiparticle spectral weight Alloul et al. (1989); Warren et al. (1989); Timusk and Statt (1999). Whether or not the pseudogap plays any role in the high-mechanism, this remains a fundamental open question. This inherent complexity of the cuprates has hidden key features of the pairing mechanism in most experiments, preventing a satisfactory understanding of high superconductivity.
In this article we present an electronic Raman scattering study in the geometry on a slightly-underdoped (UD) three-copper-oxide-layer compound HgBa2Ca2Cu3O8+δ (Hg-1223). We reveal a nontrivial relationship between the pair-breaking peak (PP), which corresponds to two Bogoliubov quasiparticle excitations, and a loss of spectral weight (dip) appearing on its higher-energy side. Remarkably, the PP and dip disappear simultaneously at , indicating a transfer of spectral weight from the dip electronic states to the PP at lower energies. This behavior is in sharp contrast with the BCS pairing mechanism, which involves only the low-energy electronic states around the Fermi level, being transferred to the superconducting gap edges below . We are able to explain our experimental observations using the cellular dynamical mean-field theory Kotliar et al. (2001) (CDMFT) applied to the two-dimensional Hubbard model, the basic strongly correlated electron model describing copper-oxygen planes in cuprates. CDMFT unveils an unusual relationship between a particle-hole symmetric superconducting gap and a particle-hole asymmetric pseudogap, coexisting below . While below the Fermi level they share the same gap edge, above the Fermi level they compete for the same states. Spectral weight is in fact removed from the pseudogap upper edge to lower energies contributing to the formation of the upper superconducting Bogoulibov peak. This unconventional mechanism is ultimately responsible for the PP-dip behaviour observed in the Raman response.
.
Raman measurements have been carried out on UD Hg- single crystal with =122 K grown by a single step synthesis under normal pressure in evacuated quartz tube Colson et al. (1994); Bertinotti et al. (1995). The Hg-1223 cuprate family exhibits the highest critical temperature 135 K at ambient pressure Schilling et al. (1993). In this material the phonons do not mask the low-energy electronic spectrum Sacuto et al. (1996, 1997, 1998, 2000) contrary to other cuprates. This gives us an unique opportunity to resolve detailed features of the superconducting state. Moreover the large is suitable for studying the superconducting features over a wide temperature range.
The -symmetry Raman response, obtained from crossed light polarizations along the Cu-O bond directions, gives us access to the antinodal region of the momentum space where the superconducting gap is maximal and the pseudogap sets in. All the spectra have been corrected for the Bose factor and the instrumental spectral response. They are thus proportional to the imaginary part of the Raman response function Sacuto et al. (2013).
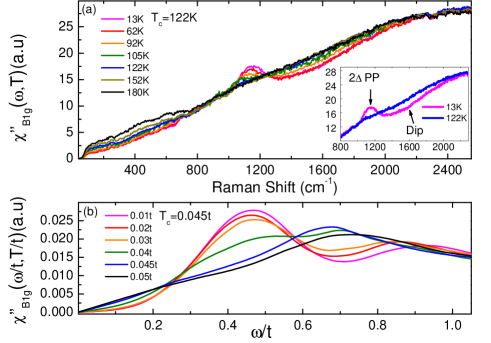
In Fig. 1 (a) the Raman response is displayed over a wide frequency range (up to 2500 ) and from = 13 K to = 180 K. The key feature that we observe in the superconducting state ( 122 K) is the PP at twice the superconducting gap followed at higher Raman shift by the dip in the electronic continuum at ( ). The PP-dip structure has also been found in a two-layer compound Chubukov et al. (1999) and we have checked that it also exists in the superconducting Raman response of a single layer material HgBa2CuO4+δ (Hg-1201) (see Supplemental Material). Therefore the PP-dip structure (that we observe in the superconducting state) is different from a bilayer band splitting effect proposed to explain the peak-dip-hump structure in the ARPES spectra of a two-layer Bi-2212 compound Feng et al. (2001); Damascelli et al. (2003). This is confirmed by the fact that the PP-dip feature in the Raman spectrum disappears at while the band splitting effect is supposed to persist above Feng et al. (2001); Damascelli et al. (2003).
The PP position is in good agreement with earlier tunneling and optical measurements on Hg-1223 compounds Wei et al. (1998); McGuire et al. (2000). In tunneling, the gap for an optimally doped Hg-1223 was estimated to be . In optical conductivity, the pairing gap deduced from the scattering rate was estimated to be about 1100 .
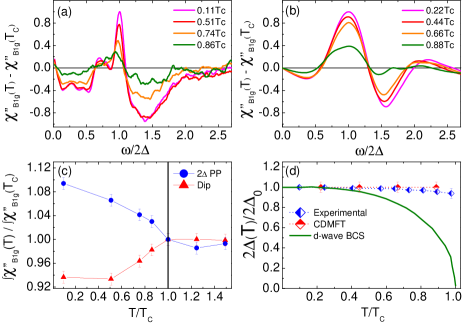
As the temperature rises up to , the PP decreases in intensity while the low energy electronic background below ( in 2 unit) increases, as clearly seen by plotting the difference (Fig. 2 (a)) Not . This behavior is typically expected in the BCS theory, where the low energy spectral weight is removed and transferred to the superconducting gap edges, producing the 2 PP in the . The remarkable fact in the present result is that the dip too, around , is filled up completely together with the decrease of the PP and disappears at =122 K. This is better seen in Fig. 2 (c), where we plot the normalized integrated Raman intensity associated with the PP and the dip. The PP and dip lines join together at by definition, but the fact that they are essentially constant above shows that the two features have disappeared in the normal state.
Since the Raman response in Fig. 1(a) is -independent above the dip energy in the superconducting state (this has been checked up to 4600 ), it is natural to infer that the lost spectral weight in the dip is transferred to the 2 PP, producing an unconventional pairing mechanism. The possibility of high energy-state contribution to the pairing was suggested in earlier optical measurements Basov et al. (1999); Santander-Syro et al. (2003) and ARPES resultsHashimoto et al. (2015).
Another known non-BCS behavior underlined by our experimental findings is the energy location of the 2 peak, which is roughly constant with increasing temperature up to (see Fig. 2(d)). This property is general among one and two-copper-oxide-layer compounds slightly underdoped such as Hg-1201 Guyard et al. (2008) and Bi2Sr2CaCu2O8+δ (Bi-2212) Staufer et al. (1992), and it is another sign of unconventional behavior.
Notice that above =122 K, the low energy background level continues to rise with (see Fig. 1 (a)). This is the Raman signature of the presence of the pseudogap in the normal state which manifests itself as a recovery of low energy spectral weight Sakai et al. (2013); Benhabib et al. (2015).
.
All the above temperature-dependent features, in particular the 2 PP-dip structure, of the response are difficult to explain in the framework of BCS-like theory. For instance the weak-coupling BCS theory Branch and Carbotte (1995) of a -wave superconductor does explain a 2 peak which collapses at (Figs. 1(a) and 2(a)), however this should be accompanied by a consequent reduction of the peak position 2 with increasing , contrary to the above experimental observation (see Fig. 2 (d)). Moreover no dip is explicable within the BCS theory.
The fact that 2 is much higher than 4.28expected in the weak coupling theory Musaelian et al. (1996) hints at a strong coupling nature for the pairing state. This is the case for instance in preformed pair theories Anderson (1987); Kotliar and Liu (1988); Emery and Kivelson (1995); Franz and Millis (1998); Altman and Auerbach (2002). In such theories incoherent Cooper pairs exist above and their pairing gap is identified with the beforehand mentioned pseudogap. Below the pairs acquire phase coherence establishing a superconducting state, and the pseudogap smoothly evolves into the superconducting gap. A main consequence is that the spectroscopic gap amplitude , and hence the 2 PP energy position, is only slightly temperature-dependent approaching from below Mihlin and Auerbach (2009). Within such a scenario however the PP should survive above , contrary to the experimental observations. A theory describing the interaction between superconductivity and spin-density waves Chubukov et al. (1999) may account for the the 2-peak-dip feature below . Also in this case, however, the PP feature is expected to survive above . We show now that the CDMFT calculation of the Hubbard model can qualitatively account for all the experimental features observed above and explain the tight relationship between the PP and the dip in the Raman response.
The Raman spectra are calculated in CDMFT within the bubble approximation through
| (1) |
with and is the Fermi distribution function. Here, the normal () and anomalous () Green’s functions calculated with the CDMFT are interpolated in the momentum space Kyung et al. (2006). This approximation is quite robust around the antinodal region, which includes the cluster momenta , , and will not affect our conclusions on the Raman response. The parameters we employ for the Hubbard model are typical for the copper-oxygen planes: the (next-)nearest-neighbor transfer integral ( -0.2) and the on site Coulomb repulsion . The CDMFT is implemented on a 22 cluster and it is solved with a finite-temperature extension of the exact diagonalization method Liebsch and Ishida (2012). Previous CDMFT studies have reproduced various essential features of the cuprate phase diagram Maier et al. (2005a); Kotliar et al. (2006); Tremblay et al. (2006); Haule and Kotliar (2007); Gull et al. (2010); Sordi et al. (2012a); Alloul (2014), including the Mott insulator, antiferromagnetism, pseudogap Huscroft et al. (2001); Civelli et al. (2005); Maier et al. (2005a); Kyung et al. (2006); Gull et al. (2010); Ferrero et al. (2010); Sordi et al. (2010, 2012b); Sakai et al. (2009, 2010); Liebsch and Tong (2009) and -wave superconductivity Maier et al. (2000); Lichtenstein and Katsnelson (2000); Maier et al. (2005b); Kancharla et al. (2008); Civelli (2009); Sordi et al. (2012a); Gull et al. (2013). However, the optimal doping in the 22 CDMFT for which is maximal () is smaller than the one () in experiments. For this reason, we use in the present CDMFT study to discuss the properties of the slightly underdoped cuprate. A quantitative comparison with experiments is therefore not possible and we restrict ourselves to a qualitative one.
The CDMFT Raman response displayed in Fig. 1(b) reproduces the key features found in the experiment. First, the CDMFT results portray well the experimentally observed PP-dip structure in the superconducting state (and they are in agreement with previous calculation with a similar method Gull and Millis (2013)). The PP and the dip are respectively located at and . Secondly, this structure is clearly associated with superconductivity: It diminishes with increasing temperature until disappearing at , as seen in Fig. 2(b). Thirdly, as it can be seen in Fig. 2(d), the calculated PP position 2 is almost constant with temperature up to , consistently with the experimental data displayed in the same figure, signaling an unconventional superconductivity (clearly departing from BCS). Furthermore, the ratio in the CDMFT is rather high as compared to the BCS prediction (), like the experimental value ().
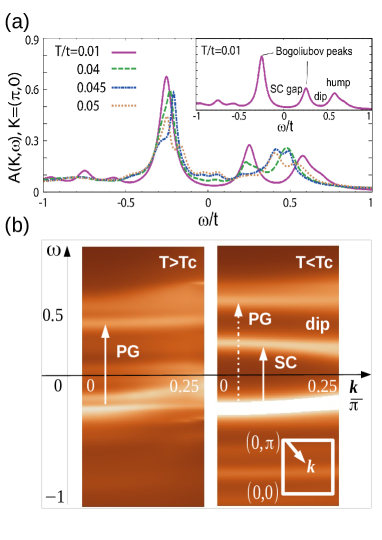
As Eq. (1) reproduces qualitatively well the experimental results, we can resort to the single-particle quantities to gain insight into the mechanism originating the PP-dip behavior. To this purpose, we display in Fig. 3(a) the spectral function at for different temperatures above and below . Here, is estimated from the disappearance of the superconducting order parameter. Figure 3(b) shows an intensity plot of along the cut in momentum space, showing that the spectral structure of displayed in Fig. 3(a) is well representative of the antinodal region, which is the most relevant to via the Raman vertex (Eq. 1).
At , the system is in the normal state. Previous CDMFT studies Maier et al. (2005a); Kyung et al. (2006) have established that a pseudogap appears at small doping, as evidenced in Fig. 3(a) (yellow-dotted curve) and 3(b) by a wide depression around . The pseudogap edges are located at , marked by a well defined peak, and at t, where a wide incoherent hump is observed. Since the hump is located inside the Mott gap extending to high energies ( not visible in the figure, see e.g., Fig 11(a) in Ref. Sakai et al. (2010)) we shall call the hump in-gap states. The presence of the in-gap states is a direct consequence of carrier-doping a Mott insulator without requiring any spontaneous symmetry-breaking Eskes et al. (1991). The resulting Raman response at in Fig. 1(b) shows a large incoherent background signal. We have shown in a previous work on the normal state that when the pseudogap depression around fills in by increasing temperature, recovers spectral weight on a wide range at low energy Sakai et al. (2013); Benhabib et al. (2015). This is consistent with the experimental Raman response Fig. 1(a) above =122 K, where the low energy spectral weight is partially restored as the temperature rises up to 180 K.
Below the superconductivity develops by opening a superconducting gap symmetrically around the Fermi level (Fig. 3(b)). In the conventional BCS mechanism, the spectral weight removed around is accumulated at the gap edges where coherent (narrower and with higher intensity) Bogoliubov peaks are formed. In preformed Cooper pair scenario the gap already exists above , and one should just observe the Bogoliubov peaks arising at the pseudogap edges. The interesting unusual property is how this is taking place in our system, where a pseudogap-spectral-weight depression already exists around the Fermi level above and it is not particle-hole symmetric Sakai et al. (2013) like the superconducting gap. At negative energy, the lower Bogoliubov peak arises almost at the pseudogap edge, in line with the preformed-pair description and as supported for instance in tunneling and ARPES experiments on Bi-2212 materials Renner et al. (1998); Norman et al. (1998); Chatterjee et al. (2011); Hashimoto et al. (2014). At positive energy however the upper Bogoliubov peak develops at , significantly lower than the pseudogap edge at . This process reassures the transfer of spectral weight from low energy () like in BCS, but also from higher energies (in correspondence of the pseudogap upper edge ), where the dip forms. With decreasing temperature the upper Bogoliubov peak grows and dip deepens, as evident in Fig. 3 (a).
A previous study Sakai et al. (2014) has shown that the competition between pseudogap and the superconducting gap can be explained by nontrivial cancellations in pole features of the normal and anomalous self-energies, which makes possible for the upper Bogoliubov peak to arise at energies where the spectral weight has been suppressed by the pseudogap. This result advocates in favor of coexisting between the pseudogap and the superconducting gap below , with the latter appearing smaller Gull and Millis (2015) (see Fig.3(b)), when observed in the unoccupied side of spectra as in Raman spectroscopy.
The peak-dip structure on the positive frequency side of , displayed in Fig. 3(a-b), produces the PP-dip structure in the calculated Raman response in Fig. 1(b). As it can be seen from Figs. 2(a) and 2(b), the PP-dip structure in is therefore the direct key fingerprint of an unconventional pairing mechanism involving transfer of spectral weight from high-energy states.
In conclusion, we have studied a key temperature-dependent peak-dip relation in the Raman response of the superconducting state of slightly underdoped Hg-1223 by combining Raman experiments and CDMFT calculation. We reveal an unconventional pairing mechanism originating from the interplay between the superconducting gap and the pseudogap in the antinodal region. In order to form the Cooper pairs, spectral weight is transferred not only from states close to the Fermi level but also from high-energy states located at the pseudogap upper edge. The final scenario conveyed here is unusual within the debate on the relation between unconventional superconductivity and pseudogap: while matching on the negative energy occupied side, they appear competing for the same electrons in the positive energy unoccupied side of the electronic spectra, being at the same time friends and foes Norman et al. (2005).
We are grateful to A. Georges, M. Imada, I. Paul, A.J. Millis and A. Auerbach for fruitful discussions. Correspondences and requests for materials should be addressed to A.S. (alain.sacuto@univ-paris-diderot.fr), M.C. (civelli@u-psud.fr) and S.S (shiro.sakai@riken.jp). S.S. is supported by JSPS KAKENHI Grant No. 26800179; B.L. is supported by the DIM OxyMORE, Ile de France.
I SUPPLEMENTAL MATERIAL
Peak-Dip Structure In Single Layer HgBa2Cu4O6
In Fig.1 is displayed the normal (100 K) and the superconducting (12 K) Raman responses of a slightly UD HgBa2Cu4O6 (Hg-1201) single crystal with a =92 K ((max) =96 K). The Raman spectra were obtained by using the same laser excitation line (532 nm) than the one used in Fig.1 (a) of the article. Contrary to the Hg-1223 material, phonon lines superimposed to the electronic background make more difficult the observation of the pair breaking peak-dip structure. However by subtracting the normal state Raman response from the superconducting one, we are able to detect peak-dip structure (see inset of Fig.1). They are respectively located at and . This result confirms that the peak-dip structure that we observe in the Raman response in the superconducting state is not linked to a inter-layer band splitting effect.
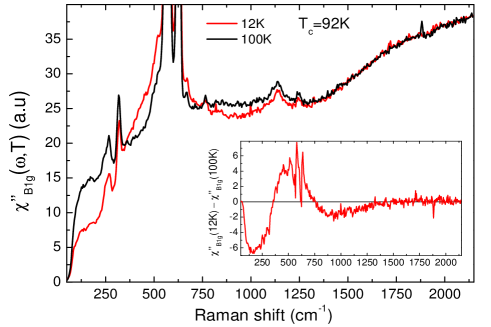
The normal (100 K) and superconducting (12 K) spectra have been measured by using an ARS closed-cycle He cryostat. The laser power at the entrance of cryostat was maintained below to avoid over heating of the crystal estimated to at . The Raman spectra have been corrected for the Bose factor and the instrumental spectral response. They are thus proportional to the imaginary part of the Raman response function, .
References
- Bardeen et al. (1957) J. Bardeen, L. N. Cooper, and J. R. Schrieffer, Phys. Rev. 108, 1175 (1957).
- Schrieffer et al. (1963) J. R. Schrieffer, D. J. Scalapino, and J. W. Wilkins, Phys. Rev. Lett. 10, 336 (1963).
- Batlogg et al. (1987) B. Batlogg, R. J. Cava, A. Jayaraman, R. B. van Dover, G. A. Kourouklis, S. Sunshine, D. W. Murphy, L. W. Rupp, H. S. Chen, A. White, K. T. Short, A. M. Mujsce, and E. A. Rietman, Phys. Rev. Lett. 58, 2333 (1987).
- Anderson (1987) P. W. Anderson, Science 235, 1196 (1987).
- Kivelson et al. (2003) S. A. Kivelson, I. P. Bindloss, E. Fradkin, V. Oganesyan, J. M. Tranquada, A. Kapitulnik, and C. Howald, Rev. Mod. Phys. 75, 1201 (2003).
- Wang and Chubukov (2014) Y. Wang and A. Chubukov, Phys. Rev. B 90, 035149 (2014).
- Meier et al. (2014) H. Meier, C. Pépin, M. Einenkel, and K. B. Efetov, Phys. Rev. B 89, 195115 (2014).
- Demler et al. (2001) E. Demler, S. Sachdev, and Y. Zhang, Phys. Rev. Lett. 87, 067202 (2001).
- Moon and Sachdev (2009) E. G. Moon and S. Sachdev, Phys. Rev. B 80, 035117 (2009).
- Scalapino (2012) D. J. Scalapino, Rev. Mod. Phys. 84, 1383 (2012).
- Varma (1997) C. M. Varma, Phys. Rev. B 55, 14554 (1997).
- Alloul et al. (1989) H. Alloul, T. Ohno, and P. Mendels, Phys. Rev. Lett. 63, 1700 (1989).
- Warren et al. (1989) W. W. Warren, R. E. Walstedt, G. F. Brennert, R. J. Cava, R. Tycko, R. F. Bell, and G. Dabbagh, Phys. Rev. Lett. 62, 1193 (1989).
- Timusk and Statt (1999) T. Timusk and B. Statt, Reports on Progress in Physics 62, 61 (1999).
- Kotliar et al. (2001) G. Kotliar, S. Y. Savrasov, G. Pálsson, and G. Biroli, Phys. Rev. Lett. 87, 186401 (2001).
- Colson et al. (1994) D. Colson, A. Bertinotti, J. Hammann, J. Marucco, and A. Pinatel, Physica C: Superconductivity 233, 231 (1994).
- Bertinotti et al. (1995) A. Bertinotti, D. Colson, J. Hammann, J.-F. Marucco, D. Luzet, A. Pinatel, and V. Viallet, Physica C: Superconductivity 250, 213 (1995).
- Schilling et al. (1993) A. Schilling, M. Cantoni, J. D. Guo, and H. R. Ott, Nature 363, 56 (1993).
- Sacuto et al. (1996) A. Sacuto, A. Lebon, D. Colson, A. Bertinotti, J.-F. Marucco, and V. Viallet, Physica C: Superconductivity 259, 209 (1996).
- Sacuto et al. (1997) A. Sacuto, R. Combescot, N. Bontemps, P. Monod, V. Viallet, and D. Colson, EPL (Europhysics Letters) 39, 207 (1997).
- Sacuto et al. (1998) A. Sacuto, R. Combescot, N. Bontemps, C. A. Müller, V. Viallet, and D. Colson, Phys. Rev. B 58, 11721 (1998).
- Sacuto et al. (2000) A. Sacuto, J. Cayssol, P. Monod, and D. Colson, Phys. Rev. B 61, 7122 (2000).
- Sacuto et al. (2013) A. Sacuto, Y. Gallais, M. Cazayous, M.-A. Méasson, G. D. Gu, and D. Colson, Reports on Progress in Physics 76, 022502 (2013).
- Chubukov et al. (1999) A. Chubukov, D. Morr, and G. Blumberg, Solid State Communications 112, 183 (1999).
- Feng et al. (2001) D. L. Feng, N. P. Armitage, D. H. Lu, A. Damascelli, J. P. Hu, P. Bogdanov, A. Lanzara, F. Ronning, K. M. Shen, H. Eisaki, C. Kim, Z.-X. Shen, J.-i. Shimoyama, and K. Kishio, Phys. Rev. Lett. 86, 5550 (2001).
- Damascelli et al. (2003) A. Damascelli, Z. Hussain, and Z.-X. Shen, Rev. Mod. Phys. 75, 473 (2003).
- Wei et al. (1998) J. Y. T. Wei, C. C. Tsuei, P. J. M. van Bentum, Q. Xiong, C. W. Chu, and M. K. Wu, Phys. Rev. B 57, 3650 (1998).
- McGuire et al. (2000) J. J. McGuire, M. Windt, T. Startseva, T. Timusk, D. Colson, and V. Viallet-Guillen, Phys. Rev. B 62, 8711 (2000).
- (29) Notice a weak bump around (i.e., ; see Fig. 2(a)), which was erroneously interpreted as the PP in previous publications on this material Sacuto et al. (1998, 2000), because of the narrow frequency range () available in those measurements. .
- Basov et al. (1999) D. N. Basov, S. I. Woods, A. S. Katz, E. J. Singley, R. C. Dynes, M. Xu, D. G. Hinks, C. C. Homes, and M. Strongin, Science 283, 49 (1999), http://science.sciencemag.org/content/283/5398/49.full.pdf .
- Santander-Syro et al. (2003) A. F. Santander-Syro, R. P. S. M. Lobo, N. Bontemps, Z. Konstantinovic, Z. Z. Li, and H. Raffy, EPL (Europhysics Letters) 62, 568 (2003).
- Hashimoto et al. (2015) M. Hashimoto, E. A. Nowadnick, R.-H. He, I. M. Vishik, B. Moritz, Y. He, K. Tanaka, R. G. Moore, D. Lu, Y. Yoshida, M. Ishikado, T. Sasagawa, K. Fujita, S. Ishida, S. Uchida, H. Eisaki, Z. Hussain, T. P. Devereaux, and Z.-X. Shen, Nat Mater 14, 37 (2015).
- Guyard et al. (2008) W. Guyard, M. Le Tacon, M. Cazayous, A. Sacuto, A. Georges, D. Colson, and A. Forget, Phys. Rev. B 77, 024524 (2008).
- Staufer et al. (1992) T. Staufer, R. Nemetschek, R. Hackl, P. Müller, and H. Veith, Phys. Rev. Lett. 68, 1069 (1992).
- Sakai et al. (2013) S. Sakai, S. Blanc, M. Civelli, Y. Gallais, M. Cazayous, M.-A. Méasson, J. S. Wen, Z. J. Xu, G. D. Gu, G. Sangiovanni, Y. Motome, K. Held, A. Sacuto, A. Georges, and M. Imada, Phys. Rev. Lett. 111, 107001 (2013).
- Benhabib et al. (2015) S. Benhabib, A. Sacuto, M. Civelli, I. Paul, M. Cazayous, Y. Gallais, M. A. Méasson, R. D. Zhong, J. Schneeloch, G. D. Gu, D. Colson, and A. Forget, Phys. Rev. Lett. 114, 147001 (2015).
- Branch and Carbotte (1995) D. Branch and J. P. Carbotte, Phys. Rev. B 52, 603 (1995).
- Musaelian et al. (1996) K. A. Musaelian, J. Betouras, A. V. Chubukov, and R. Joynt, Phys. Rev. B 53, 3598 (1996).
- Kotliar and Liu (1988) G. Kotliar and J. Liu, Phys. Rev. B 38, 5142 (1988).
- Emery and Kivelson (1995) V. J. Emery and S. A. Kivelson, Nature 374, 434 (1995).
- Franz and Millis (1998) M. Franz and A. J. Millis, Phys. Rev. B 58, 14572 (1998).
- Altman and Auerbach (2002) E. Altman and A. Auerbach, Phys. Rev. B 65, 104508 (2002).
- Mihlin and Auerbach (2009) A. Mihlin and A. Auerbach, Phys. Rev. B 80, 134521 (2009).
- Kyung et al. (2006) B. Kyung, S. S. Kancharla, D. Sénéchal, A.-M. S. Tremblay, M. Civelli, and G. Kotliar, Phys. Rev. B 73, 165114 (2006).
- Liebsch and Ishida (2012) A. Liebsch and H. Ishida, Journal of Physics: Condensed Matter 24, 053201 (2012).
- Maier et al. (2005a) T. Maier, M. Jarrell, T. Pruschke, and M. H. Hettler, Rev. Mod. Phys. 77, 1027 (2005a).
- Kotliar et al. (2006) G. Kotliar, S. Y. Savrasov, K. Haule, V. S. Oudovenko, O. Parcollet, and C. A. Marianetti, Rev. Mod. Phys. 78, 865 (2006).
- Tremblay et al. (2006) A.-M. S. Tremblay, B. Kyung, and D. Sénéchal, Low Temperature Physics 32, 424 (2006).
- Haule and Kotliar (2007) K. Haule and G. Kotliar, Phys. Rev. B 76, 104509 (2007).
- Gull et al. (2010) E. Gull, M. Ferrero, O. Parcollet, A. Georges, and A. J. Millis, Phys. Rev. B 82, 155101 (2010).
- Sordi et al. (2012a) G. Sordi, P. Sémon, K. Haule, and A.-M. S. Tremblay, Phys. Rev. Lett. 108, 216401 (2012a).
- Alloul (2014) H. Alloul, Comptes Rendus Physique 15, 519 (2014).
- Huscroft et al. (2001) C. Huscroft, M. Jarrell, T. Maier, S. Moukouri, and A. N. Tahvildarzadeh, Phys. Rev. Lett. 86, 139 (2001).
- Civelli et al. (2005) M. Civelli, M. Capone, S. S. Kancharla, O. Parcollet, and G. Kotliar, Phys. Rev. Lett. 95, 106402 (2005).
- Ferrero et al. (2010) M. Ferrero, O. Parcollet, A. Georges, G. Kotliar, and D. N. Basov, Phys. Rev. B 82, 054502 (2010).
- Sordi et al. (2010) G. Sordi, K. Haule, and A.-M. S. Tremblay, Phys. Rev. Lett. 104, 226402 (2010).
- Sordi et al. (2012b) G. Sordi, P. Sémon, K. Haule, and A.-M. S. Tremblay, Scientific Reports 2, 547 (2012b).
- Sakai et al. (2009) S. Sakai, Y. Motome, and M. Imada, Phys. Rev. Lett. 102, 056404 (2009).
- Sakai et al. (2010) S. Sakai, Y. Motome, and M. Imada, Phys. Rev. B 82, 134505 (2010).
- Liebsch and Tong (2009) A. Liebsch and N.-H. Tong, Phys. Rev. B 80, 165126 (2009).
- Maier et al. (2000) T. Maier, M. Jarrell, T. Pruschke, and J. Keller, Phys. Rev. Lett. 85, 1524 (2000).
- Lichtenstein and Katsnelson (2000) A. I. Lichtenstein and M. I. Katsnelson, Phys. Rev. B 62, R9283 (2000).
- Maier et al. (2005b) T. A. Maier, M. Jarrell, T. C. Schulthess, P. R. C. Kent, and J. B. White, Phys. Rev. Lett. 95, 237001 (2005b).
- Kancharla et al. (2008) S. S. Kancharla, B. Kyung, D. Sénéchal, M. Civelli, M. Capone, G. Kotliar, and A.-M. S. Tremblay, Phys. Rev. B 77, 184516 (2008).
- Civelli (2009) M. Civelli, Phys. Rev. B 79, 195113 (2009).
- Gull et al. (2013) E. Gull, O. Parcollet, and A. J. Millis, Phys. Rev. Lett. 110, 216405 (2013).
- Gull and Millis (2013) E. Gull and A. J. Millis, Phys. Rev. B 88, 075127 (2013).
- Eskes et al. (1991) H. Eskes, M. B. J. Meinders, and G. A. Sawatzky, Phys. Rev. Lett. 67, 1035 (1991).
- Renner et al. (1998) C. Renner, B. Revaz, J.-Y. Genoud, K. Kadowaki, and O. Fischer, Phys. Rev. Lett. 80, 149 (1998).
- Norman et al. (1998) M. R. Norman, H. Ding, M. Randeria, J. C. Campuzano, T. Yokoya, T. Takeuchi, T. Takahashi, T. Mochiku, K. Kadowaki, P. Guptasarma, and D. G. Hinks, Nature 392, 157 (1998).
- Chatterjee et al. (2011) U. Chatterjee, D. Ai, J. Zhao, S. Rosenkranz, A. Kaminski, H. Raffy, Z. Li, K. Kadowaki, M. Randeria, M. R. Norman, and J. C. Campuzano, Proceedings of the National Academy of Sciences 108, 9346 (2011).
- Hashimoto et al. (2014) M. Hashimoto, I. M. Vishik, R.-H. He, T. P. Devereaux, and Z.-X. Shen, Nat Phys 10, 483 (2014).
- Sakai et al. (2014) S. Sakai, M. Civelli, and M. Imada, ArXiv e-prints (2014), arXiv:1411.4365 [cond-mat.str-el] .
- Gull and Millis (2015) E. Gull and A. J. Millis, Phys. Rev. B 91, 085116 (2015).
- Norman et al. (2005) M. R. Norman, D. Pines, and C. Kallin, Advances in Physics 54, 715 (2005).