[table]labelsep=period,labelfont=bf,rm
\captionsetup[figure]labelfont=bf,labelsep=period
UPV/EHU]
22footnotemark: 2 Nano-Bio Spectroscopy Group and ETSF Scientific Development Center, Departamento de Física de Materiales, Centro de Física de Materiales CSIC-UPV/EHU-MPC
Universidad del País Vasco UPV/EHU and DIPC, E-20018 San Sebastián, Spain
UPV/EHU]
22footnotemark: 2 Nano-Bio Spectroscopy Group and ETSF Scientific Development Center, Departamento de Física de Materiales, Centro de Física de Materiales CSIC-UPV/EHU-MPC
Universidad del País Vasco UPV/EHU and DIPC, E-20018 San Sebastián, Spain
IIT]
33footnotemark: 3 Center for Nano Science and Technology, Istituto Italiano di Tecnologia, Via Pascoli 70/3, I-20133 Milano, Italy
\alsoaffiliation[PM]
55footnotemark: 5 Politecnico di Milano, Dipartmento di Fisica, P.zza L. Da Vinci 32, I-20133 Milano, Italy
IIT]
33footnotemark: 3 Center for Nano Science and Technology, Istituto Italiano di Tecnologia, Via Pascoli 70/3, I-20133 Milano, Italy
\alsoaffiliation[PM]
55footnotemark: 5 Politecnico di Milano, Dipartmento di Fisica, P.zza L. Da Vinci 32, I-20133 Milano, Italy
IIT]
33footnotemark: 3 Center for Nano Science and Technology, Istituto Italiano di Tecnologia, Via Pascoli 70/3, I-20133 Milano, Italy
\alsoaffiliation[PM]
55footnotemark: 5 Politecnico di Milano, Dipartmento di Fisica, P.zza L. Da Vinci 32, I-20133 Milano, Italy
UPV/EHU]
22footnotemark: 2 Nano-Bio Spectroscopy Group and ETSF Scientific Development Center, Departamento de Física de Materiales, Centro de Física de Materiales CSIC-UPV/EHU-MPC
Universidad del País Vasco UPV/EHU and DIPC, E-20018 San Sebastián, Spain
\alsoaffiliation[MaxPlanck]
44footnotemark: 4 Max Planck Institute for the Structure and Dynamics of Matter, Luruper Chaussee 149, D-22761 Hamburg, Germany
Photoinduced Absorption within Single-Walled Carbon Nanotube Systems
ABSTRACT:
We study the photoabsorption properties of photoactive bulk polymer/ fullerene/nanotube heterojunctions in the near-infrared region. By combining pump-probe spectroscopy and linear response time-dependent density functional theory within the random phase approximation (TDDFT-RPA) we elucidate the excited state dynamics of the transition within (6,5) and (7,5) single-walled carbon nanotubes (SWNTs) and combined with poly(3-hexylthiophene-2,5-diyl) (P3HT) and [6,6]-phenyl-C61-butyric acid methyl ester (PCBM) in P3HT/PCBM/SWNT blended samples. We find the presence of a photoinduced absorption (PA) peak is related mainly to the width of the photobleach (PB) peak and the charge carrier density of the SWNT system. For mixed SWNT samples, the PB peak is too broad to observe the PA peak, whereas within P3HT/PCBM/SWNT blended samples P3HT acts as a hole acceptor, narrowing the PB peak by exciton delocalization, which reveals a PA peak. Our results suggest that the PA peak originates from a widening
of the band gap in the presence of excited electrons and holes. These results have important implications for the development of new organic photovoltaic heterojunctions including SWNTs.
![[Uncaptioned image]](/html/1602.00010/assets/x1.png)
1. INTRODUCTION
Single-walled carbon nanotubes (SWNTs) 1, 2, 3, with their high charge carrier densities 4 and mobilities 5, 6, 7, show promise as electron transporting materials for photoactive polymers 8 within organic photovoltaic devices (OPVs). In fact, a significant enhancement of photocurrent was achieved by inserting SWNTs into the bulk heterojunction (BHJ) of an OPV 9, 10, 11. OPVs with SWNTs can be further improved by enriching the content of semiconducting tubes12, thereby reducing electron-hole trapping13. SWNTs have even been used directly as photoreceptors within BHJs14, 15. However, the power conversion efficiencies (PCEs) of SWNT OPVs still lag behind the best BHJ OPVs16. The optimization of SWNT OPVs requires a combined theoretical and experimental approach to understand the photoelectric processes within SWNT composites. Only in so doing can we take full advantage of the outstanding physical properties of SWNTs within BJH OPVs.
The elementary photoexcitations in SWNTs are singlet excitons with a large binding energy of about 400 meV. 17, 18, 19, 20, 21, 22 Pump-probe spectroscopy is a powerful tool for studying optical properties and exciton dynamics over the femtosecond to microsecond time domain. As an example, the size of the exciton and its diffusion in the incoherent regime have been experimentally estimated for (6,5) SWNTs23 using the phase space filling model.24 Also, the energy of relaxation from higher exciton states to the first exciton transition has been measured, yielding a very short decay time of 50 fs. This is due to the peculiarity of a one-dimensional system, such as a SWNT, and the strong coupling to highly energetic optical phonons.25 The strong electron-phonon coupling is evident in the large Raman cross-section, extensively studied with standard continuous wave techniques. The most intense Raman active modes, radial breathing modes and G modes, have been detected in transient coherent Raman experiments.26, 27
Unfortunately, there are other photoexcited species, resulting from highly nonlinear phenomena, that might occur in SWNTs, besides singlet excitons. For this reason, the interpretation of transient spectra for SWNTs becomes difficult, and this is due to contributions of such species, e.g., triplets 11, biexcitons28, 29, trions30, 31, and charge-carrier photogeneration32, 33. Previous transient absorption measurements34, 35 have found a photoinduced absorption (PA) peak at nm for predominantly (6,5) SWNT samples when pumped in the visible (VIS) region. The structure of this PA feature provides direct information about the photoexcitation processes within the SWNT. It is the structure and origin of this PA peak, and how it depends on the SWNT system, which we will focus upon herein.
In this work, we employ state-of-the-art pump-probe transient absorption spectroscopy to measure the excited state dynamics of a (6,5) and (7,5) SWNT mixture, and combined with poly(3-hexylthiophene-2,5-diyl) (P3HT) and [6,6]-phenyl-C61-butyric acid methyl ester (PCBM) in P3HT/PCBM/SWNT blended samples in the near-infrared (IR). We then employ linear response time dependent (TD) density functional theory (DFT) in frequency-reciprocal space within the random phase approximation (RPA) to model the measured transient spectra for (6,5) and (7,5) SWNTs and blended P3HT/PCBM/SWNT samples.
We begin by providing details of the sample fabrication in section 2.1, optical characterization of the sample in section 2.2, the theoretical methods employed in section 2.3, and computational parameters used in section 2.4. In section 3.1 we provide a detailed comparison of the absorbance and differential transmission spectra obtained for our SWNT and blended P3HT/PCBM/SWNT samples with those available in the literature in the near-IR region as a function of the pump-probe delay. We show in section 3.2 how the differential transmission spectra may be interpreted in terms of a difference in absorption spectra. After briefly justifying our method for modeling optically excited states in section 3.3, we employ TDDFT-RPA calculations of (6,5) SWNTs, (7,5) SWNTs, and a combined PT/PCBM/(6,5) SWNT system in section 3.4 to simulate the measured differential transmission spectra, and explain the dependence of the observed PA peak on charge carrier density in section 3.5 and the photobleach (PB) peak width in section 3.6. This is followed by concluding remarks. A derivation of the TDDFT-RPA formalism, and the influence of local field effects on the SWNT spectra are provided in Appendix A. Atomic units () have been used throughout unless stated otherwise.
2. METHODOLOGY
2.1. Sample Fabrication
The glass substrates were precleaned with acetone and isopropanol and dried under a flow of dry nitrogen. For preparation of the samples, regular P3HT poly(3-hexylthiophene-2,5-diyl) and PCBM ([6,6]-phenyl-C61-butyric acid methyl ester) were dissolved in ortho-dichlorobenzene (ODCB) at a 1:1 ratio. We employed 704148-SWNTs produced using the CoMoCAT catalytic chemical vapor deposition (CVD) method. The SWNTs were also dispersed in ODCB and then sonicated for 1 hour. No debundling or removal of metallic SWNTs was performed on the sample, which was most likely aggregated. The resulting solution was then spin-coated on top of the glass substrates to obtain the SWNT sample. In the case of the P3HT/PCBM/SWNT sample, the dispersed SWNTs were added to the P3HT/PCBM solution at a 1:1:1 ratio and then sonicated for 1 hour. The solution was then spin-coated on top of the glass substrates at 1000 rpm for 2 minutes. All the materials were bought from Sigma-Aldrich.
2.2. Optical Characterization
The ground state absorption spectra were collected with a PerkinElmer spectrophotometer (Lambda 1050 WB InGaAs 3D WB Detection Module). The laser system employed for ultrafast transient absorption was based on a Ti-Sapphire chirp pulse amplified source; with a maximum output energy of about 800 J, 1 kHz repetition rate, central wavelength of 780 nm and pulse duration of about 180 fs. Excitation pulses at 590 and 900 nm were generated by noncollinear optical parametric amplification in a -barium borate (BBO) crystal, with a pulse duration of around 100 fs. Pump pulses were focused in a 200 m diameter spot. Probing was achieved in the visible and near IR region by using white light generated using a thin sapphire plate. Chirp-free transient transmission spectra were collected by using a fast optical multichannel analyzer (OMA) with a dechirping algorithm. The measured quantity is the differential transmission, . Once normalized, the differential transmission may be directly compared with the change in absorbance . The excitation energy has been set to 11 nJ when pumping at 590 nm and then increased to 200 nJ when pumping at 900 nm, i.e., selectively pumping the SWNTs. All measurements were performed in air at room temperature.
2.3. Theoretical Methods
To model differential transmission measurements, we use the difference between the optical absorption of the system in the ground and excited states. We model the system in the excited state within DFT by fixing the total magnetic moment , and through the addition of charge to the system. Specifically, we use the singlet () to model the ground state, the triplet () to model a single exciton, the quintet () to model a pair of excitons, and the quartet () with an additional charge to model a negative trion, i.e., a pair of excited electrons and a single hole.
The optical absorption spectra are obtained via linear response TDDFT-RPA36, 37, 38, 39, 40, from the imaginary part of the macroscopic dielectric function, , in the limit . Details of our implementation are provided in Appendix A.
To model an excited singlet state of the system based on a fixed magnetic moment calculation, we “swap” between the spin channels ( or ) the eigenvalues and eigenfunctions of the levels beyond half the number of electrons, . More precisely, we define
| (1) |
In this way we obtain the electronic structure of a singlet excited state that is constrained to have the same total electron density as the triplet ground state, .
Note that, as we are primarily interested herein with the absorption spectra near their onsets, local field effects may be neglected without impacting our results. This is demonstrated in Appendix A, where we compare ground state TDDFT-RPA spectra for a (6,5) SWNT with and without including local field effects.
2.4. Computational Details
All DFT calculations were performed with locally centered atomic orbitals (LCAOs) and the projector augmented wave (PAW) implementation within the gpaw code 41, 42, 43. We used a double-zeta polarized (DZP) basis set for representing the density and the wave functions and the PBE exchange correlation (xc)-functional 44. All calculations employed a room temperature Fermi filling ( meV), with total energies extrapolated to K, i.e., excluding the electronic entropy contribution to the free energy . In this was we avoided an unrealistic smearing of the excited electron and hole in the triplet calculations. We included many bands within the calculations, which has been shown to be sufficient to converge the first transitions within graphene 39.
Structural minimization was performed within the Atomic Simulation Environment (ASE) 45, until a maximum force below 0.05 eV/Å was obtained. We employed more than 5 Å of vacuum to the cell boundaries orthogonal to the (6,5) SWNT, (7,5) SWNT and polythiophene (PT), and obtained optimized unit cells parameters of 40.92, 44.79, and 7.87 Å along their axes, respectively. Here, PT is modeled using two thiophene units in s-trans configuration. We have used PT as a simplified model for P3HT, that is, removed the hexyl side chains of P3HT, since the influence of the P3HT side chains on the level alignment and charge transfer is negligible40, 46. Moreover, as we shall see in section 3, the influence of P3HT/PT on the IR spectrum of the SWNT is solely through hole-transfer.
The PT/PCBM/(6,5)-SWNT bulk was modeled by a Å2 layered structure of ten thiophene units orthogonal to the SWNT axis, as shown in Figure 1(a). In so doing, this configuration describes the limit of a minimal SWNT–PT overlap. To determine the impact of increasing the SWNT–PT overlap, we also consider a truncated ten unit PT chain aligned with the SWNT and PCBM as shown in Figure 1(b).
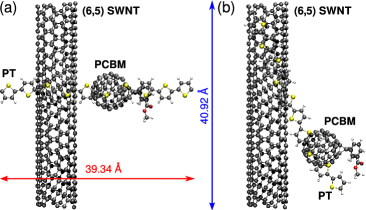
It has previously been shown that changes in the orientations of PCBM next to P3HT only cause energy differences within the accuracy of DFT47. Since the potential energy surface is rather flat47, we have chosen a smallest C–C intramolecular distance of Å between the relaxed P3HT, PCBM, and SWNT structures, and performed single-point calculations for the resulting configurations shown in Figure 1. Although this C–C separation is 0.1 Å smaller than the interlayer distance of multiwalled carbon nanotubes (MWNTs) and graphite 48, it has been chosen to ensure an overlap between the SWNT and PT outer LCAO orbitals. An increase of the PT–SWNT/PCBM distance to Å changes the total energy by less than 50 meV, i.e., within the accuracy of DFT. In each case we found the repulsive forces for the close lying C atoms were eV/Å.
3. RESULTS AND DISCUSSION
3.1. Differential Transmission Measurements
Figure 2
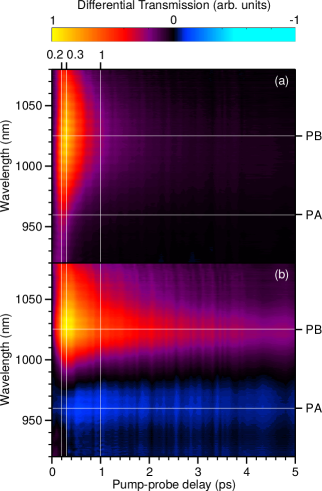
shows the transient spectra of the SWNT and blended P3HT/PCBM/SWNT samples versus probing delay times up to 5 ps. In both spectra, we find a peak with a maximum around 1025 nm. Comparing the transient spectra with the absorbance (black) in Figure 3(a),
this peak can be assigned to the photobleach (PB) of mainly (6,5) and (7,5) SWNT transitions50. For the blended sample, we have an additional photoinduced absorption (PA) peak around 960 nm. The samples show a remarkable difference in the decay rate of the PB peak. In the case of the SWNT sample, the transitions seem to be completely accessible again after 1 ps, while the decay of the exciton in the blended sample is 4–5 times longer.
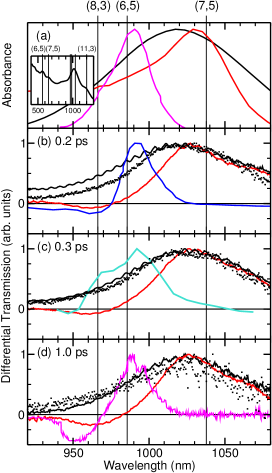
The UV/VIS/NIR absorption spectra of the SWNT sample are shown as an inset to Figure 3(a). The transitions of (6,5) and (7,5) SWNTs are clearly visible, with the transition of (11,5) SWNTs seen as a shoulder.
By comparing the transient spectra of the SWNT sample (black) at delay times of 0.2, 0.3, and 1 ps with the spectra of similar SWNT samples of the literature at the same delay times, we found a discrepancy within the measured peak width and structure of the SWNT sample spectrum and those of the literature34, 35, 49, as shown in Figure 3(b-d). The (6,5) SWNT enriched samples of refs 34 (blue) and 35 (magenta) show a much smaller peak width and an additional PA peak between 940 and 975 nm. The PA peak in the sample of ref 49 (cyan) is overlaid by the PB of the (8,3) SWNT ( nm)50 and therefore not strongly pronounced. As well, the width is broader due to the mixture of tubes. This is consistent with the differential transmission of our SWNT sample.
To determine whether the pump energy has an influence on the peak width, the SWNT sample was pumped at two different wavelengths: 590 nm in the VIS and 900 nm in the IR. These pump energies are comparable to those reported the literature49, 34, 35. For example, ref 49 pumped in the infrared region at 930 nm, while the pump beams at 570 nm employed in refs 34 (blue) and 35 (magenta) were tuned to the transition.
As shown in Figure 3(b,c,d), the differential transmission spectra for our SWNT sample is rather insensitive to whether pumping is in the VIS or IR. This suggests that the broader PB peak within our SWNT sample, shown in Figure 3(a), is related to the sample itself. It has previously been argued that SWNT mixtures have an increased exciton transfer and electron-hole trapping between tubes12, 13. Thus, the greater PB peak width in our SWNT sample may be related to having a mixture of both (6,5) and (7,5) SWNTs. However, having a SWNT mixture does not explain the occurrence of the PA peak in the blended P3HT/PCBM/SWNT sample (red).
Taking a closer look at the transient spectrum of the SWNT sample in Figure 3(b,c,d), we notice it exhibits a small asymmetry. Nevertheless, including a range of 50 nm from the peak maximum, this asymmetry cannot be completely verified, as it is within the noise of the measurement. Thus, the PA appears to completely vanish in the spectra of the SWNT sample.
The recovery time dynamics of the PB and PA peaks for the mixed SWNT sample and the P3HT/PCBM/SWNT blended sample are shown in Figure 4.
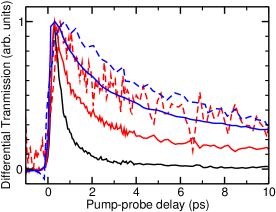
We find the mixed SWNT sample’s recovery time is much shorter than that of the blended P3HT/PCBM/SWNT sample, with the recovery time reported in ref 34 for a predominantly (6,5) SWNT sample even longer. In each case, the PA peaks seem to recover as fast as the PB peaks or slightly slower.
The main reason for the extinction of the PA peak is the large peak width, which is crucial for the visibility of the PA peak. However this does not explain its origin.
3.2. Interpreting differential transmission as a Difference Spectra
Zhu et al.34 found a PA peak, and suggested it is due to a biexcitation. In a subsequent paper, Zhu 35 suggested coupling to the radial breathing mode as a reason for the PA peak.
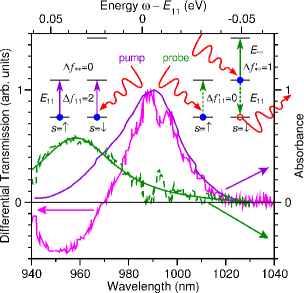
we identified the peak causing the PA peak by taking the difference between the normalized absorbance (violet) and the normalized transient spectrum (magenta). This results in the difference spectrum of the probe beam (green), when the system is fully excited by the pump beam, that is, all electrons of the transition are in the CBM. In this case, the excited system gives rise to an absorbance of more than 50% of the PB peak but at the energy of the PA peak.
Suppose the PA peak is due to absorption by an excited electron, i.e., an excited electron transition , as depicted schematically in Figure 5. It should be noted that the single particle picture employed here refers to the system being excited, rather than the excitation process itself. When the system is initially excited by the pump, the difference in filling for the transition, , while the difference in filling for the transition’s levels . When the system is subsequently excited by the probe, that is, in the presence of an exciton, , while . Since a transition’s intensity is proportional to the difference in filling, the 2:1 ratio between PB and PA peaks is already accounted for by . This requires the and transitions to have almost the same overlaps.
Although this does not rule out the possibility of an transition being responsible for the PA peaks close to the PB peaks within the SWNT systems, it makes it rather unlikely. More importantly, it suggests the PA and PB peaks most likely arise from the same transition. In fact, in section 3.4 we will show that the transition is blue shifted by a band gap widening in the excited state, potentially explaining the origin of the PA peak.
3.3. Modeling Optically Excited States
As discussed in section 2.3, we model the optically excited state using a singlet excited state whose total electron density is constrained to be that of the triplet ground state. This singlet excited state is a suitable approximation to the optically excited state if the spin densities associated with the Kohn Sham (KS) valence band maximum (VBM) and conduction band minimum (CBM) eigenfunctions, and , are only weakly dependent on the spin channel . In other words, if the two spin channels in the triplet DFT calculation are basically equivalent up to a phase factor, i.e., , the optically excited state should have a similar electron density. If, moreover, the singlet and triplet ground state eigenfunctions are also basically equivalent up to a phase factor, i.e., , this singlet excited state should describe the optically excited state quite well.
We find this is indeed the case for the (6,5) and (7,5) SWNTs, with the KS eigenfunctions having approximately the same spatial distribution in the singlet and triplet ground states. For the blended SWNT/PT/PCBM systems, the KS eigenfunctions have similar spatial distribution in both spin channels for the triplet DFT calculation, but differ from the singlet ground state KS eigenfunctions. In particular, the occupied CBM level of the triplet DFT calculation is a hybridization of the first three CB eigenfunctions from the singlet ground state calculation. This is indicative of charge transfer in the blended SWNT/PT/PCBM system.
Overall, these results strongly suggest that the total electron density of the triplet DFT calculation should be quite similar to that of the optically excited state. This justifies our use of the singlet excited state electronic structure, obtained by "swapping" between spin channels the CB eigenvalues and eigenfunctions of the triplet ground state, to model the optically excited state.
3.4. TDDFT-RPA Simulated Spectra
The differential transmissions in the long term limit of the (6,5) SWNT (black) and bulk PT/PCBM/(6,5) SWNT systems (red) in Figure 6
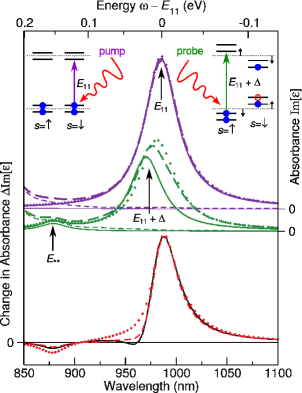
are calculated using the difference between the TDDFT-RPA ground state (violet) and excited state (green) absorbances. The ground state absorbance of the bulk system (dashed) shows the onset of PT absorbance at nm, orthogonal to the transition. In the range of 925 to 1100 nm, both systems, the (6,5) SWNT and the bulk, overlap. This suggests that neither PT nor PCBM transitions are involved within this energy range, and there are only (6,5) SWNT transitions. The excited state absorbances (green) of both systems show two significant changes: the PB peak is shifted to higher energy and there is a new transition at nm. This new peak with rather low intensity is absorbing orthogonal to the tube axis, and can be assigned to an intratube interband transition of the excited electron in the CBM to an energy level eV above the CBM. However, this peak vanishes when local field effects are included, as shown in Appendix A, which may be related to modeling debundled SWNTs 51.
The schematic in Figure 6 explains the origin of the transition shifts in the excited states. As discussed in section 2.3, we modeled the excited state by computing a triplet state in the first step. The singlet excited state is obtained by swapping the eigenenergies and eigenfunctions between spin channels for the originally unoccupied states, i.e., . In this way, the electron and the hole are arranged in the same spin channel. As a result, the bands including the electron and hole are shifted closer in energy (electron-hole binding), while the other channel with the electron in the valence band (VB) increases its band gap. This is not seen in the triplet calculation itself. Due to this widening of the band gap, the second excitation of an electron in the VB is at higher energy.
In the changes of the absorbance, i.e., differential transmission in the long term limit, the transitions give rise to negative peaks. However, they are at much higher energy than the PA peaks measured experimentally. On the other hand, the shifts of the transitions in the excited state cause a reduction of the transient absorbance peaks at nm. The larger shift within the (6,5) SWNT system even leads to a small negative peak in the change in absorption. Overall, the (6,5) SWNT difference spectrum agrees qualitatively with that of ref 34, shown in Figure 3(b).
This is exactly the opposite from what we see in the experimental data obtained from the SWNT and the blended samples. There, we have no PA in the transient spectrum of the SWNT sample, but a more pronounced reduction of the peak at the higher energy end for the blended sample spectrum. To understand the origin of this discrepancy, we consider the role of charge carrier loading, i.e., addition and removal of electrons and holes, and peak broadening on the differential transmission spectra in the following sections.
3.5. Role of Charge Carrier Loading
We calculated the excited electron (blue) and hole (red) densities as the difference between the electron density in the ground state and triplet configuration, as shown in Figure 7.
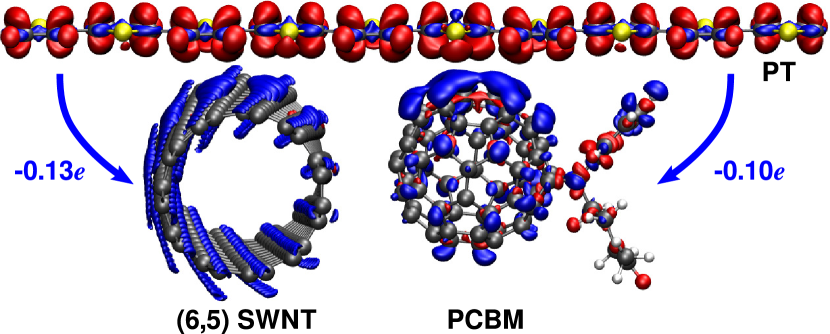
In this way we include all electron redistributions in the VB and CB. The difference in the densities reveals a hole located mainly on P3HT/PT, whereas the electron is predominantly on the (6,5) SWNT and the PCBM. This results in a net charge transfer of 0.23 electrons from the PT to its neighboring molecules. The amount of calculated charge transfer within the bulk system is in agreement with previous DFT results for P3HT/fullerene and P3HT/SWNT heterojunctions52, 53.
The charge transfer within the bulk system partially fills the hole in the excited state. This transfer of charge from PT into the (6,5) SWNT VBM stabilizes it, making the band gap widen less than in the isolated (6,5) SWNT system. Even though the transition is more intense, due to the additional electrons, the reduction of the PB peak at the high energy end is less pronounced due to the smaller shift .
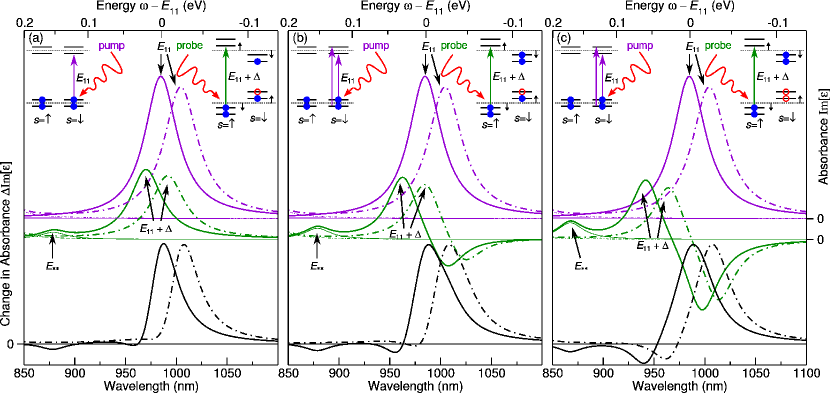
To determine how the amount of hole transfer from the SWNT and higher loading of charge carriers influences the shape of the transient spectrum at the transition of SWNT systems, we have increased the amount of charge carriers on the (6,5) and (7,5) SWNTs from 0.24 and 0.22 to 0.49 and 0.45 /nm, respectively. In Figure 8 we compare the change in TDDFT-RPA absorption (from eq 6 of Appendix A) of (6,5) and (7,5) SWNTs with (a) a single exciton, (b) a negative trion, i.e., a pair of excited electrons and a single hole, and (c) a pair of excitons. Unsurprisingly, with the addition of a second exciton, as shown in Figure 8(c), the widening of the band gap is significantly increased, resulting in a stronger PA peak at higher energy ( nm for the (6,5) SWNT). These results are consistent with the predominantly (6,5) SWNT measurements of ref 35 after a 1 ps pump-probe delay, as shown in Figure 3(d). There, the PA peak is at nm and even gains half of the intensity of the PB peak. Additionally, the existence of a second exciton within a 4 nm unit cell is quite reasonable, as compared to the calculated exciton size of nm 23. In Figure 8(b) one of the holes is filled, e.g., through charge transfer from P3HT to a SWNT, the PB peak becomes more asymmetric, and the PA peak becomes less intense. These results are more in agreement with the measurements after a 0.2 ps pump-probe delay of ref 34 shown in Figure 3(b). Overall, this suggests the strength of the PA peak, and the degree to which it is blue shifted from the PB peak , may be used as qualitative measures of the charge transfer and charge carrier load within SWNT systems.
Unfortunately, this still does not explain, why the blended P3HT/PCBM/SWNT sample has a more pronounced PA peak, since actually we would expect the opposite considering the amount of charge carriers, that is, the amount of hole, on the SWNT.
Comparing the calculated change in absorbance for (6,5) and (7,5) SWNTs in Figure 8, we find the (7,5) SWNT exhibits a less pronounced PA peak than the (6,5) SWNT for a single exciton, a negative trion, and a pair of excitons. In each case, the (7,5) SWNT excited state calculation gave a smaller gap widening than the (6,5) SWNT. More importantly, the (7,5) SWNT PA peak overlaps with the PB peak of the (6,5) SWNT. This suggests that for a mixture of (6,5) and (7,5) SWNTs, a PA peak will only be visible when excited electrons remain on the (6,5) SWNT.
3.6. Influence of PB Peak Width
It was already shown that the intensity and visibility of a PA peak decreases, if the broadening is too high 29. To see what happens with the width and the shape of the peak for different broadenings, we modeled the SWNT sample spectrum by combining the calculated (6,5) and (7,5) SWNT transient spectra for various broadenings .
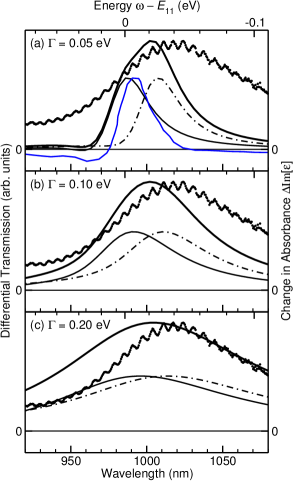
In Figure 9 the combined (6,5) and (7,5) SWNT differential transmission spectra for peak widths of 0.05, 0.1, and 0.2 eV for the ground state and excited state absorbance are shown. A peak width of 0.05 eV for the independent tube absorbances is in good agreement with the peak width of the transient spectrum of ref 34 (blue). A peak width of 0.05 eV is also consistent with the absorption FWHM of ref 35, shown in Figures 3(a). However, in comparison to the spectrum of our SWNT sample, the combined transient spectrum has a much smaller peak width and is shifted to higher energy. This suggests that the SWNT sample shows a significant contribution due to (7,5) SWNTs. Furthermore, the transient spectrum of ref 34 shows a clear asymmetry due to the reduction of the peak at the higher energy end, consistent with our TDDFT-RPA calculations. This asymmetry becomes less pronounced the greater the broadening of the transitions. A peak width of 0.2 eV results in a spectrum similar to our SWNT sample measurements. This is also consistent with the absorption FWHM of our SWNT mixture shown in Figure 3(a).
A broader peak width for the SWNT and blended P3HT/PCBM/SWNT samples compared to those in the literature35, 34, 49 might be due to haveing (6,5) and (7,5) SWNT mixture. Exciton transfer from the (6,5) to the (7,5) SWNT may be expected to occur, leading to electron-hole trapping on the (7,5) SWNT. Already, a 20% impurification can cause a decrease in power conversion efficiency of an OPV by more than 30 times due to electron-hole trapping 13. However, the peak width of the blended sample is significantly narrower than that of the SWNT system, as seen in Figure 3(a). The calculated energy differences between the excited (triplet) and ground states of the (6,5) SWNT and the bulk PT/PCBM/SWNT system suggest that an exciton within the bulk is more stable by about 0.08 eV. A potential source for the increased stability, and hence exciton lifetime, for the bulk system is electron and hole delocalization. This might explain the smaller width of the blended P3HT/PCBM/SWNT absorbance and resulting increase in visibilty of the PA peak.
4. CONCLUSIONS
Using linear response TDDFT-RPA calculations of the ground and excited states of (6,5) and (7,5) SWNTs, we are able to qualitatively explain the measured differential transmission spectra of the probed lowest energy excited state, the transition. Our results confirm that the observed PA peak is due to a blue shift of the transition after pumping. The PA peak is therefore an artifact of excitations within the spin channel, which experience a widening of the band gap after electron and hole stabilization within the other spin channel.
The intensity and the visibility of the PA peak depends on the charge carrier density, but mainly on the peak width. If the peak width is greater than the blue shift of the main absorption peak, the transient spectrum will be dominated by the PB peak29. Further, our SWNT sample contains a mixture of (6,5) and (7,5) SWNTs. This SWNT sample exhibits rather broad absorption peaks, approximately 4 times broader than previously measured (6,5) SWNT samples 34, 35. We suggest that this is related to having a mixture of SWNTs with similar energy gaps. The different types of SWNTs are causing an overlap of the peaks, but more importantly, the mixture enables an exciton transfer from the (6,5) to (7,5) SWNTs. This both shortens the exciton lifetime on the (6,5) SWNTs and inhibits a widening of the band gap. As a result, the differential transmission spectrum of the (6,5) SWNT has almost no PA peak.
For the blended P3HT/PCBM/SWNT sample, the exciton is locally stabilized on the (6,5) SWNT due to the hole transfer to the P3HT. As a result, the PA peak intensity and position in the differential transmission spectra may be used as a qualitative measure of exciton density and charge transfer within SWNT systems.
These results are important for the understanding of the origin of the PA peak in pump-probe spectroscopy and will help to interpret the exciton dynamics within SWNT systems.
Appendix A LCAO TDDFT-RPA
The optical absorption spectra are obtained via linear response time dependent (TD) density functional theory (DFT) within the random phase approximation (RPA)36, 37, 38, 39, 40, from the imaginary part of the macroscopic dielectric function, , as . In general, within linear response TDDFT-RPA36, 37, 38, the dielectric matrix in reciprocal space is given by
| (2) |
where G and are reciprocal lattice vectors, and is the noninteracting density–density response function, i.e., the susceptibility. This is given by
where is the electronic broadening, i.e., twice the inverse lifetime of the transitions, is the supercell volume, is the Fermi-Dirac occupation, is the eigenenergy, and is the KS wave function of the th band in spin channel at -point k.
For , in the limit , the matrix elements in (eq A) reduce to
| (4) |
Including local field effects, the absorption is obtained from (eq 2) by solving the Dyson equation
| (5) |
Neglecting local field effects, parallel to q, i.e., , . Substituting (eqs A and 4) into (eq 2), and suppressing -point dependence, we obtain the simplified form
| (6) |
where is a unit vector parallel to q. The matrix elements in (eq 6) may be expressed as
| (7) | |||||
where and are the pseudo and all-electron locally centered atomic orbitals (LCAOs) within the projector augmented wave (PAW) formalism with coefficients for the th KS wave function in spin channel , and PAW projectors
| (8) |
of the th pseudo KS wave function in spin channel onto the th LCAO orbital of atom .
In Figure 10
we compare the TDDFT-RPA spectra obtained within the LCAO basis (violet), and after projecting onto a real space grid (blue). The latter was calculated using the TDDFT-RPA implementation within the gpaw code 41, 42, 43 described in refs 37, 38 and 39 including 79 G vectors.
When local field effects (LFEs) are neglected, both codes agree up to a constant of proportionality. We attribute this difference to the projection of the LCAO basis functions onto the real space grid. When including LFEs, the absorbance perpendicular to the SWNT axis is greatly suppressed, while that along the axis is unchanged. However, this suppression of the perpendicular absorbance may be due to modeling debundled SWNTs51. In any case, we find the neglect of LFEs is justified for these systems, especially because our primary interest is the transition along the SWNT axis.
ASSOCIATED CONTENT
![[Uncaptioned image]](/html/1602.00010/assets/x12.png) Supporting Information
Supporting Information
The Supporting Information is available free of charge on the ACS Publications website at DOI: 10.1021/acs.jpcc.5b10025.
LCAO TDDFT-RPA source code (ZIP)
AUTHOR INFORMATION
Corresponding Author
*E-mail: duncan.mowbray@gmail.com.
Notes
The authors declare no competing financial interest.
ACKNOWLEDGMENTS
We acknowledge financial support from the European Projects POCAONTAS (FP7-PEOPLE-2012-ITN No. 316633), DYNamo (ERC-2010-AdG-267374), OLIMPIA (P7-PEOPLE-212-ITN No. 316832); Spanish Grants (FIS20113-46159-C3-1-P); Italian Grants (GGP12033); Grupos Consolidados UPV/EHU del Gobierno Vasco (IT-578-13); and computational time from the BSC Red Espanola de Supercomputacion.
REFERENCES
- Iijima 1991 Iijima, S. Helical Microtubules of Graphitic Carbon. Nature 1991, 354, 56–58
- Harris 1999 Harris, P. J. F. Carbon Nanotubes and Related Structures: New Materials for the Twenty-first Century; Cambridge University Press: Cambridge, 1999
- Dresselhaus et al. 2001 Dresselhaus, M. S., Dresselhaus, G., Avouris, P., Eds. Carbon Nanotubes: Synthesis, Structure, Properties, and Applications; Springer: Berlin, 2001
- Yao et al. 2000 Yao, Z.; Kane, C. L.; Dekker, C. High-Field Electrical Transport in Single-Wall Carbon Nanotubes. Phys. Rev. Lett. 2000, 84, 2941–2944
- Dürkop et al. 2004 Dürkop, T.; Getty, S. A.; Cobas, E.; Fuhrer, M. S. Extraordinary Mobility in Semiconducting Carbon Nanotubes. Nano Lett. 2004, 4, 35–39
- Martel et al. 1998 Martel, R.; Schmidt, T.; Shea, H. R.; Hertel, T.; Avouris, P. Single- and Multi-Wall Carbon Nanotube Field-Effect Transistors. Appl. Phys. Lett. 1998, 73, 2447–2449
- Bockrath et al. 2000 Bockrath, M.; Hone, J.; Zettl, A.; McEuen, P. L.; Rinzler, A. G.; Smalley, R. E. Chemical Doping of Individual Semiconducting Carbon-Nanotube Ropes. Phys. Rev. B: Condens. Matter Mater. Phys. 2000, 61, R10606–R10608
- Ferguson et al. 2013 Ferguson, A. J.; Blackburn, J. L.; Kopidakis, N. Fullerenes and Carbon Nanotubes as Acceptor Materials in Organic Photovoltaics. Mater. Lett. 2013, 90, 115–125
- Kymakis and Amaratunga 2002 Kymakis, E.; Amaratunga, G. A. J. Single-Wall Carbon Nanotube/Conjugated Polymer Photovoltaic Devices. Appl. Phys. Lett. 2002, 80, 112–114
- Kymakis et al. 2003 Kymakis, E.; Alexandrou, I.; Amaratunga, G. A. J. High Open-Circuit Voltage Photovoltaic Devices from Carbon-Nanotube-Polymer Composites. J. Appl. Phys. 2003, 93, 1764–1768
- Stich et al. 2014 Stich, D.; Späth, F.; Kraus, H.; Sperlich, A.; Dyakonov, V.; Hertel, T. Triplet-Triplet Exciton Dynamics in Single-Walled Carbon Nanotubes. Nat. Photonics 2014, 8, 1749–4885
- Holt et al. 2010 Holt, J. M.; Ferguson, A. J.; Kopidakis, N.; Larsen, B. A.; Bult, J.; Rumbles, G.; Blackburn, J. L. Prolonging Charge Separation in P3HT–SWNT Composites Using Highly Enriched Semiconducting Nanotubes. Nano Lett. 2010, 10, 4627–4633
- Jain et al. 2012 Jain, R. M.; Howden, R.; Tvrdy, K.; Shimizu, S.; Hilmer, A. J.; McNicholas, T. P.; Gleason, K. K.; Strano, M. S. Polymer-Free Near-Infrared Photovoltaics with Single Chirality (6,5) Semiconducting Carbon Nanotube Active Layers. Adv. Mater. 2012, 24, 4436–4439
- Bindl et al. 2013 Bindl, D. J.; Ferguson, A. J.; Wu, M.-Y.; Kopidakis, N.; Blackburn, J. L.; Arnold, M. S. Free Carrier Generation and Recombination in Polymer-Wrapped Semiconducting Carbon Nanotube Films and Heterojunctions. J. Phys. Chem. Lett. 2013, 4, 3550–3559
- Bindl and Arnold 2013 Bindl, D. J.; Arnold, M. S. Efficient Exciton Relaxation and Charge Generation in Nearly Monochiral (7,5) Carbon Nanotube/C60 Thin-Film Photovoltaics. J. Phys. Chem. C 2013, 117, 2390–2395
- Gomulya et al. 2013 Gomulya, W.; Gao, J.; Loi, M. A. Conjugated Polymer-Wrapped Carbon Nanotubes: Physical Properties and Device Applications. Eur. Phys. J. B 2013, 86, 404
- Ando 1997 Ando, T. Excitons in Carbon Nanotubes. J. Phys. Soc. Jpn. 1997, 66, 1066–1073
- Perebeinos et al. 2004 Perebeinos, V.; Tersoff, J.; Avouris, P. Scaling of Excitons in Carbon Nanotubes. Phys. Rev. Lett. 2004, 92, 257402
- Spataru et al. 2004 Spataru, C. D.; Ismail-Beigi, S.; Benedict, L. X.; Louie, S. G. Excitonic Effects and Optical Spectra of Single-Walled Carbon Nanotubes. Phys. Rev. Lett. 2004, 92, 077402
- Wang et al. 2005 Wang, F.; Dukovic, G.; Brus, L. E.; Heinz, T. F. The Optical Resonances in Carbon Nanotubes Arise from Excitons. Science 2005, 308, 838–841
- Maultzsch et al. 2005 Maultzsch, J.; Pomraenke, R.; Reich, S.; Chang, E.; Prezzi, D.; Ruini, A.; Molinari, E.; Strano, M. S.; Thomsen, C.; Lienau, C. Exciton Binding Energies in Carbon Nanotubes from Two-Photon Photoluminescence. Phys. Rev. B: Condens. Matter Mater. Phys. 2005, 72, 241402
- Spataru and Léonard 2010 Spataru, C. D.; Léonard, F. Tunable Band Gaps and Excitons in Doped Semiconducting Carbon Nanotubes Made Possible by Acoustic Plasmons. Phys. Rev. Lett. 2010, 104, 177402
- Lüer et al. 2009 Lüer, S., Larry ans Hoseinkhani; Polli, D.; Crochet, J.; Hertel, T.; Lanzani, G. Size and Mobility of Excitons in (6, 5) Carbon Nanotubes. Nat. Phys. 2009, 5, 54–58
- Greene et al. 1990 Greene, B. I.; Orenstein, J.; Schmitt-Rink, S. All-Optical Nonlinearities in Organics. Science 1990, 247, 679–687
- Manzoni et al. 2005 Manzoni, C.; Gambetta, A.; Menna, E.; Meneghetti, M.; Lanzani, G.; Cerullo, G. Intersubband Exciton Relaxation Dynamics in Single-Walled Carbon Nanotubes. Phys. Rev. Lett. 2005, 94, 207401
- Gambetta et al. 2006 Gambetta, A. et al. Real-time Observation of Nonlinear Coherent Phonon Dynamics in Single-Walled Carbon Nanotubes. Nat. Phys. 2006, 2, 515–520
- Lüer et al. 2009 Lüer, L.; Gadermaier, C.; Crochet, J.; Hertel, T.; Brida, D.; Lanzani, G. Coherent Phonon Dynamics in Semiconducting Carbon Nanotubes: A Quantitative Study of Electron-Phonon Coupling. Phys. Rev. Lett. 2009, 102, 127401
- Styers-Barnett et al. 2008 Styers-Barnett, D. J.; Ellison, S. P.; Mehl, B. P.; Westlake, B. C.; House, R. L.; Park, C.; Wise, K. E.; ; Papanikolas, J. M. Exciton Dynamics and Biexciton Formation in Single-Walled Carbon Nanotubes Studied with Femtosecond Transient Absorption Spectroscopy. J. Phys. Chem. C 2008, 112, 4507–4516
- Pedersen et al. 2005 Pedersen, T. G.; Pedersen, K.; Cornean, H. D.; Duclos, P. Stability and Signatures of Biexcitons in Carbon Nanotubes. Nano Lett. 2005, 5, 291–294
- Rønnow et al. 2010 Rønnow, T. F.; Pedersen, T. G.; Cornean, H. D. Correlation and Dimensional Effects of Trions in Carbon Nanotubes. Phys. Rev. B: Condens. Matter Mater. Phys. 2010, 81, 205446
- Hartleb et al. 2015 Hartleb, H.; Späth, F.; Hertel, T. Evidence for Strong Electronic Correlations in the Spectra of Gate-Doped Single-Wall Carbon Nanotubes. ACS Nano 2015, 9, 10461–10470
- Soavi et al. 2013 Soavi, G.; Scotognella, F.; Brida, D.; Hefner, T.; Späth, F.; Antognazza, M. R.; Hertel, T.; Lanzani, G.; Cerullo, G. Ultrafast Charge Photogeneration in Semiconducting Carbon Nanotubes. J. Phys. Chem. C 2013, 117, 10849–10855
- Soavi et al. 2015 Soavi, G.; Scotognella, F.; Viola, D.; Hefner, T.; Hertel, T.; Cerullo, G.; Lanzani, G. High Energetic Excitons in Carbon Nanotubes Directly Probe Charge-Carriers. Sci. Rep. 2015, 5, 9681
- Zhu et al. 2007 Zhu, Z.; Crochet, J.; Arnold, M. S.; Hersam, M. C.; Ulbricht, H.; Resasco, D.; Hertel, T. Pump-Probe Spectroscopy of Exciton Dynamics in (6,5) Carbon Nanotubes. J. Phys. Chem. C 2007, 111, 3831–3835
- Zi-Peng 2013 Zi-Peng, Z. Photo-Induced Absorption in the Pump Probe Spectroscopy of Single-Walled Carbon Nanotubes. Chin. Phys. B 2013, 22, 077803
- Onida et al. 2002 Onida, G.; Reining, L.; Rubio, A. Electronic Excitations: Density-Functional versus Many-Body Green’s-Function Approaches. Rev. Mod. Phys. 2002, 74, 601–659
- Yan et al. 2011 Yan, J.; Thygesen, K. S.; Jacobsen, K. W. Nonlocal Screening of Plasmons in Graphene by Semiconducting and Metallic Substrates: First-Principles Calculations. Phys. Rev. Lett. 2011, 106, 146803
- Yan et al. 2011 Yan, J.; Mortensen, J. J.; Jacobsen, K. W.; Thygesen, K. S. Linear Density Response Function in the Projector Augmented Wave Method: Applications to Solids, Surfaces, and Interfaces. Phys. Rev. B: Condens. Matter Mater. Phys. 2011, 83, 245122
- Mowbray 2014 Mowbray, D. J. Theoretical electron energy loss spectroscopy of isolated graphene. Phys. Status Solidi B 2014, 251, 2509–2514
- Glanzmann et al. 2014 Glanzmann, L. N.; Mowbray, D. J.; Rubio, A. PFO-BPy Solubilizers for SWNTs: Modelling Polymers from Oligomers. Phys. Status Solidi B 2014, 251, 2407–2412
- Mortensen et al. 2005 Mortensen, J. J.; Hansen, L. B.; Jacobsen, K. W. Real-Space Grid Implementation of the Projector Augmented Wave Method. Phys. Rev. B: Condens. Matter Mater. Phys. 2005, 71, 035109
- Enkovaara et al. 2010 Enkovaara, J. et al. Electronic Structure Calculations with GPAW: A Real-Space Implementation of the Projector Augmented-Wave Method. J. Phys.: Condens. Matter 2010, 22, 253202
- Larsen et al. 2009 Larsen, A. H.; Vanin, M.; Mortensen, J. J.; Thygesen, K. S.; Jacobsen, K. W. Localized Atomic Basis Set in the Projector Augmented Wave Method. Phys. Rev. B: Condens. Matter Mater. Phys. 2009, 80, 195112
- Perdew et al. 1996 Perdew, J. P.; Burke, K.; Ernzerhof, M. Generalized Gradient Approximation Made Simple. Phys. Rev. Lett. 1996, 77, 3865
- Bahn and Jacobsen 2002 Bahn, S. R.; Jacobsen, K. W. An Object-Oriented Scripting Interface to a Legacy Electronic Structure Code. Comput. Sci. Eng. 2002, 4, 56–66
- Namal et al. 2013 Namal, I.; Ozelcaglayan, A. C.; Udum, Y. A.; Toppare, L. Synthesis and Electrochemical Characterization of Fluorene and Benzimidazole Containing Novel Conjugated Polymers: Effect of Alkyl Chain Length on Electrochemical Properties. Euro. Poly. J. 2013, 49, 3181–3187
- Marchiori and Koehler 2014 Marchiori, C. F. N.; Koehler, M. Density Functional Theory Study of the Dipole Across the P3HT:PCBM Complex: The Role of Polarization and Charge Transfer. J. Phys. D: Appl. Phys. 2014, 47, 215104
- Cumings and Zettl 2005 Cumings, J.; Zettl, A. In Applied Physics of Carbon Nanotubes; Fundamentals of Theory, Optics, and Transport Devices; Rotkin, S. V., Subramoney, S., Eds.; Springer-Verlag: Berlin, 2005; pp 273–306
- Tao et al. 2009 Tao, S.; Miyata, Y.; Yanagi, K.; Kataura, H.; Okamoto, H. Subpicosecond Coherent Nonlinear Optical Response of Isolated Single-Walled Carbon Nanotubes. Phys. Rev. B: Condens. Matter Mater. Phys. 2009, 80, 201405
- Tu et al. 2009 Tu, X.; Manohar, S.; Jagota, A.; Zheng, M. DNA Sequence Motifs for Structure-Specific Recognition and Separation of Carbon Nanotubes. Nature 2009, 460, 250–253
- Kramberger et al. 2012 Kramberger, C.; Roth, F.; Schuster, R.; Kraus, R.; Knupfer, M.; Einarsson, E.; Maruyama, S.; Mowbray, D. J.; Rubio, A.; Pichler, T. Channeling of Charge Carrier Plasmons in Carbon Nanotubes. Phys. Rev. B: Condens. Matter Mater. Phys. 2012, 85, 085424
- Kanai and Grossman 2007 Kanai, Y.; Grossman, J. C. Insights on Interfacial Charge Transfer Across P3HT/Fullerene Photovoltaic Heterojunction from Ab Initio Calculations. Nano Lett. 2007, 7, 1967–1972
- Kanai and Grossman 2008 Kanai, Y.; Grossman, J. C. Role of Semiconducting and Metallic Tubes in P3HT/Carbon-Nanotube Photovoltaic Heterojunctions: Density Functional Theory Calculations. Nano Lett. 2008, 8, 908–912