A Swift view on IGR J19149+1036.
Abstract
IGR J19149+1036 is a high mass X-ray binary detected by INTEGRAL in 2011 in the hard X-ray domain. We have analyzed the BAT survey data of the first 103 months of the Swift mission detecting this source at a significance level of standard deviations. The timing analysis on the long term BAT light curve reveals the presence of a strong sinusoidal intensity modulation of d, that we interpret as the orbital period of this binary system.
A broad band (0.3-150 keV) spectral analysis was performed combining the BAT spectrum and the XRT spectra from the pointed follow up observations. The spectrum is adequately modeled with an absorbed power law with a high energy cutoff at keV and an absorption cyclotron feature at keV. Correcting for the gravitational redshift, the inferred magnetic field at the neutron star surface is gauss.
keywords:
X-rays: binaries – X-rays: individual: IGR J19149+1036 Facility: Swift1 Introduction
Since 2004 November, the Burst Alert Telescope (BAT, Barthelmy et al., 2005) on board the Swift observatory (Gehrels et al., 2004) has been scanning the entire sky in the hard X-ray domain (15–150 keV) recording timing and spectral information for any detected source (more than 1700 sources after 100 months of survey111http://bat.ifc.inaf.it). Thanks to its wide field of view and to the Swift pointing strategy, the BAT observes daily of the sky, and therefore it is specially fit for source variability studies. BAT has proved to be a valuable tool to detect transient phenomena from known and unknown sources (Krimm et al., 2013) and, by combining the entire data span, to reveal long periodicities of Galactic high mass X-ray binaries (HMXB, e.g. Corbet & Krimm, 2009; Corbet et al., 2010a, b, c, d, e; Corbet & Krimm, 2010; Cusumano et al., 2010, 2013a, 2013b; La Parola et al., 2010, 2013; Segreto et al., 2013a, b; D’Aì et al., 2011a).
In this paper we present a comprehensive temporal and spectral analysis of the Swift data collected on IGR J19149+1036. This source was detected by IBIS/ISGRI at a position consistent with the Einstein source 2E 1912.5+1031 (Pavan et al., 2011), although a firm association was not possible due to large systematic uncertainties related to the presence of GRS 1915+105 at a distance lower than . The source was also detected by JEM-X with a 3-10 keV X-ray flux of . The field around IGR J19149+1036 was observed by Swift/XRT several times. The analysis of the XRT data collected on 2010 Dec. 5 and 2011 Feb. 17, reported in Bozzo et al. (2011), allowed to estimate a refined source position at RA = 19h14m56.73s and Dec = +10deg 36’ 38.11” (J2000), with an associated uncertainty of 3.7 arcsec, that confirmed the association with 2E 1912.5+1031 suggested by Pavan et al. (2011). The XRT spectrum was modeled by an absorbed power-law with a column density N and a photon index , with an observed 1-10 keV X-ray flux of . 2MASS J19145680+1036387 (J=14.34, H=12.41, K=11.53), within the XRT error circle, is the most likely counterpart to IGR J19149+1036.
This paper is organized as follows. Section 2 describes the BAT and XRT data reduction. Section 3 reports on the timing analysis. Section 4 describes the broad band spectral analysis. In Section 5 we briefly discuss our results.
2 Observations and data reduction
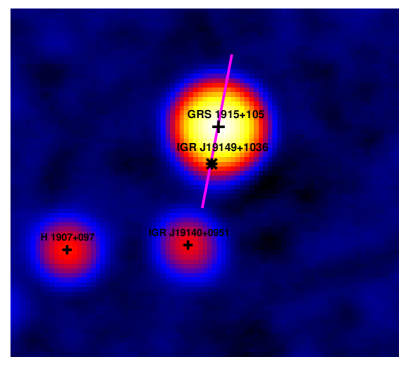
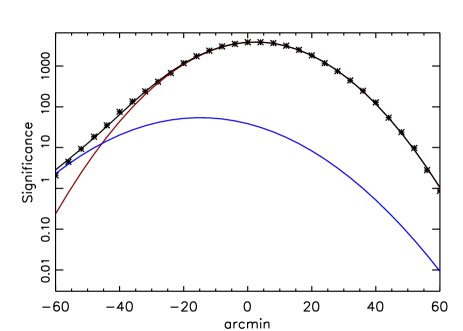
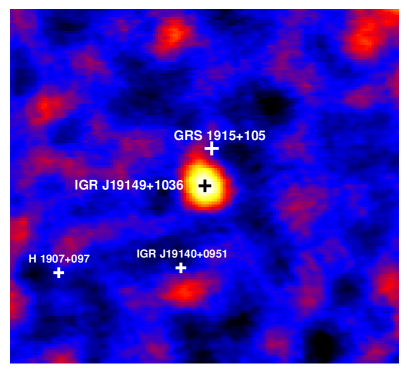
The results reported in this paper on IGR J19149+1036 derive from the analysis of the BAT survey data relevant to the first 103 months of the Swift mission. The data were retrieved from the Swift public archive222http://heasarc.gsfc.nasa.gov/cgi-bin/W3Browse/swift.pl in the form of detector plane histograms (DPH): three-dimensional arrays (two spatial dimensions, one spectral dimension) that collect count-rate data in 5-min time bins for 80 energy channels. We use a dedicated software (Segreto et al., 2010) to process these data, producing all-sky maps in several energy intervals between 15 and 150 keV, detecting sources on these maps and extracting, for each source, standard products such as light curves and spectra. Figure 1 (top panel) shows the 15-150 keV significance sky map (exposure time 39.4 Ms) in the direction of IGR J19149+1036. The source is close (20 arcmin) to the much brighter object GRS 1915+105: the positions of these two sources are marked with black crosses. In this map IGR J19149+1036 is not immediately detected because it is embedded in the PSF signal of the close brighter source. However, if we extract the values of the significance along the line that connects the optical position of the two surces (magenta line in top panel of Figure 1) we observe an asymmetric profile (Figure 1, central panel) that suggests the presence of a faint source (IGR J19149+1036) hidden by the PSF of the brighter one (GRS 1915+105). Indeed, the fit of this profile with a single Gaussian shows systematic residuals; conversely, the profile is well fitted with a double Gaussian. The best fit peaks of the two Gaussians correspond to the position of the two sources. In order to make IGR J19149+1036 emerge in the sky map, we perform on each DPH a subtraction of the expected illumination pattern from all the detected sources; from the resulting ”residual shadowgrams” we generate new survey ”residual maps” where any previously undetected source can emerge. IGR J19149+1036 was detected in the 15–150 keV all-sky ”residual map” (Fig. 1, bottom panel) with a signal to noise ratio of 28.6 standard deviations and of 31.7 standard deviations in the 15–60 keV all-sky map, where its signal-to-noise is maximized. The 15–60 keV energy band was used to extract the light curve with the maximum resolution ( s) allowed by the Swift-BAT survey data. For each time bin the contribution from GRS 1915+105 is subtracted. The time tag of each bin, defined as the central time of the bin interval, was corrected to the solar system barycenter (SSB) by using the task earth2sun. The background subtracted spectrum averaged over the entire survey period was extracted in 14 energy channels and analyzed using the BAT redistribution matrix available in the Swift calibration database333http://swift.gsfc.nasa.gov/docs/heasarc/caldb/swift/.
Swift-XRT (Burrows et al., 2004) observed the field around IGR J19149+1036 5 times after the discovery of the source by Integral. The source was always observed in Photon Counting (PC) mode (Hill et al., 2004) for a total exposure of 3800 s. The details on the five Swift-XRT observations are reported in Table 1. The XRT data were processed with standard procedures (xrtpipeline v.0.12.8) using the ftools in the heasoft package (v 6.15) and the products were extracted adopting a grade filtering of 0-12. The source events for timing and spectral analysis were extracted from a circular region of 20 pixel radius (1 pixel = 2.36”) centered on the source position as determined with xrtcentroid (RA= 19h14m56.8s and Dec = +10deg 36’ 39.1”, J2000), while the background was extracted from an annular region centered on the source, with an inner radius of 60 pixels and an outer radius of 90 pixels that avoids contamination due to the stray–light from GRS J1915+105 and to the PSF tail of IGR J19149+1036. All source event arrival times were converted to the SSB with the task barycorr444http://http://heasarc.gsfc.nasa.gov/ftools/caldb/help/barycorr.html. Ancillary response files were generated with xrtmkarf555http://heasarc.gsfc.nasa.gov/ftools/caldb/help/xrtmkarf.html. We also extracted a single source and a single background spectra from the 5 XRT observations and combined the relevant ancillary files using addarf, that weights them by the exposure times of the corresponding source spectra. Finally, the spectra were re-binned with a minimum of 20 counts per energy channel. This lower limit of counts per bin is enough to ensure that the deviation of the observed number of counts from the expected values approximates quite well a Gaussian distribution, that is a requirement to apply the statistics. We used the spectral redistribution matrix v014 and the spectral analysis was performed using xspec v.12.5.
Errors are at 90 % confidence level for a single parameter, if not stated otherwise.
| Obs # | Obs ID | Exposure | Rate | Orb. Phase | ||
|---|---|---|---|---|---|---|
| MJD | (s) | (s) | (c/s) | |||
| 1 | 00041130001 | 55535.220 | 29310.9 | 911.5 | 0.47 | |
| 2 | 00041130002 | 55609.162 | 46002.1 | 1261.2 | 0.79 | |
| 3 | 00041130003 | 56267.370 | 388.6 | 387.1 | 0.39 | |
| 4 | 00041130004 | 56631.147 | 52911.4 | 849.1 | 0.75 | |
| 5 | 00067133005 | 56632.625 | 403.6 | 402.0 | 0.81 |


3 Timing analysis and results
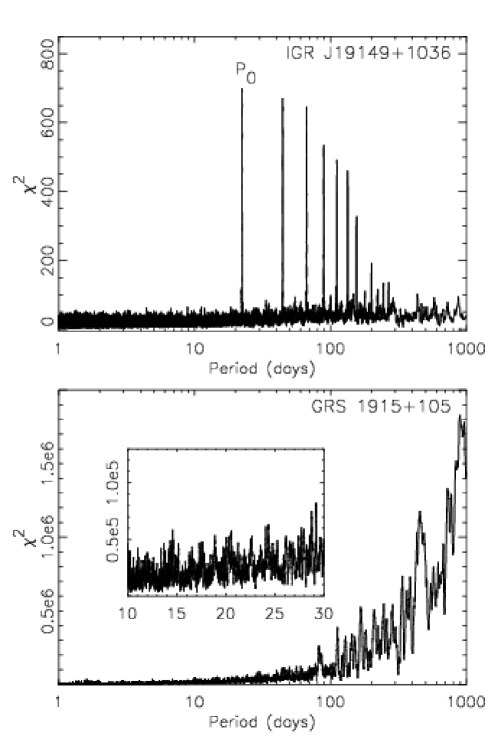
We produced the periodogram of the long term Swift-BAT 15–60 keV light curve applying a folding technique (Leahy et al., 1983) which consists in the production of a count rate profile at different trial periods by folding the photon arrival times in N phase bins and evaluating for each resulting profile the value with respect to the average count rate. A periodic modulation corresponds to a large value of . We searched in the 1–1000 d period range with a period spacing given by PT where P is the trial period, and T Ms is the data span length. The average rate in each profile phase bin was evaluated by weighting the rates with the inverse square of their statistical error. This procedure is mandatory for data collected by a large field of view coded mask telescope as BAT that are characterized by a large spread of statistical errors. The periodogram (Figure 2, top panel) shows the presence of several prominent features. The highest feature is at P d () where P0 and its error are the centroid and the standard deviation obtained by modeling this feature with a Gaussian function. Using the method described in Cusumano et al. (2013a) we find that the probability of finding such a high value by chance is . The other features clearly visible in the periodogram and showing decreasing peaks towards higher trial periods correspond to a series of multiples of P0. We verified that the detected periodicity is not present in the periodogram of GRS 1915+105 as shown in the bottom panel of Fig. 2.
The intensity profile (Fig. 3, top panel) folded at P0 with T MJD is characterized by a single symmetric peak with a minimum consistent with zero intensity. The minimum dip centroid, evaluated by fitting the data with a Gaussian function, falls at phase 1.06 0.01, corresponding to MJD P0. The peak centroid is at phase 0.56 0.01, corresponding to MJD P0 .
Figure 3 (bottom panel) shows the 103 months BAT light curve with a time resolution of P0 days. The source shows a quite persistent behaviour without any significant intensity enhancements, which is consistent with the very low level of red noise observed in the source periodogram shown in figure 3, top panel.
Table 1 lists the average count rate during each XRT observation and the relevant orbital phase evaluated with respect to P0 and Tepoch. We performed a timing analysis on the XRT data searching for the presence of a periodic modulation tied to the compact object rotation. In order to avoid systematics caused by the read-out time in PC mode (characterized by a time resolution bin of =2.5073 s), the arrival times of the events in PC mode were randomized within . Moreover, XRT observations are fragmented into snapshots of different duration and time separation that may introduce spurious features in the timing analysis. To avoid these systematics we performed a folding analysis on each snapshot with an exposure time higher than 500 s and with a statistical content larger than 100 counts, searching in a period range [ : 100] s. The periodograms obtained from snapshots belonging to the same observation were also summed together. We did not found significant features in any of the resulting periodograms.
4 Spectral Analysis
Because the XRT and BAT data are collected at different times and with different exposures, we verified that no significant spectral variability is present both among the five XRT observations and during the BAT monitoring. To this aim we produced hardness ratios of the source events in the energy bands 4–10 keV / 0.5–4 keV from each XRT observation and in the energy bands 35–150 keV / 15–35 keV for the BAT data. In both cases, no significant variability is observed.
In order to maximize the S/N ratio of the BAT data, we produced a spectrum selecting the data in the phase interval 0.3-0.8 (see Figure 3, top panel ). Then fitted the BAT spectrum and the XRT spectrum obtained from the entire XRT dataset using a common spectral model, including a multiplicative factor that is frozen to unity for the XRT spectrum and is left free to vary for the BAT spectrum, to account for any inter-calibration uncertainty between the two telescopes and/or for different average source intensity between the XRT and BAT observing times. The combined XRT-BAT spectrum (Fig. 4, top panel) was first modeled with an absorbed power law (model 1 cons*phabs*powerlaw) with a of 74.7 with 34 degrees of freedom (d.o.f.). We also tried to model the broad band spectrum including a cutoff in the model (model 2 cons*phabs*cutoffpl) obtaining a of 69.9 (33 d.o.f.). Both models result indeed unacceptable, with residuals (Fig. 4, middle panel) that show a broad range residual pattern both in the XRT and in the BAT data. We added to both models an absorption cyclotron line (cyclabs), obtaining a significant improvement in the (28.4, 30 d.o.f, with ) only for model 2 with a flat residual distribution (Fig. 4, bottom panel). Table 2 reports the spectral results of the best fitting model. To estimate the statistical significance of the presence of the cyclotron absorption feature we applied a Monte Carlo simulation on the BAT spectrum. The details of this procedure can be found in D’Aì et al. (2011b). We find that the probability of chance occurrence to find a value is .


| Parameter | Best fit value | Units |
|---|---|---|
| keV | ||
| ph at 1 keV | ||
| keV | ||
| keV | ||
| (0.3–10 keV) | erg s-1 cm-2 | |
| (15–150 keV) | erg s-1 cm-2 | |
| 28.4 (30 d.o.f.) |
5 Conclusions
We have analyzed the Swift-BAT and XRT data relevant to the HMXB IGR J19149+1036. The source is close (20 arcmin) to the much brighter source GRS 1915+105, and an ad hoc imaging analysis was necessary to reveal it in the BAT all sky map, where it emerges at a significance level of () standard deviations in the 15–150 keV (15–60 keV) band after 103 months of the Swift mission. The timing analysis on the long term BAT light curve unveils the presence of a periodic modulation in the hard X-ray emission with a period of P days. We interpret this modulation as the orbital period of the binary system. The folded light curve is characterized by a single symmetric peak with a roughly sinusoidal shape that shows a minimum consistent with zero intensity, lasting per cent of the orbital period. Such a long minimum intensity phase interval is difficult to explain with a full eclipse of the compact object, unless we speculate that the system has both an extremely eccentric orbit and a high inclination angle. An alternative explanation is that the modulation is caused by the passage of the compact source through the stellar wind, whose density decreases as the source approaches the orbit apastron. However, no definite conclusion on the geometry of the binary system can be drawn, without knowing the spectral type of the companion star.
The broad band spectrum cannot be adequately described by the standard continua used for HMXB, because of the presence of an absorption feature within the BAT energy range. We obtain a good description of the data introducing a cyclotron line in the cutoff power law model. The energy of the cutoff is keV and the line is centered at E keV. The presence of absorption cyclotron lines has been revealed in several HMXB. They are thought to be originated near the magnetic poles of the neutron star due to resonant scattering processes of the X-rays by electrons whose kinetic energies are quantized in discrete Landau energy levels perpendicular to the B-field (Schönherr et al., 2007). Their energy centroid is related to the intensity of the magnetic field of the neutron star:
| (1) |
If the cyclotron absorption takes place near the poles of the neutron star the observed resonance energy shall be corrected by the effect of the gravitational redshift: = with
| (2) |
Using standard parameters for the neutron star (, cm), the magnetic field at the neutron star surface would be B Gauss. This result is fully consistent with the distribution of the magnetic field values derived for neutron stars in binary systems, that peaks in the range G (Makishima et al., 1999).
Acknowledgments
This work has been supported by ASI grant I/011/07/0.
References
- Barthelmy et al. (2005) Barthelmy, S. D., et al. 2005, Space Science Reviews, 120, 143
- Bozzo et al. (2011) Bozzo, E., Ferrigno, C., Pavan, L., Walter, R., & Stella, L. 2011, The Astronomer’s Telegram, 3326, 1
- Burrows et al. (2004) Burrows, D. N., Hill, J. E., Nousek, J. A., et al. 2004, SPIE, 5165, 201
- Corbet & Krimm (2009) Corbet, R. H. D., & Krimm, H. A. 2009, The Astronomer’s Telegram, 2008, 1
- Corbet et al. (2010a) Corbet, R. H. D., Krimm, H. A., & Skinner, G. K. 2010, The Astronomer’s Telegram, 2559, 1
- Corbet et al. (2010b) Corbet, R. H. D., Krimm, H. A., Barthelmy, S. D., et al. 2010, The Astronomer’s Telegram, 2570, 1
- Corbet et al. (2010c) Corbet, R. H. D., Barthelmy, S. D., Baumgartner, W. H., et al. 2010, The Astronomer’s Telegram, 2588, 1
- Corbet et al. (2010d) Corbet, R. H. D., Barthelmy, S. D., Baumgartner, W. H., et al. 2010, The Astronomer’s Telegram, 2598, 1
- Corbet et al. (2010e) Corbet, R. H. D., Barthelmy, S. D., Baumgartner, W. H., et al. 2010, The Astronomer’s Telegram, 2599, 1
- Corbet & Krimm (2010) Corbet, R. H. D., & Krimm, H. A. 2010, The Astronomer’s Telegram, 3079, 1
- Corbet (1986) Corbet, R. H. D., 1986, MNRAS, 220, 1047
- Cusumano et al. (2010) Cusumano, G., La Parola, V., Romano, P., et al. 2010, MNRAS, 406, L16
- Cusumano et al. (2013a) Cusumano, G., Segreto, A., La Parola, V., et al. 2013, MNRAS, 436, L74
- Cusumano et al. (2013b) Cusumano, G., Segreto, A., La Parola, V., et al. 2013, ApJL, 775, L25
- D’Aì et al. (2011a) D’Aì, A., La Parola, V., Cusumano, G., et al. 2011, A&A, 529, A30
- D’Aì et al. (2011b) D’Aì, A., Cusumano, G., La Parola, V., et al. 2011, A&A, 532, A73
- Dickey & Lockman (1990) Dickey, J. M., & Lockman, F. J. 1990, ARAA, 28, 215
- Gehrels et al. (2004) Gehrels, N., et al. 2004, ApJ, 611, 1005
- Kennea et al. (2005) Kennea J. A., Burrows D. N., Nousek J. A., Chester M., Roming P., Barthelmy S., Gehrels N., Beckmann V., Soldi S., 2005, ATEL 459
- Krimm et al. (2013) Krimm, H. A., Holland, S. T., Corbet, R. H. D., et al. 2013, ApJS, 209, 14
- Hill et al. (2004) Hill, J. E., Burrows, D. N., Nousek, J. A., et al. 2004, SPIE, 5165, 217
- La Parola et al. (2013) La Parola, V., Cusumano, G., Segreto, A., et al. 2013, ApJL, 775, L24
- La Parola et al. (2010) La Parola, V., Cusumano, G., Romano, P., et al. 2010, MNRAS, 405, L66
- Leahy et al. (1983) Leahy, D. A., Elsner, R. F., & Weisskopf, M. C. 1983, ApJ, 272, 256
- Makishima et al. (1999) Makishima, K., Mihara, T., Nagase, F., & Tanaka, Y. 1999, ApJ, 525, 978
- Pavan et al. (2011) Pavan, L., Bozzo, E., Ferrigno, C., et al. 2011, A&A, 526, A122
- Segreto et al. (2010) Segreto, A., Cusumano, G., Ferrigno, C., La Parola, V., Mangano, V., Mineo, T., & Romano, P. 2010, A&A, 510, A47
- Segreto et al. (2013a) Segreto, A., La Parola, V., Cusumano, G., et al. 2013, A&A, 558, A99
- Segreto et al. (2013b) Segreto, A., Cusumano, G., La Parola, V., et al. 2013, A&A, 557, A113
- Schönherr et al. (2007) Schönherr, G., Wilms, J., Kretschmar, P., et al. 2007, A&A, 472, 353