Observational signatures of past mass-exchange episodes in massive binaries : The case of HD 149 404††thanks: Based on observations collected at the European Southern Observatory (La Silla, Chile) and with the International Ultraviolet Explorer. The reduced spectra are only available at the CDS via anonymous ftp to cdsarc.u-strasbg.fr (130.79.128.5) or via http://cdsarc.u-strasbg.fr/viz-bin/qcat?J/A+A/542/A95.
Abstract
Context. Mass and momentum exchanges in close massive binaries play an important role in their evolution, and produce several observational signatures such as asynchronous rotation and altered chemical compositions, that remain after the stars detach again.
Aims. We investigated these effects for the detached massive O-star binary HD 149 404 (O7.5 If + ON9.7 I, P = 9.81 days), which is thought to have experienced a past episode of case A Roche-lobe overflow (RLOF).
Methods. Using phase-resolved spectroscopy, we performed the disentangling of the optical spectra of the two stars. The reconstructed primary and secondary spectra were then analysed with the CMFGEN model atmosphere code to determine stellar parameters, such as the effective temperatures and surface gravities, and to constrain the chemical composition of the components. We complemented the optical study with the study of IUE spectra, which we compare to the synthetic binary spectra. The properties of the stars were compared to evolutionary models.
Results. We confirmed a strong overabundance in nitrogen () for the secondary and a slight nitrogen overabundance () for the primary star. Comparing the two stars, we found evidence for asynchronous rotation, with a rotational period ratio of .
Conclusions. The hypothesis of a past case A RLOF interaction in HD 149 404 is most plausible to explain its chemical abundances and rotational asynchronicity. Some of the observed properties, such as the abundance pattern, are clearly a challenge for current case A binary evolution models, however.
Key Words.:
Stars: early-type – binaries: spectroscopic – Stars: fundamental parameters – Stars: massive – Stars: individual: HD 149 4041 Introduction
As shown in recent studies (e.g. Sana et al. Sana (2012)), a large portion of massive stars belongs to binary or higher multiplicity systems. Whilst this multiplicity permits observationally determining the minimum masses of the stars through their orbital motion, it also leads to complications. For instance, the binarity of massive stars can result in interactions between their stellar winds that produce observational signatures throughout the electromagnetic spectrum (e.g. Rauw Leuven (2013)). Moreover, during the lifetime of a massive binary, the binarity influences the evolution of the stars in various ways (e.g. Langer Langer1 (2012)). These evolutionary effects range from tidally induced rotational mixing (e.g. de Mink et al. deMink (2009)) over exchange of matter and angular momentum through a Roche lobe overflow (RLOF) interaction (e.g. Podsiadlowski et al. Podsiadlowski (1992), de Loore & Vanbeveren dLV (1994), Wellstein et al. Wellstein (2001), Hurley et al. Hurley (2002)) to the merging of both stars (e.g. Podsiadlowski et al. Podsiadlowski (1992), Wellstein et al. Wellstein (2001)). In RLOF interactions, three different situations are distinguished: case A, for which the RLOF episode occurs when the mass-donor is on the core-hydrogen burning main-sequence; case B, when the star is in the hydrogen-shell burning phase; and case C, for which the star is in the helium-shell burning phase (Kippenhahn & Weigert KW (1967), Vanbeveren et al. VDLVR (1998)). These binary interactions significantly affect the physical properties of the components and their subsequent evolution. Despite considerable progresses in theoretical models, there remain a number of open questions such as the actual efficiency of accretion (e.g. Wellstein et al. Wellstein (2001), de Mink et al. deMink1 (2007), Dray & Tout DT (2007)). To better understand this phenomenon, we need in-depth studies of systems undergoing or having undergone mass exchange.
In this context, HD 149 404 is an interesting target. It is a detached, non-eclipsing O-star binary, member of the Ara OB1 association, located at a distance of 1.3 0.1 kpc (Herbst & Havlen Herbst (1977)). The orbital parameters were revised by Rauw et al. (Rauw (2001)). These authors found an orbital period of 9.81 days and a circular orbit. They also estimated an orbital inclination of 21° by comparing “typical” masses of supergiants with similar spectral types to those of both components. The spectrum of HD 149 404 displays variable emission lines (He ii 4686, H) that are likely indicative of a wind-wind interaction (Rauw et al. Rauw (2001), Thaller et al. Thaller (2001), Nazé et al. Naze (2002)). One of its components was assigned an ON spectral type, which suggests a significant nitrogen enrichment of its atmosphere.
In this study, we determine the fundamental parameters of the stars of this system through several analysis techniques. The data used in our study are presented in Sect. 2. In Sect. 3 we present the preparatory treatment of our data, which included disentangling the spectra of the binary system to reconstruct individual spectra of the binary components, which are needed for the subsequent spectral analysis. The spectral analyses were made with the non-LTE model atmosphere code CMFGEN and are presented in Sect. 4. In Sect. 5 we discuss the evolutionary state of HD 149 404 and compare it with similar systems.
2 Observational data
The optical spectra analysed here are the échelle spectra used by Rauw et al. (Rauw (2001)) in their study of the orbital solution and wind interactions of HD 149 404. These data were collected in May 1999 and February 2000 with the FEROS and Coralie spectrographs mounted on the ESO 1.5 m telescope and 1.2 m Euler Swiss telescope at La Silla, respectively. The FEROS and Coralie spectrographs have resolving powers of 48 000 and 50 000 and cover the wavelength ranges 3650 – 9200 Å and 3875 – 6800 Å, respectively. Further details on the instrumentation and the data reduction are given by Rauw et al. (Rauw (2001)). Because of some problems with the extraction of the FEROS data of May 2000, the normalization of the latter was more uncertain, and we therefore excluded these data from the disentengling procedure, and thus from the further analysis.
To complement our optical data, we also retrieved 25 short-wavelength, high-resolution (SWP) IUE spectra of HD 149 404 from the IUE archives. These spectra were previously described by Stickland & Koch (Stickland (1996)).
Table 1 yields the journal of observations along with the orbital phases computed according to the ephemerides of Rauw et al. (Rauw (2001), their He i 4471 orbital solution). The optical spectra provide a good sampling of the orbital cycle, which is important for the disentangling in Sect. 3.
| Optical spectroscopy | ||
|---|---|---|
| HJD-2 450 000 | Inst. | |
| 1299.796 | FEROS | 0.24 |
| 1300.788 | FEROS | 0.34 |
| 1301.792 | FEROS | 0.45 |
| 1302.783 | FEROS | 0.55 |
| 1304.792 | FEROS | 0.75 |
| 1578.866 | Coralie | 0.68 |
| 1579.879 | Coralie | 0.78 |
| 1580.872 | Coralie | 0.88 |
| 1581.864 | Coralie | 0.98 |
| 1582.869 | Coralie | 0.09 |
| 1583.877 | Coralie | 0.19 |
| 1584.857 | Coralie | 0.29 |
| 1585.845 | Coralie | 0.39 |
| 1586.870 | Coralie | 0.49 |
| 1587.861 | Coralie | 0.59 |
| 1588.886 | Coralie | 0.70 |
| 1590.886 | Coralie | 0.90 |
| IUE SWP spectroscopy | |||
|---|---|---|---|
| JD-2 440 000 | JD-2 440 000 | ||
| 3718.044 | 0.76 | 4450.176 | 0.35 |
| 3724.588 | 0.42 | 4460.090 | 0.36 |
| 3776.869 | 0.75 | 9564.333 | 0.42 |
| 3776.921 | 0.76 | 9565.329 | 0.52 |
| 3776.966 | 0.76 | 9817.595 | 0.23 |
| 3793.028 | 0.40 | 9818.630 | 0.33 |
| 3798.965 | 0.00 | 9840.402 | 0.55 |
| 3926.010 | 0.95 | 9910.425 | 0.68 |
| 4001.156 | 0.60 | 9911.396 | 0.78 |
| 4001.203 | 0.61 | 9912.400 | 0.88 |
| 4120.089 | 0.72 | 9913.396 | 0.99 |
| 4129.216 | 0.65 | 9915.391 | 0.19 |
| 4412.327 | 0.50 | ||
3 Preparatory analysis
3.1 Spectral disentangling
The previous determination of the orbital solution of the system performed by Rauw et al. (Rauw (2001)) allowed us to recover the individual spectra of both components by separating the normalized spectra of the binary system. For this purpose, we used our disentangling routine (Rauw DSc (2007)), which is based on the method of González & Levato (GL (2006)) and was previously used by Linder et al. (Linder (2008)) and improved by Mahy et al. (Mahy (2012)). The basic idea behind this technique is that the most natural way to handle spectra for radial velocity measurements is to express them as a function of instead of as a function of . In this way, the Doppler shift for a line of rest wavelength can be expressed as
Let and be the spectra of the primary and secondary in the heliocentric frame of reference. In the absence of line profile variability and eclipses, the spectrum observed at any phase can be written as
where and are the radial velocities of stars A and B at orbital phase .
For a total of observed spectra, the spectrum of the primary can be computed as the average of the observed spectra from which the secondary spectrum shifted by the appropriate radial velocity (RV) has been subtracted (González & Levato GL (2006)) :
And similarly for the secondary:
Starting from an initial approximation for (a flat spectrum), and , we then iteratively determined the primary and secondary spectra and their radial velocities (see González & Levato GL (2006)). For the separations we performed here, we fixed the radial velocities of the binary components to those corresponding to the orbital solution of Rauw et al. (Rauw (2001)).
As for any disentangling method, this technique also has its limitations (González & Levato GL (2006)). A reasonable observational sampling of the orbital cycle is needed because the quality of the results depends on the radial velocity (RV) ranges covered by these observations. Another important limitation is that broad spectral features are not recovered with the same accuracy as narrow ones. This is the case for the wings of the Balmer lines, but it also holds for the UV features that arise in the stellar winds, such as P-Cygni profiles. For instance, for the IUE spectra of HD 149 404, the Si iv 1393-1403 and N iv 1718 P-Cygni lines are very broad and barely vary during the orbital cycle. It was therefore impossible to properly separate the primary and secondary contributions for these lines. In practice, features that are wider than a few times the RV amplitude are barely recovered. Moreover, small residual errors in the normalization of the input spectra can lead to oscillations of the continuum in the resulting separated spectra on wavelength scales of several dozen Å. Finally, spectral disentangling works on continuum-normalized spectra and does not yield the brightness ratio of the stars, which must be determined by other techniques (see below).
Finally, in the specific case of HD 149 404, several emission lines (H and He II 4686, for example) do not seem to arise in the atmosphere of either component, but are formed at least partly in the wind-wind interaction zone (Rauw et al. Rauw (2001), Thaller et al. Thaller (2001), Nazé et al. Naze (2002)). As a result, the disentangling code is unable to meaningfully reconstruct these lines in the spectra of the components. We need to keep this in mind when analysing the reconstructed spectra.
3.2 Spectral types
Based on the reconstructed individual line spectra of the primary and secondary components, we determined the spectral types of the stars by measuring the equivalent width ratio of the spectral lines He i 4471 and He ii 4542 on the one hand, and Si iv 4088 and He i 4143, on the other hand. We applied Conti’s quantitative classification criteria for O-type stars (Conti & Alschuler CA (1971), Conti & Frost CF (1977), see also van der Hucht vdHucht (1996)) for both spectral types and luminosity classes to determine that the primary star is an O7.5 If star, while the secondary is an ON9.7 I111In the literature on interacting binaries, the terminologies “primary” and “secondary” usually designate the initially more massive star and less massive star, respectively. However, in accordance with previous studies of the HD 149 404 system, in the present paper the terms “primary” and “secondary” star refer to the currently more massive and less massive component, respectively.. Since our classification is based on the separated spectra, it is less sensitive to a possible phase-dependence of the line strengths and should thus be more robust than a classification based on spectra that are only collected near quadrature phase, as done by Rauw et al. (Rauw (2001)). However, in this particular case, we find an excellent agreement with the classification (O7.5 I(f) + ON9.7 I) proposed by these authors.
3.3 Brightness ratio
Spectral disentangling yields the strength of the lines in the primary and secondary stars relative to the combined continuum, but does not allow establishing the relative strengths of the continua. To further analyse the separated spectra, we therefore need to first establish the brightness ratio of the stars.
To estimate the optical brightness ratio of the components of HD 149 404, we measured the equivalent widths of a number of spectral lines on the separated spectra of the primary and secondary, but referring to the combined continuum of the two stars. The results are listed in Table 2 along with the mean equivalent widths of the same lines in synthetic spectra of stars of the same spectral type, computed with the non-LTE model atmosphere code CMFGEN (Hillier & Miller HM (1998)), which we describe in Sect. 4.2. For comparison, we also list the mean equivalent widths of the same lines in spectra of stars of the same spectral type as evaluated from the measurements of Conti (Conti1 (1973, 1974)) and Conti & Alschuler (CA (1971)).
| Line | Equivalent Width (Å) | ||||||
|---|---|---|---|---|---|---|---|
| Observations | Synthetic spectra | Conti (Conti1 (1973, 1974)) | |||||
| Primary | Secondary | O7.5 | O9.7 | O7.5 | O9.5 | ||
| He i 4026 | 0.19 | 0.34 | 0.72 | 0.74 | 0.65 | 0.80 | 0.57 |
| Si iv 4089 | 0.12 | 0.34 | 0.32 | 0.56 | 0.25 | 0.53 | 0.61 |
| Si iv 4116 | 0.06 | 0.24 | 0.11 | 0.29 | 0.12 | 0.37 | 0.66 |
| He ii 4200 | 0.11 | 0.08 | 0.47 | 0.21 | 0.42 | 0.23 | 0.61 |
| H | 0.45 | 0.50 | 1.77 | 1.74 | 1.88 | 2.09 | 0.88 |
| He i 4471 | 0.17 | 0.37 | 0.55 | 0.69 | 0.71 | 0.97 | 0.58 |
| He ii 4542 | 0.17 | 0.07 | 0.53 | 0.21 | 0.64 | 0.25 | 0.96 |
The brightness ratio of the two stars can then be evaluated from
.
By combining our measurements with those from synthetic spectra, we derive an optical brightness ratio of in this way, which is slightly lower than the value found by Rauw et al. (Rauw (2001)), who inferred . As a consistency check, we also determined the brightness ratio by comparison with Conti’s measurements and obtained . The difference between the results obtained based on synthetic spectra versus Conti’s measurements arises at least partially because Conti (Conti1 (1973, 1974)) did not take into account the spectral type O9.7, but instead considered an O9.5 spectral type, consisting of both classes of stars currently known as O9.5 and O9.7.
Reed (Reed (2003)) reported a mean magnitude of 5.48 0.02 and colour of for the system. Since the intrinsic of an O7.5 or O9.5 star is (Martins & Plez MP (2006)), the extinction can be calculated as being , assuming . Assuming the 1.3 0.1 kpc distance (Wolk et al. Wolk (2008)), we infer an absolute for the binary. A brightness ratio of then yields individual absolute magnitudes of and .
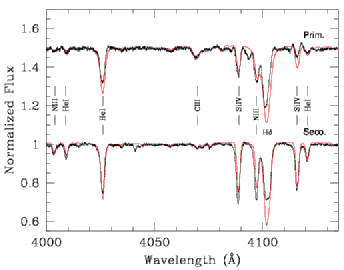
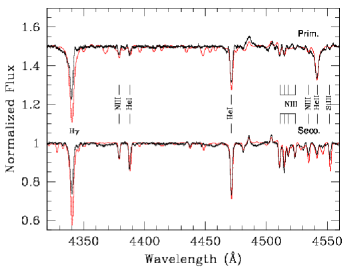
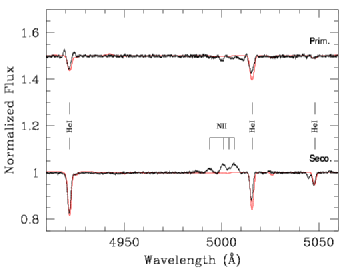
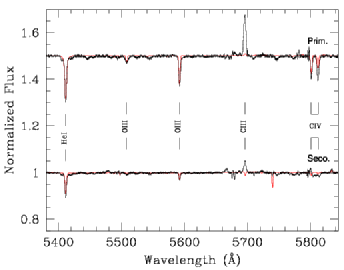
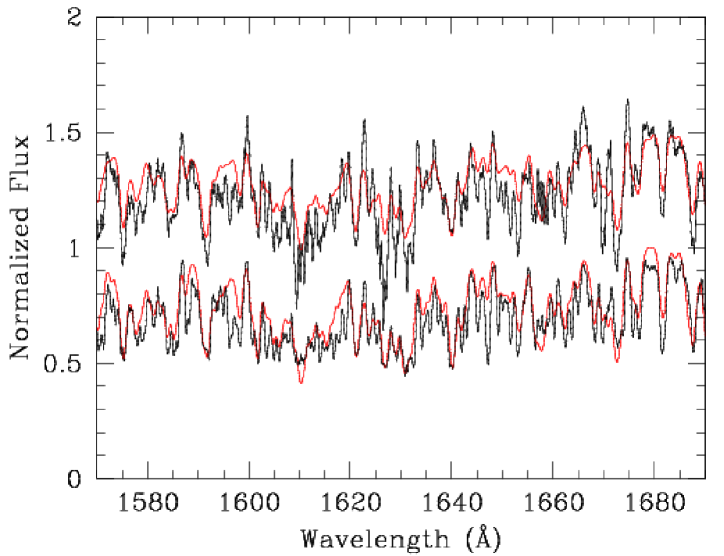
The separated continuum-normalized primary and secondary optical spectra are shown in Fig. 1.
4 Spectral analysis
4.1 Rotational velocities and macroturbulence
After applying a Fourier transform method (Simón-Díaz & Herrero Simon-Diaz (2007), Gray Gray (2008)) to the profiles of the He i 4026, 4922, 5016, O iii 5592, and C iv 5812 lines of the separated spectra, we determined the projected rotational velocities of the stars of the system. We selected these lines because they are very well isolated in the spectra and are therefore expected to be free of blends. The results are presented in Table 3. The mean of the primary star is km s-1, while that of the secondary is km s-1.
| Line | Primary | Secondary |
|---|---|---|
| He i 4026 | 97 | 75 |
| He i 4922 | 94 | 64 |
| He i 5016 | 105 | 58 |
| O iii 5592 | 87 | 55 |
| C iv 5812 | 82 | - |
| Mean value | 93 8 | 63 8 |
Macroturbulence is defined as a non-thermal motion in the stellar atmosphere in which the size of the turbulent cell is greater than the mean free-path of the photons. The main effect of the macroturbulence is an additional broadening of the spectral lines. This effect has received much attention over recent years (e.g. Simón-Díaz & Herrero Simon-Diaz-1 (2014)). A first approximation of the macroturbulence velocities is obtained by applying the radial-tangential anisotropic macroturbulent broadening formulation of Gray (Gray (2008)) on the spectra after including rotational velocity broadening. We used the auxiliary program MACTURB of the stellar spectral synthesis program SPECTRUM v2.76 developed by Gray (macturb (2010)). We applied this technique to the lines He i 4026, 4471, and 5016, and He ii 4542. In this way, we obtained macroturbulence velocities of 70 and 80 km s-1 for the primary and secondary stars, respectively. Although this is quite high, these numbers are consistent with measurements of Simón-Díaz & Herrero (Simon-Diaz-1 (2014)) that were made on stars of similar spectral types.
Both rotational and macroturbulence velocities were applied on the synthetic spectra (see Sect. 4.2) before comparing the latter with the separated spectra.
4.2 CMFGEN code
To determine the fundamental properties of the components of HD 149 404, we used the non-LTE model atmosphere code CMFGEN (Hillier & Miller HM (1998)). This code solves the equations of radiative transfer and statistical equilibrium in the co-moving frame for plane-parallel or spherical geometries for Wolf-Rayet stars, O stars, luminous blue variables, and supernovae. CMFGEN furthermore accounts for line blanketing and its effect on the energy distribution. The hydrodynamical structure of the stellar atmosphere is specified as an input to CMFGEN. For the stellar wind, a law is used to describe the velocity law. In the resolution of the equations of statistical equilibrium, a super-level approach is adopted. The following chemical elements and their ions are included in the calculations: H, He, C, N, O, Ne, Mg, Al, Si, S, Ca, Fe, and Ni. The solution of the equations of statistical equilibrium is used to compute a new photospheric structure, which is then connected to the same wind velocity law. The radiative transfer equations are solved based on the structure of the atmosphere, with a microturbulent velocity varying linearly with velocity from 10 km s-1 in the photosphere to × v∞ at the outer boundary, and generated synthetic spectra are compared to the separated spectra.
As a first approximation, we assumed that gravity, stellar mass, radius, and luminosity are either assumed equal to typical values of stars of the same spectral type (Martins et al. Martins2 (2005)) or adopted from the study of Rauw et al. (Rauw (2001)). The mass-loss rates and parameters were taken from Muijres et al. (Muijres (2012)) for the spectral types of both stars, whilst the wind terminal velocity was set equal to 2450 km s-1 (Howarth et al. Howarth (1997)) for the two components.
4.3 Method
The first step was to adjust the temperature in the stellar models. The temperatures were mostly determined through the relative strengths of the He i 4471 and He ii 4542 lines (Martins Martins (2011)). The final values are 34 000 and 28 000 K for the primary and secondary stars. Both results agree reasonably well with the temperatures expected for supergiants of these spectral types (Martins et al. Martins2 (2005)).
Subsequently, the natural steps to follow would be adjusting the surface gravities, the mass-loss rate, and the clumping factor, but the binarity of the studied system causes some problems. Indeed, since the wings of broad lines are not properly restored by the disentangling, it is impossible to use the Balmer lines to constrain the surface gravity. And since the H and H lines are in addition strongly affected by extra emission from the wind-wind interaction (Rauw et al. Rauw (2001), Thaller et al. Thaller (2001), Nazé et al. Naze (2002)), they cannot be used as diagnostics of the mass-loss rate and clumping factor. The mass-loss rates were therefore fixed to the values tabulated by Muijres et al. (Muijres (2012)) for stars of the same spectral type (see their Table 1, method A). The clumping formalism used in the CMFGEN model is
with a filling factor of 0.1, a clumping velocity factor of 100 kms-1 , and V(r) the velocity of the wind.
We used an iterative process to constrain the luminosities and surface gravities. The first estimate of was taken from Martins et al. (Martins2 (2005)) following the spectral types of the stars. Combined with our determination of the effective temperatures, we then inferred the bolometric corrections (Lanz & Hubeny LH (2003)). This in turn yielded the individual bolometric luminosities, using the absolute magnitudes of the components derived in Sect. 3.3.
These bolometric luminosities and the effective temperatures were used to compute the ratio of the stellar radii . Together with the assumed gravities, this ratio yields the spectroscopic mass ratio , which was then compared to the dynamical mass ratio inferred from the orbital solution (Rauw et al. Rauw (2001)). The difference in these mass ratios was used to produce a new estimate of the surface gravities, and this iterative process was repeated until the spectroscopic and dynamical mass ratios agreed with each other and the CMFGEN synthetic spectra produced for the new gravity values matched the observations as well as possible.
After the fundamental stellar parameters were established or fixed, we investigated the CNO abundances through the strengths of the associated lines. We performed a normalized analysis to determine the best fit to selected lines (Martins et al. Martins3 (2015)). The normalization consists in dividing the by its value at minimum, . As a 1 uncertainty on the abundances, we then considered abundances up to a of 2.0, that is, an approximation for 1 over , as suggested by Martins et al. (Martins3 (2015)). We used the C iii 4068-70, C ii 4267, C iii 5826, N iii 4004, N iii 4511-15-18-24, N ii 5026, O iii 5508, and O iii 5592 lines to adjust the C, N, and O abundances of the primary star. For the secondary star, the same lines were used for the N and O abundances, but the only line used for the C abundance was C iii 4068-70. Two methods were used to determine the of each line. First, we compared the depth of the observed and synthetic line cores in the calculation. Second, we determined the mean for every independent point of the full profile of each considered line. The two methods gave similar results. After testing the influence of the errors on projected rotational velocities on the determination of the surface abundances, we found that their effect was small compared to the 1 uncertainties on the measured abundances as determined here above. We therefore neglected them.
4.4 Results
Figure 1 illustrates the best fit of the optical spectra of the primary and secondary stars obtained with CMFGEN. In Table 4 we present the stellar parameters determined compared to those derived by Rauw et al. (Rauw (2001)). In general, these two works agree well. Table 4 compares the chemical abundances of these best-fit models with solar abundances taken from Asplund et al. (Asplund (2009)).
Figure 1 shows that the He lines and the C iii 4068-70 lines are very well reproduced for both stars. The C iii 5696 line cannot be considered in the determination of the surface C abundance since its formation process depends on a number of fine details of atomic physics and of the modelling (Martins & Hillier MH (2012)). Most of the N lines also are very well adjusted. The N ii emission lines around 5000 Å in the primary spectrum may be due to emission in the interaction zone, as they are well present in the observed spectrum and not represented in the modelled spectrum. The case of oxygen is more problematic. Whilst O iii 5592 is well adjusted, several other O iii lines are present in the synthetic CMFGEN spectra (e.g. O iii 4368, 4396, 4448, 4454, and 4458), but they are barely visible in the separated spectra. We checked that these lines are also absent from the original observed binary spectra. Their absence is thus by no means an artefact that is due to the treatment of our data.
| This study | Rauw et al. (Rauw (2001)) | |||
|---|---|---|---|---|
| Prim. | Sec. | Prim. | Sec. | |
| (R⊙) | ||||
| (M⊙) | ||||
| ( K) | ||||
| log () | ||||
| (cgs) | ||||
| 1.03 (f) | 1.08 (f) | |||
| (km s-1) | 2450 (f) | 2450 (f) | ||
| (M⊙ yr | (f) | (f) | ||
| BC | ||||
| Primary | Secondary | Sun | |
|---|---|---|---|
| He/H | 0.1 | 0.1 | 0.089 |
| C/H | |||
| N/H | |||
| O/H |
We stress two interesting results from our spectral analysis. First of all, we confirm the large overabundance of N in the secondary spectrum. Second, we infer an asynchronous rotation of the two stars. The radii determined with CMFGEN (Table 4), the mean projected rotational velocities (Table 1), and the inclination estimate from Rauw et al. (Rauw (2001)) yield the rotation periods of the primary and secondary stars: 3.77 0.32 days and 7.46 0.95 days, respectively, or a period ratio of . We note that within the uncertainties on the inclination, the secondary rotational period is similar to the orbital period of the system (9.81 days).We return to these points in Sect. 5. Finally, we note that according to the radii determined here, none of the stars currently fills its Roche lobe. With the formula of Eggleton (Eggleton (1983)), we estimate a Roche-lobe volume filling factor of 15% for the primary and 73% for the secondary.
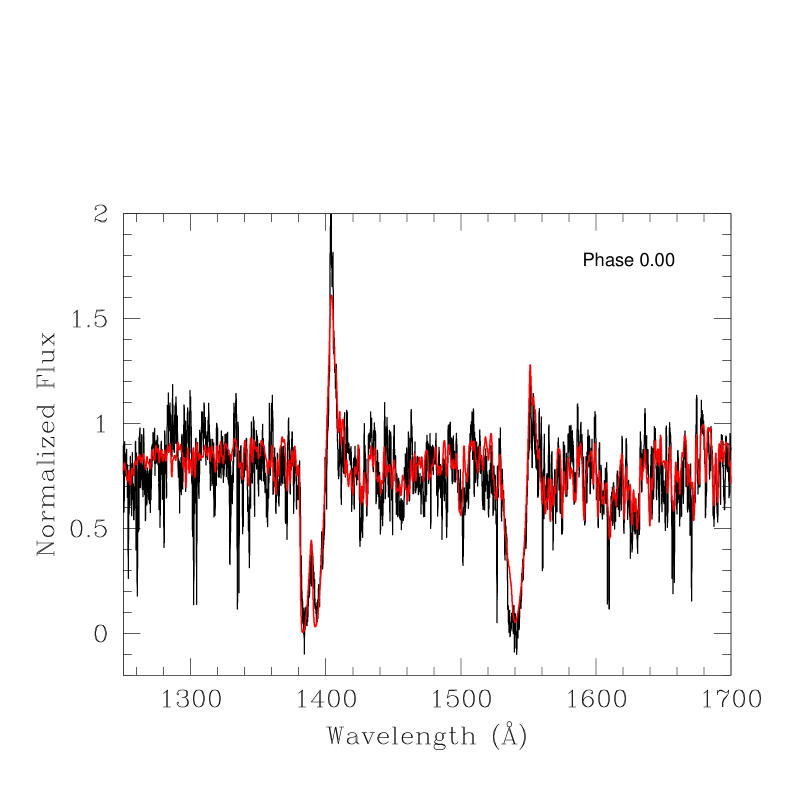
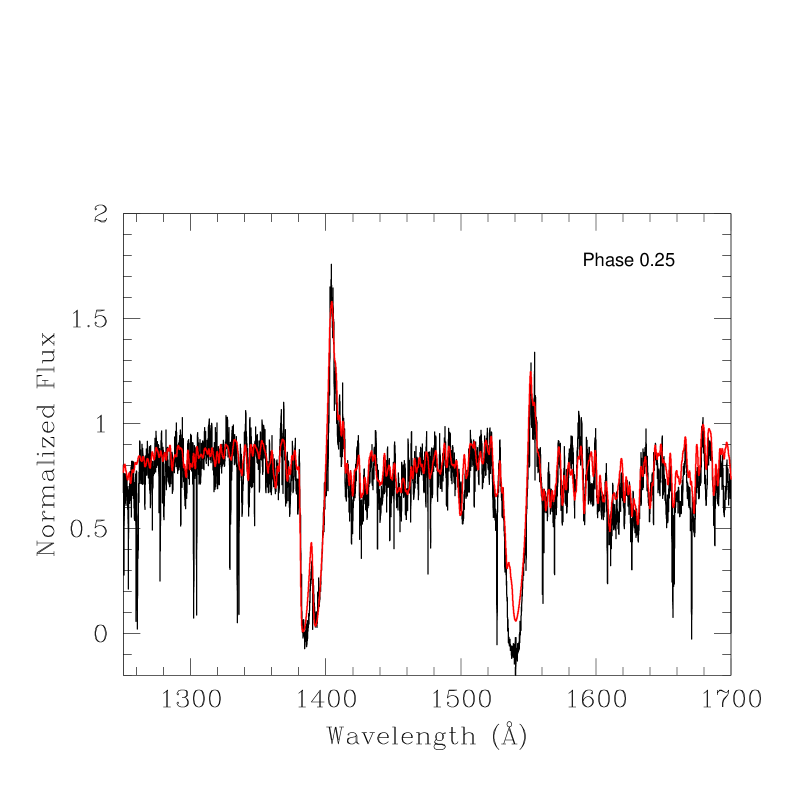
As pointed out above, disentangling the IUE spectra of HD 149 404 was more problematic, especially for those parts of the UV spectra that feature strong and broad wind lines and/or are polluted by blends with numerous interstellar features. The left panel of Fig. 2 illustrates the comparison of the separated spectra and the synthetic spectra obtained with CMFGEN over a wavelength range that is relatively free of interstellar lines and mainly hosts photospheric lines. The agreement is clearly quite reasonable.
To check whether our CMFGEN models are also able to correctly reproduce the wind features, we re-combined the synthetic CMFGEN UV spectra of the primary and secondary taking into account the radial velocity shifts at the time of the observations. We did so for several orbital phases. The right panel of Fig. 2 illustrates the result for three selected IUE spectra (SWP03008, JD 2 443 798.965, SWP02755, JD 2 443 776.869, and SWP54350, JD 2 449 817.595), corresponding to conjunction phase 0.00 and quadrature phases 0.75 and 0.25. The synthetic spectrum clearly agrees well with the observation, except for a few narrow absorptions that are due to the interstellar medium, which are not taken into account in our model. This additionally supports our determination of the physical parameters of the system components. Moreover, the concordance between the synthetic and observed UV spectra suggests that the P-Cygni profiles form over parts of the stellar winds that are not significantly affected by the wind-wind interactions, the latter leading to a loss of spherical symmetry of the line formation region.
The fluxed CMFGEN spectra also allow us to estimate the brightness ratio (primary/secondary) in the UV. We find a value of 0.91555This result is at odds with the 0.7 magnitude difference (i.e. primary/secondary brightness ratio of 1.91) between the primary and secondary UV fluxes inferred by Howarth et al. (Howarth (1997)). This situation most likely stems from the differences in the spectral types adopted by Howarth et al. (Howarth (1997)), who classified the system as O8.5 I + O7 III, whilst we have derived O7.5 If + ON9.7 I. This difference in spectral types directly affects the strength of the cross-correlation peaks of the spectra of the two components with the template spectrum of Sco (B0.2 IV) and thus the correction on the magnitude difference inferred by Howarth et al. (Howarth (1997))..
Furthermore, we found relatively little variability of the P-Cygni profiles over the orbital period. Both observations (lack of strong variability and little effect of wind interaction on the line morphology) are likely due to the low orbital inclination () of the system. This inclination implies that the observed spectrum arises mostly at high stellar latitudes, where the wind-wind interaction zone has less influence on the wind structure.

5 Discussion and conclusion
5.1 Evolutionary status
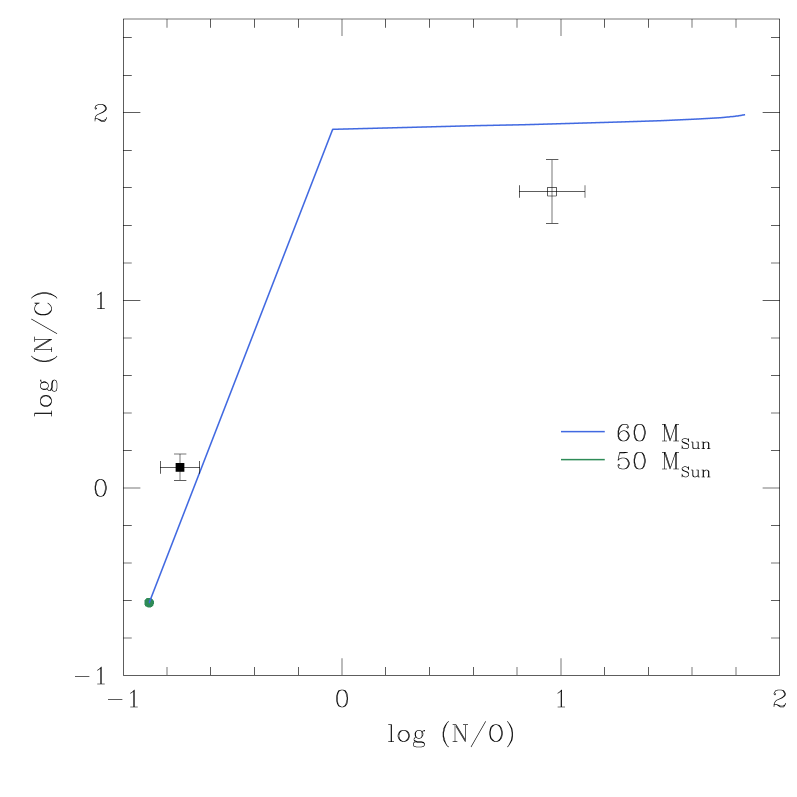
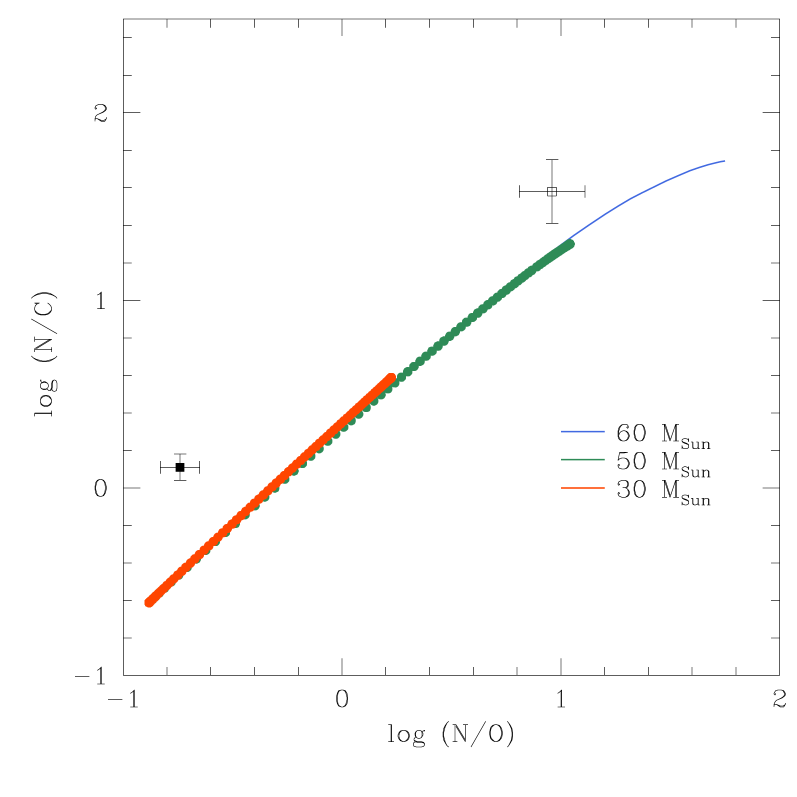
As we have shown in the previous section, the spectra of the components of HD 149 404 display the signatures of some enrichment by the products of stellar nucleosynthesis processes. These properties indicate a previous mass-exchange episode. Figure 3 compares our inferred N/C and N/O ratios with the predictions for the evolution of single massive stars (Ekström et al. Ekstrom (2012)) either without rotation (left panel) or with a rotational velocity of (right panel). This figure clearly shows that for the spectroscopic masses of the primary and secondary stars these models cannot account for the observed CNO abundance patterns. For instance, in the case of models without rotation (left-hand panel of Fig. 3), no chemical enrichment is expected during the main-sequence evolution for stars with mass M⊙. Only for the M model is the loss of material through stellar wind sufficient to reveal the products of the CNO cycle at the surface before the end of the main-sequence evolution. Adopting instead the rotating models (right-hand panel of Fig. 3), the enrichment of the secondary can only be explained by single-star evolution if we assume at least a star with 60 M⊙ , whilst the spectroscopic mass is about a factor two lower. When the surface abundances of a single star of 60 M⊙ initial mass reach the values observed for the secondary of HD 149 404, the current mass of the star is still about 50 M⊙, that is, it is much higher than the mass determined for the secondary star.
The observed CNO abundance pattern is qualitatively much easier to interpret if the present-day secondary star was formerly the more massive component of the binary and transferred mass and angular momentum to the present-day primary in an RLOF episode. During this process, the outer envelope of the secondary was removed, revealing layers of material that were previously inside the convective hydrogen-burning core (Vanbeveren Vanbeveren1 (1982, 2011)).
We start by comparing our results with theoretical predictions from the literature. The expectation is that the more mass has been lost by the donor, the deeper the layers that are revealed at the surface and thus the higher the N/C ratio. The predicted CNO abundances for the mass loser after a case B mass-transfer episode are and (Vanbeveren Vanbeveren1 (1982)). This is indeed close to what we observe in our analysis. Moreover, the RLOF scenario is re-enforced by the values of the primary star abundances. Classical radiative equilibrium evolutionary models predict normal H and He abundances for the mass gainer of an RLOF episode, but an N abundance of two to three times solar (Vanbeveren & de Loore VdL (1994)), which agrees with our results.
There are some caveats here, however. First, the results of Vanbeveren (Vanbeveren1 (1982)) apply to case B mass transfer, whereas HD 149 404 is more likely to have undergone a case A mass exchange (see below). Second, when the outer hydrogen-rich layers are removed, an enrichment of the stellar surface of the mass donor in helium is expected. Our spectral modelling was made with the He abundance set to solar, however, and there is no hint for our models requiring a He enhancement in any of the stars. Although the predicted relative change of helium surface abundance is usually much smaller than for N, this result is nonetheless surprising, especially in view of the large N overabundance of the secondary star.
To illustrate the helium enrichment that might be expected, we consider once more the single-star evolutionary tracks with rotation of Ekström et al. (Ekstrom (2012)). In these models, a nitrogen surface abundance similar to the one observed for the secondary is always accompanied by an increase of the surface helium abundance to values higher than by mass. The fact that the spectrum of the secondary of HD 149 404 can be fit with a solar helium abundance () suggests that the internal structure of the secondary before the onset of mass transfer must have been different from that expected from single-star evolutionary models. Moreover, the RLOF in HD 149 404 must have come to a (temporary) stop before the full hydrogen-rich envelope of the mass donor was removed. The latter conclusion is also supported by our finding that both stars are currently well inside their Roche lobes.
Given the present-day spectroscopic masses, the secondary must have lost at least 9.3 M⊙ assuming a fully conservative mass transfer. Conservative RLOF will increase the period of the binary. If we assume a fully conservative mass transfer and apply the formula of Vanbeveren et al. (VDLVR (1998)), we find that the orbital period would have increased by 17% at most, the shortest possible initial orbital period being 8.4 days for a mass exchange of 9.3 M⊙. However, Petrovic et al. (Petrovic (2005)) argued that in fast case A RLOF, only about 15 – 20% of the mass shed by the mass donor is indeed accreted by its companion. If the mass-transfer efficiency is that low, then the secondary must have lost a much larger amount of mass. Such a non-conservative mass transfer can result from the transfer of angular momentum. In fact, the mass gainer can be spun up to critical rotation and will then repel additional mass (and angular momentum), leading to a non-conservative mass transfer (e.g. Langer et al. Langer (2003), Vanbeveren Vanbeveren (2011), Langer Langer1 (2012)). In the previous section, we noted that the components of the system are apparently not in synchronous rotation. This asynchronicity therefore also suggests the existence of a past mass and angular momentum transfer episode, with a clear spin up of the primary star.
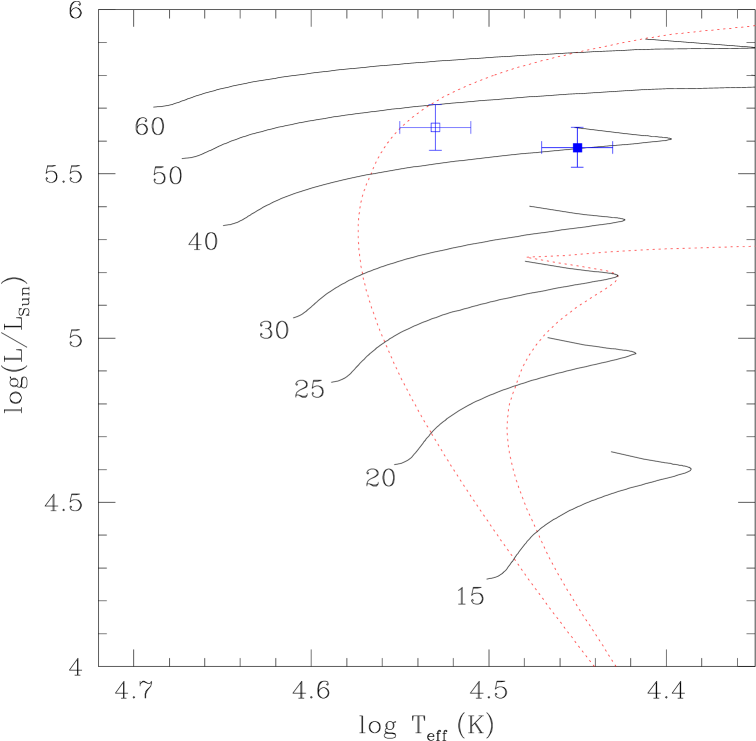
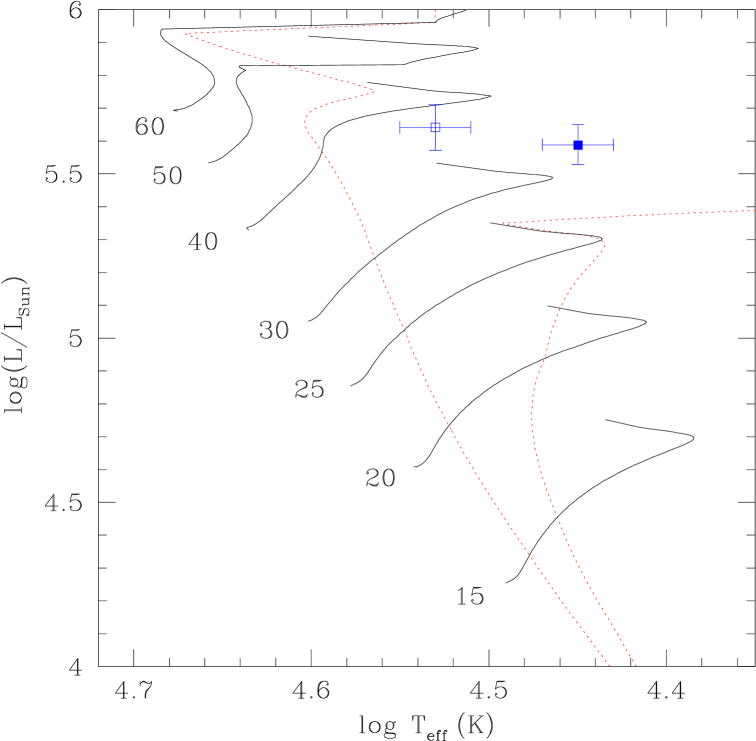
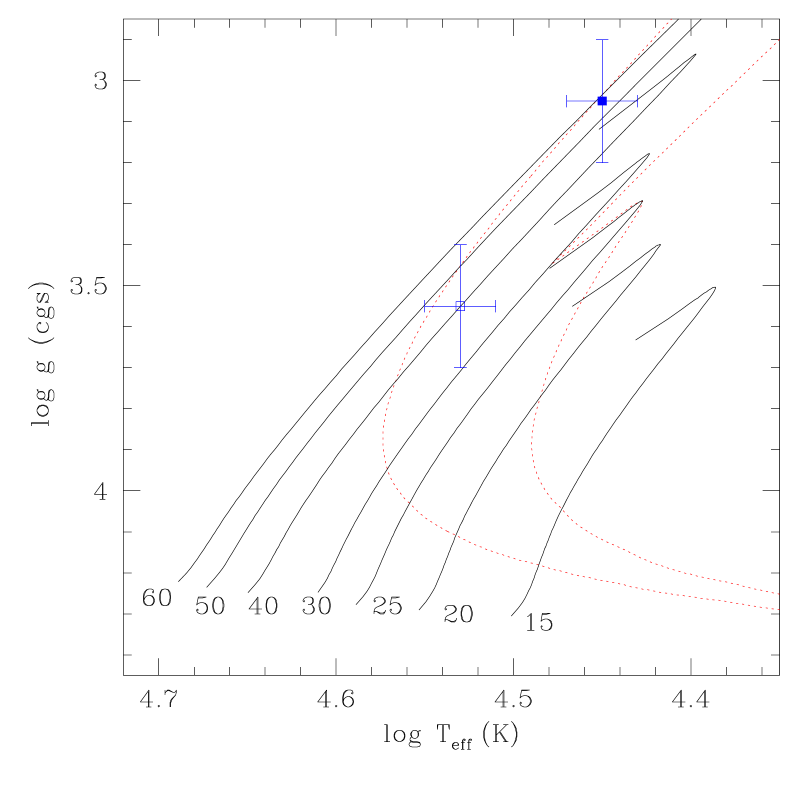
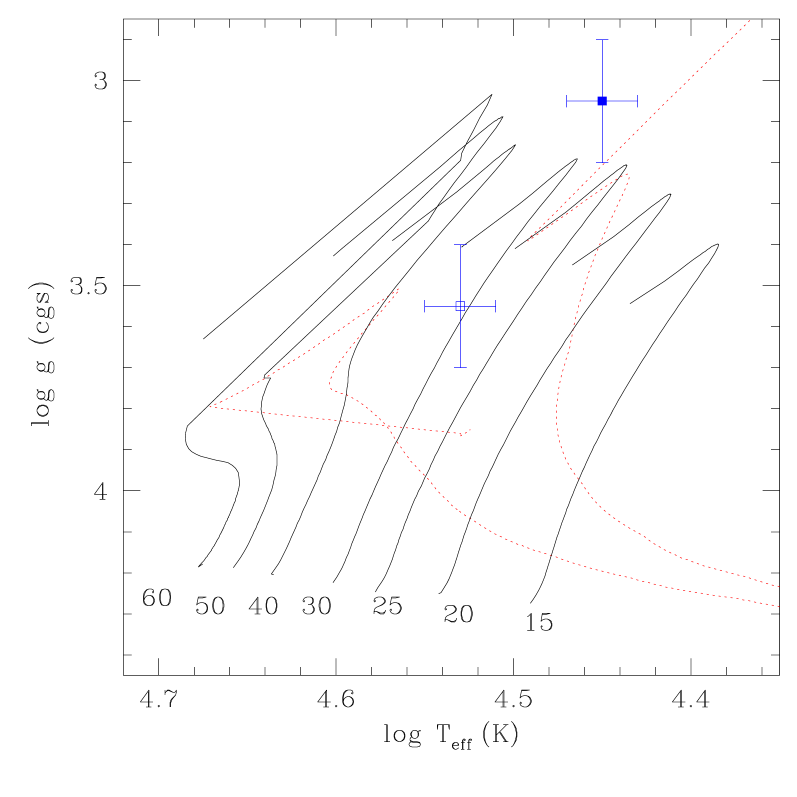
In Fig. 4 we present the positions of the primary and secondary stars in the Hertzsprung-Russell diagram (HRD) (upper panels) and in the log g-log diagram (lower panels), along with the evolutionary tracks from Ekström et al. (Ekstrom (2012)) for the core-hydrogen burning phase of single stars at solar metallicity, both for non-rotating (left panels) and rotating (right panels) stars. This figure again illustrates the failure of single-star evolutionary tracks to account for the properties of the components of HD 149 404. If we consider the models without rotational mixing, the position of the primary star in the HRD is relatively close to the track corresponding to its present-day spectroscopic mass. However, the secondary appears too luminous for its present-day mass compared to these evolutionary tracks. If we compare the stars to the 40% critical rotation case, we find that the primary’s luminosity is below that expected for its present-day spectroscopic mass. Moreover, the secondary lies outside the range covered by tracks in the core-hydrogen burning phase. If we consider the non-rotating case, we see that in the log g-log diagram the primary star has a lower effective temperature and a higher surface gravity than expected for a 50 M⊙ star, whilst the secondary star displays parameters corresponding to stars twice as massive as its present-day spectroscopic mass. For stars rotating at 40% of their critical velocity, we find that both stars would have initial masses of about 30 M⊙. The primary dynamical mass is about a factor 2 higher, while for the secondary the agreement is good. Finally, in all cases (with and without rotation and for both diagrams), the two components of HD 149 404 are not located on the same isochrone, although they would be expected to have the same age666The age of the Ara OB1 association of which HD 149 404 is a member was estimated in the literature as Myr (Wolk et al. Wolk (2008))..
In a mass-transfer episode, the location of both stars in the HRD after the RLOF strongly depends on the details of the process. For instance, spinning-up the mass gainer can lead to almost complete mixing of the latter. In this situation, models predict that He would be enhanced in the atmosphere of the mass gainer and that the latter would become bluer and overluminous for its mass (Vanbeveren & de Loore VdL (1994)). If there is no strong spin-up and the accretion occurs rather slowly and is accompanied by a fast diffusion process, then the location of the gainer in the HRD should be very close to that of a normal star of the same mass and chemical composition (Vanbeveren et al. VDLVR (1998)). The star is rejuvenated, however: it lies on an isochrone that corresponds to a younger age than its actual age. The location of the primary in the HRD suggests that in the present case the second scenario is likely to apply with a very moderate rejuvenation, if any, of the primary. This conclusion is supported by the lack of a strong He enrichment, but it is at odds with the highly non-synchronous rotation of the primary reported above.
5.2 Comparison with other post-RLOF systems
In this section, we briefly compare the properties of HD 149 404
with those of two other O-type binaries, Plaskett’s Star and LZ Cephei,
which are probably in a post-case A RLOF evolutionary stage and have
been analysed in a way similar to the present work (Linder et al. Linder (2008),
Mahy et al. Mahy1 (2011)).
Plaskett’s Star (HD 47 129) is an O8 III/I + O7.5 III binary
with an orbital period of 14.4 days, slightly longer than that of
HD 149 404, and a mass ratio near unity. Two observational facts
suggest that the initially more massive primary has undergone a case
A RLOF episode in the past (Linder et al. Linder (2008)). First,
the projected rotational velocity of the secondary star is remarkably
high (mean value of km s-1) compared to
that of the primary (mean value of km s-1).
This strongly asynchronous rotation likely stems from a spin-up of
the secondary star through a recent transfer of angular momentum from
the primary star. Second, the primary star displays nitrogen overabundance
(N/N) and carbon depletion (C/C),
as is typical of an advanced evolutionary stage, whilst no such nitrogen
enrichment is seen in the secondary spectrum777The apparent N underabundance of the secondary inferred by Linder
et al. (Linder (2008)) could be an artefact that is due to the
relatively shallow nitrogen lines of the secondary being washed out
by its fast rotation and the difficulties of properly normalizing
echelle spectra with such broad and shallow features (see also Fig. 1
of Palate & Rauw PR (2014)).. Given the present-day configuration of HD 47 129, it seems that
the transfer of angular momentum and the resulting spin-up of the
mass gainer (the secondary in this case) might have prevented accretion
of a larger portion of the primary’s mass.
LZ Cephei (HD 209 481) is an O9 III + ON9.7 V binary with
a short orbital period of 3.07 days (Kameswara Rao Rao (1972))
and a mass ratio (primary/secondary) of 2.53 (Mahy et al. Mahy1 (2011)).
Both components of LZ Cep almost fill their Roche lobe (Mahy et
al. Mahy1 (2011), Palate et al. PRM (2013)). Mahy et al. (Mahy1 (2011))
found that the secondary displays a strong nitrogen enrichment (18
times solar), carbon and oxygen depletion (0.1 times solar), and a
high helium content (4 times solar), suggesting a very advanced state
of evolution. On the other hand, the primary displays only slightly
altered surface abundances consistent with single-star evolution.
This suggests that the mass transfer was strongly non-conservative.
Mahy et al. (Mahy1 (2011)) noted a slight asynchronicity of the
rotation periods of the order of 10-20 %, but concluded that the
system is probably on the verge of achieving synchronization. Comparison
with single-star evolutionary tracks indicates a similar age discrepancy
as we have found here for HD 149 404. The evolutionary masses (
and M⊙, for the primary and secondary
respectively) are significantly higher than their dynamical masses
( and M⊙ respectively, Mahy et
al. Mahy1 (2011), Palate et al. PRM (2013)).
Although our sample is currently too limited to draw firm conclusions, the above comparison reveals several interesting results that are worth studying in more detail with a larger sample. First, we note that in all three systems, the components appear either over- or under-luminous when compared with single-star evolutionary tracks corresponding to their present-day masses. During its initial phases, case A mass transfer occurs on a thermal timescale leading to a very rapid mass exchange. However, the mass transfer subsequently slows down and occurs on a nuclear timescale instead. By the time the mass transfer ends, both stars would therefore be expected to be in thermal equilibrium again. Since all three systems under consideration are in a detached configuration, the stars should thus have settled onto their new post-RLOF evolutionary tracks. The discrepancy between the observed luminosities and those predicted by the single-star evolutionary tracks most likely stems from several effects, such as observational uncertainties, altered chemical compositions (and hence opacities of the stellar material), and a rotational velocity history that differs from that assumed in the single-star models.
Our comparison shows that the degree of asynchronicity in the three post-RLOF systems increases with orbital period (from LZ Cep, over HD 149 404 to HD 47 129). This is most probably due to the higher efficiency of the tidal forcing in shorter period systems, or it might be seen as evidence that momentum transfer has played a larger role in those systems that have a wider present-day orbital separation. This is expected since binary evolution models predict spin-up to be less efficient in closer systems because in such systems the accretion stream directly affects the mass gainer without forming an accretion disk (e.g. Langer Langer1 (2012)). The questions of synchronization and circularization in close binary systems with early-type stars, featuring radiative envelopes and convective cores, have been addressed by Zahn (Zahn1 (1975)) and Tassoul (Tassoul (1987)). Zahn (Zahn1 (1975)) considered radiative damping of the dynamical tide in the outer layers of the stellar envelopes as the main mechanism for synchronization. The corresponding synchronization timescales strongly depend upon the tidal torque constant , which varies by several orders of magnitude during the main-sequence lifetime of the star (Zahn Zahn2 (1977)). Siess et al. (Siess (2013)) provided a parametrization of this parameter as a function of stellar mass and relative age of the star. Assuming that their formalism holds for the masses of the stars considered here and adopting an age of half the main-sequence age of the stars, we estimated the values of . We then evaluated the synchronization times following Eq. 4.28 of Zahn (Zahn1 (1975)) by means of moments of inertia tabulated by Claret & Giménez (CG (1992)). The results are and years for the primary and secondary stars of HD 149 404, respectively, and years for the primary and secondary of Plaskett’s star, and and years for the primary and secondary components of LZ Cephei. Tassoul (Tassoul (1987)), on the other hand, proposed that the most effective mechanism for synchronization is provided by large-scale hydrodynamic motions in the interiors of the tidally distorted binary components. The resulting timescales are considerably shorter than those estimated following the formalism of Zahn (Zahn1 (1975)). We estimate synchronization timescales of and years for HD 149 404, and years for Plaskett’s star, and and years for LZ Cep. Regardless of which of the two formalisms is most appropriate to describe the evolution of rotation in the systems considered here, we find that, except perhaps for Plaskett’s Star, which has a longer synchronization timescale, the RLOF phase probably must have ended less than a few years ago.
Another puzzling result is the fact that the post-RLOF mass-ratio deviates most from unity for the shortest period system (LZ Cep). Therefore, in this system, the RLOF must have been comparatively more efficient than in the longer period systems. As discussed above, the mass transfer in LZ Cep was most likely highly non-conservative. If the material lost by the system does not carry away angular momentum in addition to the intrinsic orbital angular momentum, such a non-conservative mass loss leads to a widening of the orbital separation given by
where is the mass-loss rate (Singh & Chaubey SC (1986), Tout & Hall TH (1991)). Assuming a fully non-conservative mass loss, this would imply that the initial orbital period of LZ Cep must have been shorter than 1.5 days. The duration of the RLOF episode depends on the evolution of the Roche-lobe filling factor of the mass donor. The evolution of the size of the Roche lobe is set by the relative importance of the orbit expansion and the shrinking of the relative size of the mass donor’s Roche lobe. In addition, the evolution of the radius of the mass donor needs to be accounted for (see Tout & Hall TH (1991)). Since massive stars with radiative envelopes contract considerably on a dynamical timescale (Tout & Hall TH (1991)) and in view of the current mass-ratio of LZ Cep (Mahy et al. Mahy1 (2011)), it seems unlikely that a non-conservative RLOF could be the explanation for a more efficient mass loss. Alternatively, if the material lost by the system carried off additional angular momentum, then the result could be a shrinking of the orbit. In active, low-mass stars, such a situation could arise if the material lost by the donor corotates with the latter under the effect of a magnetic field out to a wide distance (Tout & Hall TH (1991)). However, strong magnetic fields are fairly rare among single massive stars ( %), and their incidence appears even lower among massive binaries (Neiner et al. Neiner (2015)). Hence, this scenario also appears very unlikely in the case of LZ Cep.
Clearly, the above trends call for confirmation by studying a larger sample of post-case A RLOF massive binary systems. We are currently undertaking such studies, and the results will be presented in forthcoming publications.
5.3 Summary and conclusion
We analysed the fundamental properties of the binary system HD 149 404 by means of spectral disentangling and the CMFGEN atmosphere code. Our investigation of this object represents a significant improvement over previous studies because we have obtained the individual spectra of each component. This led to the determination of a number of stellar parameters that were used to constrain the evolutionary status of the system.
We established the existence of a large overabundance in N and a C and O depletion in the secondary star and also found a slight N enhancement in the primary’s spectrum. We showed that these surface abundances cannot be explained by single-star evolutionary models. Furthermore, we inferred an asynchronous rotation of the two stars of the system. These two results indicate a previous mass and angular momentum-exchange phase through a Roche-lobe overflow episode. Given the present status of HD 149 404 as an O+O binary, this mass transfer probably was a case A RLOF. However, dedicated theoretical studies are needed to understand the details of the evolution of this system.
Acknowledgements.
The Liège team acknowledges support from the Fonds de Recherche Scientifique (FRS/FNRS) including especially an FRS/FNRS Research Project (T.0100.15), as well as through an ARC grant for Concerted Research Actions financed by the French Community of Belgium (Wallonia-Brussels Federation), and an XMM PRODEX contract (Belspo). Anthony Hervé is supported by grant 14-02385S from GA ČR.References
- (1) Asplund, M., Grevesse, N., Sauval, A.J., & Scott, P. 2009, ARA&A, 47, 481
- (2) Chlebowski, T., & Garmany, C.D. 1991, ApJ, 368, 241
- (3) Claret, A., & Giménez, A. 1992, A&AS, 96, 255
- (4) Conti, P.S. 1973, ApJ, 179, 161
- (5) Conti, P.S. 1974, ApJ, 187, 539
- (6) Conti, P.S., & Alschuler, W.R. 1971, ApJ, 170, 325
- (7) Conti, P.S., & Frost, S.A. 1977, ApJ, 212, 728
- (8) de Loore, C., & Vanbeveren, D. 1994, A&A, 292, 463
- (9) de Mink, S.E., Pols, O.R., & Hilditch, R.W. 2007, A&A, 467, 1181
- (10) de Mink, S.E., Cantiello, M., Langer, N., Pols, O.R., Brott, I., & Yoon, S.-Ch. 2009, A&A, 497, 243
- (11) Dray, L.M., & Tout, C.A. 2007, MNRAS, 376, 61
- (12) Eggleton, P.P. 1983, ApJ, 268, 368
- (13) Ekström, S., Georgy, C., Eggenberger, P., et al. 2012, A&A, 537, A146
- (14) González, J.F., & Levato, H. 2006, A&A, 448, 283
- (15) Gray, D.F. 2008, The Observation and Analysis of Stellar Photospheres, 3rd edition, Cambridge University Press
- (16) Gray, R.O. 2010, http://www.appstate.edu/~grayro/spectrum/spectrum276 /node38.html
- (17) Herbst, W. & Havlen, R. J. 1977, A&AS, 30, 279
- (18) Hillier, D.J., & Miller, D.L. 1998, ApJ, 496, 407
- (19) Howarth, I.D., Siebert, K.W., Hussain, G.A.J., & Prinja, R.K. 1997, MNRAS, 284, 265
- (20) Hurley, J.R., Tout, C.A., & Pols, O.R. 2002, MNRAS, 329, 897
- (21) Kameswara Rao, N. 1972, PASP, 84, 563
- (22) Kippenhahn, R., & Weigert, A. 1967, Zeitschrift für Astrophysik, 66, 58
- (23) Lanz, T., & Hubeny, I. 2003, ApJS, 146, 417
- (24) Langer, N. 2012, Annu. Rev. Astron. Astrophys., 50, 107
- (25) Langer, N., Wellstein, S., & Petrovic, J. 2003, IAUS, 212, 275
- (26) Linder, N., Rauw, G., Martins, F., Sana, H., De Becker, M., & Gosset, E. 2008, A&A, 489, 713
- (27) Mahy, L., Martins, F., Machado, C., Donati, J.-F., & Bouret, J.C. 2011, A&A, 533, A9
- (28) Mahy, L., Gosset, E., Sana, H., Damerdji, Y., De Becker, M., Rauw, G., & Nitschelm, C. 2012, A&A, 540, A97
- (29) Martins, F., Schaerer, D., & Hillier, D.J. 2005, A&A, 436, 1049
- (30) Martins, F., & Plez, B. 2006, A&A, 457, 637
- (31) Martins, F. 2011, BSRSL, 80, 29
- (32) Martins, F., Hervé, A., Bouret, J.-C., Marcolino, W., Wade, G.A., Neiner, C., Alecian, E., Grunhut, J., Petit, V., and the MiMeS collaboration 2015, A&A, 575, A34
- (33) Martins, F., & Hillier, D.J. 2012, A&A, 545, A95
- (34) Muijres, L.E., Vink, J.S., de Koter, A., Müller, P.E., & Langer, N. 2012, A&A, 537, A37
- (35) Nazé, Y., Carrier, F., & Rauw, G. 2002, in Interacting Winds from Massive Stars, eds. A.F.J. Moffat & N. St-Louis, ASP Conf. Proc., 260, 457
- (36) Neiner, C., Mathis, S., Alecian, E., Emeriau, C., Grunhut, J., BinaMIcS; MiMeS collaborations 2015, in IAUS 305, 61
- (37) Palate, M., Rauw, G., & Mahy, L. 2013, Central European Astrophysical Bulletin, 37, 311
- (38) Palate, M., & Rauw, G. 2014, A&A, 572, A16
- (39) Petrovic, J., Langer, N., & van der Hucht, K.A. 2005, A&A, 435, 1013
- (40) Podsiadlowski, P., Joss, P.C., & Hsu, J.J.L. 1992, ApJ, 391, 246
- (41) Rauw, G. 2007, DSc thesis, University of Liège
- (42) Rauw, G. 2013, in Setting a New Standard in the Analysis of Binary Stars, eds. K. Pavlovski, A. Tkachenko, & G. Torres, EAS Publication Series, 64, 59
- (43) Rauw, G., Nazé, Y., Carrier, F., Burki, G., Gosset, E., & Vreux, J.-M. 2001, A&A, 368, 212
- (44) Reed, B.C. 2003, AJ, 125, 2531
- (45) Sana, H., de Mink, S.E., de Koter, A., et al. 2012, Science, 337, 444
- (46) Siess, L., Izzard, R.G., Davis, P.J., & Deschamps, R. 2013, A&A, 550, A100
- (47) Simón-Díaz, S., & Herrero, A. 2007, A&A, 468, 1063
- (48) Simón-Díaz, S., & Herrero, A. 2014, A&A, 562, A135
- (49) Singh, M., & Chaubey, U.S. 1986, Ap&SS, 124, 389
- (50) Stickland, D.J., & Koch, R.H. 1996, The Observatory, 116, 145
- (51) Tassoul, J.-L. 1987, ApJ, 322, 856
- (52) Thaller, M.L., Gies, D.R., Fullerton, A.W., Kaper, L., & Wiemker, R. 2001, ApJ, 554, 1070
- (53) Tout, C.A., & Hall, D.S. 1991, MNRAS, 253, 9
- (54) Vanbeveren, D. 1982, A&A, 105, 260
- (55) Vanbeveren, D. 2011, BSRSL, 80, 530
- (56) Vanbeveren, D., & de Loore, C. 1994, A&A, 290, 129
- (57) Vanbeveren, D., de Loore, C., Van Rensbergen, W. 1998, Astron. Astrophys. Rev., 9, 63
- (58) van der Hucht, K.A. 1996, in Wolf-Rayet stars in the framework of stellar evolution, Liège International Astrophysical Colloquium, 33, eds. J.-M. Vreux, A. Detal, D. Fraipont-Caro, E. Gosset, & G. Rauw, 1
- (59) Vink, J.S., de Koter, A., & Lamers, H.J.G.L.M. 2000, A&A, 362, 295
- (60) Vink, J.S., de Koter, A., & Lamers, H.J.G.L.M. 2001, A&A, 369, 574
- (61) Wellstein, S., Langer, N., & Braun, H. 2001, A&A, 369, 939
- (62) Wolk, S.J., Comerón, F., & Bourke, T. 2008, Handbook of Star Forming Regions, Volume II : The Southern Sky, ASP Monograph Publications, Vol. 5. Edited by Bo Reipurth, p.388
- (63) Zahn, J.-P. 1975, A&A, 41, 329
- (64) Zahn, J.-P. 1977, A&A, 57, 383