A Concise Network-Centric Survey of IP Traceback Schemes based on Probabilistic Packet Marking
Abstract
Multiple probabilistic packet marking (PPM) schemes for IP traceback have been proposed to deal with Distributed Denial of Service (DDoS) attacks by reconstructing their attack graphs and identifying the attack sources.
In this paper, ten PPM-based IP traceback schemes are compared and analyzed in terms of features such as convergence time, performance evaluation, underlying topologies, incremental deployment, re-marking, and upstream graph. Our analysis shows that the considered schemes exhibit a significant discrepancy in performance as well as performance assessment. We concisely demonstrate this by providing a table showing that (a) different metrics are used for many schemes to measure their performance and, (b) most schemes are evaluated on different classes of underlying network topologies.
Our results reveal that both the value and arrangement of the PPM-based scheme convergence times vary depending on exactly the underlying network topology. As a result, this paper shows that a side-by-side comparison of the scheme performance a complicated and turns out to be a crucial open problem in this research area.
Index Terms:
IP traceback, network security, distributed denial of service (DDoS), probabilistic packet marking (PPM)I Introduction
Internet Protocol (IP) traceback is a method to deal with Distributed Denial of Service (DDoS) attacks [1, 2]. Using IP traceback, sources of attack traffic can be identified from the network traffic they generate. A prominent IP traceback technique for identification of flooding style DDoS attacks is Probabilistic Packet Marking (PPM). In PPM-based IP traceback, network routers embed their own identities in packets randomly selected from all the network traffic that the routers process [3]. In the event of an attack, the routers’ identity markings present in the attack packets can be used to reconstruct the attack graph — the paths taken by attack traffic — and establish its sources [4, 5]. The technique of probabilistically marking packets for IP traceback is the basis of many schemes hereafter referred to as PPM-based schemes [4, 6, 7, 8]. Multiple additional schemes have been proposed with the purpose to increase the efficiency of PPM-based schemes [6, 8, 9, 10].
Tracing the paths of IP packets back to their origin, known as IP traceback, is an important step in defending against DoS attacks employing IP spoofing. IP traceback facilitates holding attackers accountable and improving the efficacy of mitigation measures. The existing approaches for IP traceback can be grouped into two orthogonal dimensions: packet marking and packet logging. The main idea behind packet marking is to record network path information in packets. In mark based IP traceback, routers write their identification information (e.g., IP addresses) into a header field of forwarded packets. The destination node then retrieves the marking information from the received packets and determines the network path. Due to the limited space of the marking field, routers probabilistically decide to mark packets so that each marked packet carries only partial path information. The network path can be constructed by combining the marking information collected from a number of received packets. This approach is also known as probabilistic packet marking (PPM) [3]. PPM incurs little overhead at routers. However, it requires a flow of marked packets to construct the network path toward their origin.
In this paper, we present a concise network-centric analysis of a selected set of PPM-based schemes. Ten PPM-based schemes are compared in terms of features such as convergence time, the metrics, underlying topologies, incremental deployment, re-marking, and upstream graph. These schemes are PPM [3], AMS [4], PPM-NPC [11], TMS [12], FIT [6], RPPM [7], TPM [8], Randomize-and-link [9], IDPPM [10], and PBS [13]. The schemes considered therein are by no means an exhaustive study of all the PPM-based schemes in existence. However, the collection of schemes is large enough to show the discrepancy in both the metrics and underlying topologies as well as the inadequacy of the topologies that make their direct comparison difficult [14, 15].
Thus, this paper shows that the direct performance comparison of the schemes is complicated or not feasible at all. As our analysis show the reasons for this is (a) many schemes utilize different metrics to measure their performance and, (b) the many schemes are simulated on different kinds of underlying network topologies, the majority of which do not provide an adequate abstraction of the topology of the Internet or focus on different characteristics of it [7, 11, 12].
In detail, the underlying topologies are typically tree-structured with a single path from an attacker to the victim. In contrast, the topology of the Internet exhibits alternative routes that make it both resilient and scalable. Both the disparity in metrics and underlying topologies, as well as the inadequacy of the topologies, raise questions about the performances of these schemes in the Internet and the comparability between them. This shows that there is a need to evaluate and compare the schemes on common and appropriate networks. The results of this evaluation can then be used to determine which schemes are the most promising candidates for Internet deployment.
In summary, the contribution of this paper is threefold: (a) an analysis of PPM-based schemes is presented, (b) providing a taxonomy for PPM-based IP traceback schemes, and (c) an analytical model to argue that different underlying topologies inhibit a direct comparison between the performance of the PPM-based schemes.
The remainder of this paper is arranged as follows. Related work, in which the selected set of PPM-based protocols is discussed, is presented in Section II. The analysis of PPM-based schemes as well as additional background is presented in Section III, including considerations on definitions, metrics, and underlying topologies. The theory and system model behind our work is analyzed in Section IV. We discuss outcomes of this paper and conclude in Section V.
II Related work
In this section, we describe and discuss a set of PPM-based IP traceback schemes for which we will provide an analysis in Section III.
PPM-based schemes consist of a marking scheme and a reconstruction procedure, and are based on the assumption that large amounts of traffic are used in a (D)DoS attack [3]. In their original work, Savage et al. [3] propose that the PPM marking scheme is employed at all times in all the routers in the network, while the reconstruction procedure is employed by the victim in the event of an attack. The marking scheme ensures that every router embeds its own identity in packets randomly selected from the packets the routers process during routing. Since a large number of packets is received in an attack, there is a considerable chance that a victim will have received packets with markings from all the routers that were traversed by the attack packets. The victim then employs the reconstruction procedure which uses the received marked attack packets to map out the attack graph — the paths from the victim to the attackers. The total number of received packets required to trace the attackers is referred to as the scheme’s convergence time.
Multiple PPM-based schemes have since been introduced. One example is the Tabu Marking Scheme (TMS) [12]. The author points out that PPM is prone to information loss as a result of re-marking. Re-marking occurs when a router randomly selects a packet which already has marking information from an upstream router, and consequently overwrites this information. TMS tackles this problem by ensuring that their marking scheme forfeits the marking opportunity in the event that the randomly selected packet contains previous marking information. As a result, they report lower convergence times than PPM for DDoS attacks.
Another example is the Prediction Based Scheme (PBS) which also avoids re-marking [13]. However, in contrast to TMS, the PBS marking scheme ensures that the router information is embedded in the next available packet if the randomly selected packet already has marking information. The PBS marking scheme requires extra space cost of 1 bit compared to PPM. Additionally, the reconstruction procedure utilizes both legitimate and attack traffic to reconstruct the attack graph.
Wong et al. [7] present Rectified Probabilistic Packet Marking (RPPM). They point out that the reconstruction procedure used in PPM [3] and Advanced and Authenticated Marking schemes (AMS) [4] has an imprecise termination condition. They present a precise termination condition that enables complete attack graph reconstruction within a user-specified level of confidence.
Multiple additional schemes have been proposed with the purpose to increase the efficiency of PPM [6, 8, 9, 10]. Some of these schemes are analyzed in Table I. The table compares ten PPM-based schemes in terms of features such as convergence time, the metrics, underlying topologies, incremental deployment, re-marking, and upstream graph. The schemes considered therein are by no means an exhaustive study of all the PPM-based schemes, but the selection of schemes is large enough to show the discrepancy in both the metrics and underlying topologies as well as the inadequacy of the topologies that make their direct comparison difficult.
The feature incremental deployment refers to whether the scheme would be successful if the marking scheme is deployed on a fraction of the routers in the network. Only a few schemes explicitly state that they would be successful when partially deployed [3, 4, 6, 9].
Re-marking refers to whether the marking scheme at a router permits the overwriting of previous edge or router information in a packet. The majority of the considered schemes permit re-marking of packets [3, 4, 6, 7, 8, 9, 10].
Upstream graph refers to whether a scheme requires a previously obtained map of the network to successfully trace the specific path taken by attack traffic. Some of the works address how such a map can be obtained to aid in attack graph reconstruction [4, 6, 13].
Other features such as metrics, convergence time, and underlying topology are discussed in subsequent sections.
It is important to point out that PPM-based schemes are not the only proposed approaches to IP traceback [1, 2]. Alternatives include packet logging [16], specialized routing [17], Internet control message protocol (ICMP) traceback [18], deterministic packet marking [19] and hybrid approaches which combine different traceback techniques [20], or combine traceback with anomaly detection [21].
III Protocol Analysis
In this section, an analysis of the discussed PPM-based schemes from Section II is provided. This section is categorized according to definitions and expressions,
III-A Definitions and expressions
The performance of traceback schemes is commonly measured by the convergence time, also known as the reconstruction time. The convergence time is defined as the total number of received packets required by the reconstruction procedure to return the complete attack graph [3]. The convergence time is dependent on the marked packet distribution , the number of attackers , and attack graph as below.
Definition 1 (Convergence time).
The convergence time is defined as where is a graph made up of a set of nodes and a set of edges on which is implemented.
Definition 2 (Attack path length).
The attack path length is the number of edges (hops) that the attack traffic traverses between an attacker and the victim .
Definition 3 (Marked packet distribution).
The marked packet distribution is described as the marked packets received by the victim from the attacker given where is the number of attackers. We define as it depends on the marking probability , the marking scheme , and attack path length .
An alternative measure of the performance of a traceback scheme is the correctness of the attack graph that the reconstruction procedure returns when compared to the actual attack graph .
This is especially important in marking schemes where the router IP address is broken into fragments because of space constraints in the packet header as in [3, 4, 6, 8]. In these works, a fragment of the router’s IP address, instead of the entire address, is transmitted in the packet header, which requires an extra function of combining the fragments during the reconstruction procedure. This introduces the possibility of incorrect recombination where fragments from routers in are combined to identify an innocent router in , whereby refers to the complement of , as being part of . Ideally, the returned attack graph should be identical to the actual attack graph, i.e. .
Definition 4 (False positives).
False positives are nodes incorrectly identified as belonging to the attack graph. Given an attack graph and a reconstructed attack graph , the false positives are identified as all members of the set .
Definition 5 (False negatives).
False negatives are nodes in the attack graph that are not identified as such by the reconstruction procedure. Given an attack graph and a reconstructed attack graph , the false negatives are identified as all members of the set .
The expressions for convergence time shown in Table I are the analytical bounds for given is the Single Path, Single attacker (SP/SA) topology and the reconstruction procedure has no prior knowledge of the underlying topology. The SP/SA topology occurs when all the attack traffic originates from a single source and takes the same path to the victim. The convergence time expressions shown in Table I are derived using the coupon collector’s problem [22]. In randomize-and-link [9], is the number of fragments that each router splits its address into, and is the harmonic number. The schemes in [4, 6, 8, 10] do not provide mathematical modeling of their convergence times in the SP/SA topology.
Savage et al. [3] and Tseng et al. [11] point out that the ideal marking probability depends on the attack path length . In PPM [3], the marking probability is . This value of is based on the report that the path length for most Internet paths [23]. This value of is maintained in AMS [4], TMS [12], RPPM [7], and PBS [13].
Wong et al. [7] present a reconstruction procedure in which they count the number of packets required to construct a fully connected attack graph, and then count extra packets to guarantee with a certain level of confidence that all edges in the attack graph are in fact accounted for. To ensure uniformity across the schemes considered in our simulations, we use a simplified version of their reconstruction procedure in which the number of packets required to account for all edges in the complete attack path is counted.
A large variety of graphs are used as the underlying topologies in the considered protocol performance analysis. The majority of uses tree-structured graphs [3, 7, 11, 12, 9, 13].
| Scheme | Year | Convergence time | Metrics | Incremental deployment | Re-marking | Upstream graph | Underlying topology |
|---|---|---|---|---|---|---|---|
| PPM [3] | 2001 | 1 | yes | yes | no | SP/SA (max. 30 hops) | |
| AMS [4] | 2001 | undetermined | 1,4,5 | yes | yes | yes | Traceroute data set (103402 destinations, 2000 attackers) |
| PPM-NPC [11] | 2004 | 7 | no | no | no | SP/SA (10 hops) | |
| TMS [12] | 2005 | 1,2 | no | no | yes | Binary tree (6 hops, 32 sources) | |
| FIT [6] | 2005 | undetermined | 1,3,6 | yes | yes | yes | Skitter map (174409 hosts, 5000 attackers) |
| RPPM [7] | 2008 | 5,10,11,12 | no | yes | no | SP/SA, binary tree, random tree network (15, 100, 500, 1000 nodes) | |
| TPM [8] | 2008 | undetermined | 1,4,8,9 | no | yes | yes | Skitter data (avg. 18 hops) |
| Randomize-and-link [9] | 2008 | 7,11,12 | yes | yes | no | Binary tree (10 hops) | |
| IDPPM [10] | 2010 | undetermined | 12,13 | no | yes | no | SP/SA (20-32 hops) |
| PBS [13] | 2012 | 1,2,7 | no | no | yes/no | SP/SA, SP/MA, MP/MA, 50 node network, 100 node network |
III-B Metrics
In this section, we describe the metrics used in the considered PPM-based schemes (as shown in Tables I and II) in terms of the definitions given in the preceding section.
III-B1 Convergence time metrics
The convergence time is the fundamental measure of the speed and success of any PPM-based scheme and it is dependent on many factors. A variety of metrics has been used to measure this dependence with respect to these various factors.
Convergence time versus attack path length shows how varies with . This is normally done for a simple topology , with but is done for larger values of in [4, 12, 7, 8, 13].
Convergence time versus number of attackers is a measure of how varies with for a specified . This metric is considered in [7, 9, 13, 11].
Convergence time versus marking probability is used by Wong et al. [7] to investigate the relationship between and marking probability for a topology , where , and show that large values actually increase the convergence time while very low values result in large values of . This relationship is investigated by Goodrich [9] for , , . He finds that the ideal marking probability is .
Convergence time versus number of routers is a description of the relationship between convergence time and the size of a given graph . This metric is used in [9] for , in [7] for , and in [10] for .
Reconstruction time in seconds versus the number of attackers is used in [4] to measure the variation of with . However, is translated from packets to time in seconds. As a result, this metric is dependent on the system on which the victim is running the reconstruction procedure, as well as the bandwidth and latency of the topology on which the simulation is being carried out. In [7], the authors investigate the relationship between reconstruction time in seconds and the number of nodes in the attack graph.
III-B2 False positive and false negative metrics
Some researchers have investigated the various factors that affect the accuracy of the traceback process.
False positives versus false negatives is a measure of how varies with . This form of a Receiver Operating Curve (ROC) is used to evaluate the scheme in [6].
False positive versus number of attackers investigates the variation of the number of false positives , with for . This is considered in [4, 8].
False negative versus number of packets shows how the false negatives vary with the number of received packets without any false positives. This plot is used in [6] with to show that the accuracy improves with an increase in received packets.
| Index | Metric definition |
|---|---|
| 1 | Convergence time vs. attack path length |
| 2 | Number of marked packets vs. distance from victim |
| 3 | False positives vs. false negatives |
| 4 | False positives vs. number of attackers |
| 5 | Reconstruction time in seconds vs. number of attackers |
| 6 | False negatives vs. number of packets |
| 7 | Convergence time vs. number of attackers |
| 8 | Fraction of distinct markings vs. number of attackers |
| 9 | Probability a packet is unmarked vs. path length |
| 10 | Successful rate vs. traceback confidence level |
| 11 | Convergence time vs. marking probability |
| 12 | Convergence time vs. number of routers |
| 13 | Overhead on routers vs. number of nodes |
III-B3 Additional metrics
There are additional metrics that do not fall into the convergence time, or false positive and false negative categories. These metrics are generally used to understand the extra dynamics involved in the traceback process.
Fraction of distinct markings versus number of attackers measures the proportion of with distinct markings as a function of at a given value of . This metric is used in [8].
Number of marked packets versus distance from victim is a description of the distribution of . It shows how varies with router distance , where . This was evaluated for with in [12], and with in [13].
Probability that a packet is unmarked versus path length is used in [8] to show the variation of with for .
Successful rate versus traceback confidence level is used by Wong et al. [7]. They present a reconstruction procedure that uses a traceback confidence level to determine when to halt the traceback process. They present this metric, which is a measure of how the proportion of times varies with the traceback confidence level for .
Overhead on routers versus number of nodes is used in [10] to show the overhead cost on the routers as a function of the number of nodes in the attack graph . The overhead on the routers is measured in terms of the number of markings performed.
III-C Categories of PPM schemes
Despite their large number, PPM-based schemes have similar underlying algorithms in their marking schemes. The underlying algorithm is responsible for how the packets in which the router identities are embedded are selected. For example, the majority of the considered schemes exhibit underlying algorithms in which all routers randomly select packets with equal probability [3, 4, 6, 7, 8, 9, 10]. The schemes in this category are prone to re-marking. We refer to this category as the re-marking category of PPM-based schemes. In the other category of schemes, the routers’ packet selection process is only partially random. The underlying algorithms in this category prohibit the overwriting of previous router information and as a result exhibit performances that are notably different from the re-marking category [12, 13, 11].
We select three representative marking schemes: PPM [3] to represent the re-marking category, and TMS [12] and PBS [13] to represent the non-re-marking category. The analytical models for these three schemes are markedly different from each other, even for equal marking probability, because of the differences in the schemes’ underlying marking algorithms. The performance of any PPM-based scheme can therefore be compared to either one of these schemes, or a combination of them.
Because of re-marking in PPM, the victim typically receives more markings from close-by routers than from distant routers. The chance of receiving a marked packet from a router hops away is given by the geometric distribution expression . This is because a received marked packet indicates that that packet was selected by a router (with probability ), and not selected (with probability ) by all subsequent routers. The analysis for PPM can therefore be applied to any scheme where the markings from distant routers are rarer than markings from close-by routers.
In TMS, the decision to forfeit a marking opportunity if the packet is previously marked means that markings from routers distant from the victim are more prevalent than markings from closer routers. The chance of receiving a marked packet from a router hops away is given by where is the attack path length. This is because a received marked packet indicates that that packet was selected by a router (with probability ), after not being selected (with probability ) by all previous routers. This analysis can be applied to all schemes in which markings from distant routers are more prevalent than markings from close-by routers.
In contrast to TMS, the PBS marking scheme compensates for the missed marking opportunities. Therefore the chance of receiving a marking from a router hops from the victim is given by for any router in the path. This analysis can be applied to all schemes in which the markings from the routers are equally prevalent regardless of their distance from the victim.
These three schemes therefore provide an adequate basis to understand the impact of the network topology on other PPM-based schemes.
III-D Underlying topologies
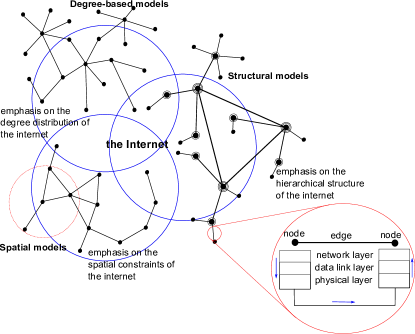
The performance of a PPM-based traceback scheme should be evaluated on the Internet itself. However, because of the very large-scale dynamic and heterogeneous structure of the Internet attempts to carry out empirical protocol evaluation are expensive and inflexible [24]. As a result, researchers resort to simulations implemented on underlying topologies which are considered to be simplified abstractions of the topology of the Internet [24, 25, 26, 27]. An underlying topology is represented by a graph consisting of nodes and edges where the nodes represent either devices with routing capability or end hosts. An edge between any two nodes means that traffic can be directly transmitted between those two devices (cf. Fig. 1) [24].
As shown in Table I, a variety of underlying topologies have been used to evaluate the performance of PPM-based schemes. During set up, the marking algorithm is implemented in the nodes (routers) in the graph. To simulate the attack, packets are transmitted from one or more nodes (representing the attackers) to one specific node (representing the victim). A reconstruction procedure is then implemented at the victim to map out the attack graph . The attack graph consists of all nodes and edges in the underlying topology that were directly involved in transmitting the attack packets. The underlying topologies used in PPM-based schemes range from simplistic to complex.
The single path, single attacker (SP/SA) is a simple topology consisting of a single attacker node sending packets along a single identical path to a single victim node. The length of the path varies with each work ranging from 3 hops to 32 hops [3, 7, 13, 11]. This setup is used to simulate the performance of PPM schemes during a flooding style DoS attack.
The Single Path, Multiple Attacker (SP/MA), and Multiple Paths, Multiple Attacker (MP/MA) topologies consist of multiple sources of attack traffic to simulate a DDoS attack. The SP/MA simulates a unique topology in which all the attackers are located at different distances from the victim but all along a single identical path [13]. The MP/MA simulates a more general topology where each attacker has a unique path linking it to the victim node. In some cases, the paths are completely independent [7], while in other cases, the paths merge closer to the victim [12, 7, 9, 13].
One unique MP/MA topology is a tree, e.g. a binary tree. In this case, the attack graph is modeled as a tree with some or all the leaves at a certain depth representing the attack nodes, and the root of the tree representing the victim node [12, 7, 9]. This setup ensures that different attack paths merge the closer they are to the victim. As with SP/SA and SP/MA, there is only one path in the attack graph from an attack node to the victim node.
Schemes such as AMS, FIT, and TPM have been evaluated using actual data sets from the Internet [4, 6, 8] including traceroute data sets from Lucent Bell labs [4] and CAIDA’s skitter map [6, 8]. These data sets are used to produce topologies that are typically larger than the simple topologies mentioned thus far and provide better abstractions of the Internet structure. However, they do not provide an adequate description of the Internet since they are typically restricted to restricted snapshot of the Internet network [16]. Traceroute datasets have also been reported to be inaccurate when the network has asymmetric paths [6].
One common feature with these underlying topologies is their tree-like structure. A tree-structured topology exhibits a single path from any given attacker to the victim. The choice of tree-structured topologies is based on the assumption that all attack traffic from one attacker will take the same path to the victim. This assumption is in turn based on the observation that Internet paths are largely invariant particularly over short periods of time [28]. These assumptions have allowed researchers to simplify the simulation process by ignoring the routing capabilities of the network and enforcing a predefined set of paths for attack traffic as evidenced in a tree-structured topology. However, because tree-structured topologies do not exhibit the alternative routes ubiquitous in the Internet, they can not be used as an appropriate abstraction of the Internet topology.
In summary, network models used to simulate the Internet topology fall into three categories based on the properties that they emphasize, namely degree-based models, structural models and spatial models (cf. Fig. 1). The emphasis of degree-based models is the degree distribution of the nodes in an attempt to recreate the power law observations in the Internet [26, 29]. The structural models arrange the nodes to mimic the hierarchical structure of the Internet, with Internet traffic being transmitted through routers located within autonomous systems [24, 27]. The spatial models place emphasis on the location of the nodes with any two nodes being connected only if they are within a transmission range of each other [30].
IV Topology Influence Analysis: A Demonstration
In the last part, we argued that the comparison of performance results is difficult because the underlying topologies used are fundamentally different. Here, an analytical basis is given that shows how subtle differences in the network topologies contribute to differences between the convergence times of the PPM-based schemes.
The convergence time for PPM-based schemes has been originally modeled as the coupon-collector’s problem [22, 3]. A coupon collector seeks to collect equally likely distinct coupons by drawing them from an urn with replacement. While it takes a short time to get the first few unique coupons, it takes considerably longer to get the last few coupons that complete the entire collection. The expected number of turns needed to draw all distinct coupons grows as [22].
When the coupon collector problem is applied to packet marking, the marked packets are considered to be the coupons. For example, Fig. 2 shows a single path linking attacker A to victim I and the target of the “coupon collector” would be to collect markings for all 7 edges. However, the expected time expression above must be modified to apply them to the packet marking problem because one may or may not “draw” a marked packet in the packet marking problem and the marked packets have unequal chances of being received. Savage et al. [3] deal with the unequal edge probabilities by utilizing the probability of the least likely edge to provide an upper bound on the expected convergence time.
Formally, given a single path of hops implementing the PPM scheme with router marking probability , the least likely edge is typically the edge located closest to the attacker which has a probability of being received by the victim. Given unique markings, the probability of receiving any marking at the victim is therefore at least which is the product of the number of unique markings and the probability of the least likely edge. The expected number of packets required to complete the marking “collection” in order to build the attack graph is derived by dividing the original coupon collector expectation by which yields [3].
| (1) |
Therefore, the final expression for the upper bound of the expected convergence time is obtained by dividing the natural logarithm of the number of distinct edges , by the probability of the least likely edge in the attack path. For the SP/SA topology, the number of hops is equal to the number of unique markings ().
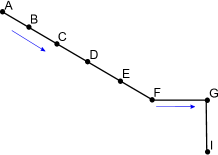
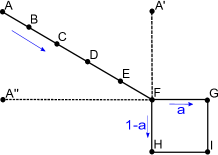
In Fig. 2, the least likely edge is AB with a probability of . However, the probability of receiving edge FG in Fig. 2 is given by which is considerably less than the probability of AB for short path lengths. In this case, the convergence time is given by Equation 2.
| (2) |
Comparing Equation 1 and Equation 2 reveals that the convergence time is increased by a factor of . This means that even in the best case when both alternative paths are equally likely (), the convergence time of a 3-hop attack graph is multiplied by a factor of while a 15 hop attack graph is multiplied by a factor of . If one of the two paths only carries a tenth of the traffic (), the convergence times of the 3-hop and 15-hop attack graphs are multiplied by a factor of and respectively. Additionally, the alternative paths factor affects short attack paths more than long attack paths.
The cases for TMS and PBS are similar. It can be shown that for TMS and PBS the convergence time is increased by a factor of regardless of the path length.
This shows that alternative paths reduce the probability of the least likely edges in an attack path for all the considered schemes, and consequently increases their convergence times.
V Conclusion
In this paper, ten PPM-based IP traceback schemes are compared and analyzed. Although, it is a non-exhaustive study, the number of schemes is sufficiently representative to show existing discrepancies in performance and performance evaluation between the schemes.
As a result of this analysis, it becomes comprehensive why a direct comparison of PPM-based schemes turns out to be a prohibitively complicated undertaken. The reasons for this: Firstly, most schemes utilize different metrics to measure their performance. Secondly, many schemes are evaluated on different kinds of underlying network topologies, the majority of which do not provide an adequate abstraction of the topology of the Internet or focus on different characteristics of it.
The underlying topologies are typically tree-structured with a single path from an attacker to the victim. In contrast, the topology of the Internet exhibits alternative routes that make it both resilient and scalable. Both the disparity in metrics and underlying topologies, as well as the inadequacy of the topologies, raise questions about the performances of these schemes in the Internet. For example, which scheme would perform best when deployed on an appropriate network—a network similar to the Internet? Does the performance of a PPM-based scheme vary with the network on which it is implemented? If so, is it possible to provide a common ground for comparing scheme performance when the schemes are implemented on different networks? These questions show that there is a need to evaluate and compare the schemes on common and appropriate networks. The results of this evaluation can then be used to determine which schemes are the most promising candidates for Internet deployment.
The work presented herein has implications that reach outside the field of IP traceback. For example, do other network protocols also display a dependence on the network topology exhibited by the network on which they are implemented? If so, can these dependencies be exploited to yield better protocol performance in specific types of networks? These questions should encourage multiple topology evaluations of network protocols.
References
- [1] A. Belenky and N. Ansari, “On ip traceback,” IEEE Comm. Magazine, pp. 142–153, 2003.
- [2] Z. Gao and N. Ansari, “Tracing cyber attacks from the practical perspective,” IEEE Comm. Magazine, pp. 123–131, 2005.
- [3] S. Savage, D. Wetherall, A. Karlin, and T. Anderson, “Practical network support for ip traceback,” ACM SIGCOMM, vol. 30, pp. 295–306, 2000.
- [4] D. X. Song and A. Perrig, “Advanced and authenticated marking schemes for ip traceback,” in Proc. of IEEE INFOCOM Conf., pp. 878–886, 2001.
- [5] J. Mesit and M. R. Brust, “Secured node-to-node key agreement for wireless sensor networks,” in Proc. of International Conference on Information Networking (ICOIN), pp. 37–39, IEEE, 2015.
- [6] A. Yaar, A. Perrig, and D. Song, “Fit: fast internet traceback,” in Proc. of IEEE INFOCOM Conf., pp. 1395–1406, 2005.
- [7] T.-Y. Wong, M.-H. Wong, and C.-S. Lui, “A precise termination condition of the probabilistic packet marking algorithm,” IEEE Trans. on Dependable and Secure Computing, pp. 6–21, 2008.
- [8] V. Paruchuri, A. Durresi, and S. Chellappan, “Ttl based packet marking for ip traceback,” in Proc. of IEEE GLOBECOM Conf., pp. 1–5, 2008.
- [9] M. T. Goodrich, “Probabilistic packet marking for large-scale ip traceback,” IEEE/ACM Trans. Netw., pp. 15–24, 2008.
- [10] Q. Yan, X. He, and T. Ning, “An improved dynamic probabilistic packet marking for ip traceback,” IJCNIS, pp. 47–53, 2010.
- [11] Y. K. Tseng, H. H. Chen, and W. S. Hsieh, “Probabilistic packet marking with non-preemptive compensation,” IEEE Comm. Letters, pp. 359–361, 2004.
- [12] M. Ma, “Tabu marking scheme to speedup ip traceback,” Computer Networks, pp. 3536–3549, 2006.
- [13] A. R. Kiremire, M. R. Brust, and V. V. Phoha, “A prediction based approach to ip traceback,” in Proc. of the IEEE Conf. on Local Computer Networks, 2012.
- [14] A. R. Kiremire, M. R. Brust, and V. Phoha, “Topology-dependent performance of attack graph reconstruction in ppm-based ip traceback,” in IEEE Consumer Communications and Networking Conference (IEEE CCNC), pp. 363–370, IEEE, 2014.
- [15] A. R. Kiremire, M. R. Brust, and V. V. Phoha, “Using network motifs to investigate the influence of network topology on ppm-based ip traceback schemes,” Computer Networks, 2014.
- [16] J. Li, M. Sung, J. Xu, and L. Li, “Large-scale ip traceback in high-speed internet: practical techniques and theoretical foundation,” in Proc. of IEEE Symp. on Security and Privacy, pp. 115–129, 2004.
- [17] R. Stone, “Centertrack: an ip overlay network for tracking dos floods,” in Proc. of USENIX Security Symp., pp. 15–15, 2000.
- [18] S. Bellovin, M. Leech, and T. Taylor, “Icmp traceback messages,” 2003.
- [19] A. Belenky and N. Ansari, “Ip traceback with deterministic packet marking,” Comm. Letters, IEEE, pp. 162–164, 2003.
- [20] M.-H. Yang and M.-C. Yang, “Riht: A novel hybrid ip traceback scheme,” Information Forensics and Security, IEEE Trans. on, pp. 789–797, 2012.
- [21] Y. Xiang, K. Li, and W. Zhou, “Low-rate ddos attacks detection and traceback by using new information metrics,” Information Forensics and Security, IEEE Trans. on, pp. 426–437, 2011.
- [22] W. Feller, An Introduction to Probability Theory and Its Applications. Wiley, 1968.
- [23] R. Carter and M. Crovella, “Server selection using dynamic path characterization in wide-area networks,” in Proc. IEEE INFOCOM Conf., pp. 1014–1021, 1997.
- [24] K. L. Calvert, M. B. Doar, and E. W. Zegura, “Modeling internet topology,” IEEE Communications Magazine, pp. 160–163, 1997.
- [25] H. Tangmunarunkit, R. Govindan, S. Jamin, S. Shenker, and W. Willinger, “Network topologies, power laws, and hierarchy,” Comput. Commun. Rev, 2001.
- [26] M. Faloutsos, P. Faloutsos, and C. Faloutsos, “On power-law relationships of the internet topology,” in ACM SIGCOMM, pp. 251–262, 1999.
- [27] A. Medina, A. Lakhina, I. Matta, and J. Byers, “Brite: An approach to universal topology generation,” in Proc. of the Int. Symp. in Modeling, Analysis and Simulation of Computer and Telecom. Systems, 2001.
- [28] V. Paxson, “End-to-end routing behavior in the internet,” ACM SIGCOMM, pp. 41–56, 2006.
- [29] B. Waxman, “Routing of multipoint connections,” IEEE Journal on Selected Areas in Comm., pp. 1617–1622, 1988.
- [30] B. N. Clark, C. J. Colbourn, and D. S. Johnson, “Unit disk graphs,” Discrete Mathematics, pp. 165–177, 1990.