From the first stars to the first black holes
Abstract
The growth of the first super massive black holes (SMBHs) at is still a major challenge for theoretical models. If it starts from black hole (BH) remnants of Population III stars (light seeds with mass M⊙) it requires super-Eddington accretion. An alternative route is to start from heavy seeds formed by the direct collapse of gas onto a M⊙ BH. Here we investigate the relative role of light and heavy seeds as BH progenitors of the first SMBHs. We use the cosmological, data constrained semi-analytic model GAMETE/QSOdust to simulate several independent merger histories of quasars. Using physically motivated prescriptions to form light and heavy seeds in the progenitor galaxies, we find that the formation of a few heavy seeds (between 3 and 30 in our reference model) enables the Eddington-limited growth of SMBHs at . This conclusion depends sensitively on the interplay between chemical, radiative and mechanical feedback effects, which easily erase the conditions that allow the suppression of gas cooling in the low metallicity gas ( and ). We find that heavy seeds can not form if dust cooling triggers gas fragmentation above a critical dust-to-gas mass ratio (). In addition, the relative importance of light and heavy seeds depends on the adopted mass range for light seeds, as this dramatically affects the history of cold gas along the merger tree, by both SN and AGN-driven winds.
keywords:
Galaxies: evolution, high-redshift, ISM; quasars: general; black hole physics; stars: black holes1 Introduction
Super Massive Black Holes (SMBHs), powering the most luminous quasars ( erg s-1) at redshift , are among the most intriguing and puzzling astronomical objects observed in the early Universe. Observational campaigns are pushing the high redshift frontier closer and beyond the reionization epoch, expanding the census of high redshift quasars.
The most distant quasar observed so far is ULAS J1120+0641, at , in which the central engine is a black hole (BH) with a mass of M⊙ (Mortlock et al., 2011), already in place when the Universe was as old as Myr. Recently, Wu et al. (2015) discovered an ultraluminous quasar at ( L⊙) hosting a massive BH of M⊙, presumably accreting close to the Eddington rate.
The existence of M⊙ BHs in the early Universe (Fan et al. 2001; 2004; De Rosa et al. 2011; 2014 and references therein) poses a challenge to theoretical models aimed to explain the formation and growth of such massive objects. Many efforts have been done so far in order to unveil the nature of their progenitor seed BHs, how and when these seeds form and how they can grow so rapidly, in less than Gyr, up to few billion solar masses and more.
Different scenarios for BH formation have been proposed so far (see e.g. Rees 1978; Volonteri 2010, Volonteri & Bellovary 2012 for comprehensive reviews). BH seeds with M⊙ are predicted to form as end products of massive, metal-poor Population III (Pop III) stars (e.g. Abel et al. 2002; Heger et al. 2003; Madau & Rees 2001; Yoshida et al. 2008; Latif et al. 2013b; Hirano et al. 2014). Runaway collisions of massive stars during the gravitational collapse of the core of compact star clusters can lead to the formation of intermediate mass BHs with M⊙ (e.g. Omukai et al. 2008; Devecchi & Volonteri 2009; Katz et al. 2015). In addition, the fast merging of stellar mass BHs in a cluster has been proposed as a possible way to give rise to more massive seeds (Davies et al. 2011; Lupi et al. 2014). Finally, the formation of more massive, M⊙, seed BHs is predicted to occur via direct collapse of dense, metal poor gas clouds in halos with virial temperatures K which are exposed to a strong H2 photodissociating flux (e.g. Bromm & Loeb 2003; Begelman et al. 2006; Spaans & Silk 2006; Inayoshi & Omukai 2012; Inayoshi et al. 2014; Ferrara et al. 2014). Low metallicity and the suppression of H2 molecules formation are fundamental requirements for avoiding gas cooling, cloud fragmentation and thus star formation.
It has been suggested that the less massive seeds (Pop III remnants and collapsed stellar clusters) would require a continuous gas accretion close to or above the Eddington limit in order to grow up to few billion solar masses in less than Gyr. For example, Johnson et al. (2013) show that BH seeds as massive as M⊙, are required if sub-Eddington accretion and a large radiative efficiency () are assumed (see also Volonteri, Silk & Dubus 2015).
Although the conditions in which they can form are met only in very rare environments (e.g. Hosokawa et al. 2012; 2013; Inayoshi et al. 2014; Inayoshi & Haiman 2014, Sugimura et al. 2015; Yue et al. 2014) direct collapse BHs (DCBHs) have been proposed as a viable scenario to explain high redshift SMBHs. The formation mechanism, characteristic mass and relevant processes in the direct collapse scenario have been widely investigated in the literature (e.g. Latif et al. 2013a; 2013b; 2014; Johnson et al. 2012; Sugimura et al. 2014; Agarwal et al. 2012; 2014; 2015; Latif & Volonteri 2015, Glover 2015a; 2015b).
The work presented in this paper is similar in spirit to what has been done by Petri et al. (2012) who presented a semi-analytic model for the assembly of high- SMBHs along a merger history, starting from DCBHs of M⊙ and stellar mass BHs of M⊙. They show that the final BH mass assembled via both gas accretion and BH-BH mergers, strongly depends on the fraction of halos hosting DCBHs in the merger tree. A M⊙ BH can be obtained if this fraction reaches . However, these authors do not follow the chemical evolution of the host galaxies, and in particular of the metallicity and dust-to-gas ratio of the interstellar medium.
The aim of this paper is to investigate the relative role of the less massive, Pop III remnant, seed BHs (light seeds) and of the most massive DCBH seeds (heavy seeds) in the formation and evolution of the first SMBHs, taking into account the BH-host galaxy co-evolution. To this aim we adopt an improved version of the semi-analytic code GAMETE/QSOdust which has been successfully used to investigate the evolutionary scenarios of high redshift quasars at (Valiante et al. 2011, 2012, 2014). In particular, together with the mass of the BH, the model well reproduce the properties of the quasars host galaxies such as the star formation rate, the mass of gas, metals and dust.
As in Valiante et al. (2011) we select as our target the quasar SDSS J1148+5251, observed at redshift . This is one of the best studied object at high redshift, hosting a BH mass of M⊙ (Barth et al. 2003; Willott et al. 2003). The other main observed properties of this quasar are summarized in Valiante et al. (2011) and Valiante et al. (2014).
The paper is organized as follows. In section 2 we present our approach introducing the model GAMETE/QSOdust and presenting in details the new features implemented for this work. The results are presented in section 3 where we study the redshift evolution of the BH mass and the birth environment of the seeds predicted by the reference model. In section 4 we discuss the dependence of the results on the model assumptions and parameters, and we summarize the conclusions in section 5.
2 Summary of the model
Here we briefly introduce GAMETE/QSOdust, the semi-analytic model adopted for this study, focusing on the new features implemented to investigate the nature of the first seed black holes. We refer the reader to Valiante et al. (2011; 2014) for a full description of the code.
GAMETE/QSOdust is a data constrained model aimed at the study of the formation and evolution of the first quasars and their host galaxies. It is based on the semi-analytic merger tree model GAMETE which was originally developed by Salvadori et al. (2007) to investigate the early evolution of the Milky Way and later applied to the Milky Way dwarf satellites (Salvadori et al., 2008; Salvadori & Ferrara, 2009; Salvadori et al., 2015), to investigate their contribution to the reionization and metal enrichment history of the Local Group (Salvadori et al., 2014), and to explore the connection of Damped Lyman- systems with local dwarfs (Salvadori & Ferrara, 2012). A two-phase interstellar medium (ISM) version of GAMETE was successfully adopted as a stellar archaeology tool to investigate the origin of metal-poor low-mass stars in the Milky Way (de Bennassuti et al. 2014, de Bennassuti et al. in prep).
In its present version, GAMETE/QSOdust enables us to investigate the co-evolution of nuclear black holes and their host galaxies, following their star formation histories and the enrichment of their ISM with metals and dust. The gas reservoir inside each galaxy is regulated by processes of star formation, BH growth and feedback.
We assume that the first SMBHs, observed at , reside in dark matter (DM) halos of M⊙ Thus, we first reconstruct the merger tree of such massive halos, decomposing them into their progenitors, backward in time, following a binary Monte Carlo approach based on the Extended Press-Schechter theory (see Valiante et al. 2011 and references therein for details): at each timestep, a halo of mass can either lose mass or lose mass and fragment into two less massive () progenitors.
Along the merger history of the DM progenitors, we follow the gradual evolution of the central SMBH and its host galaxy, via both mass accretion and mergers. We define as major mergers halos merging with mass ratio , where is the ratio of the less massive halo over the most massive companion. In each galaxy, the star formation rate (SFR) is assumed to be proportional to the available gas mass and the efficiency at which the gas is transformed into stars is enhanced during major mergers (see Valiante et al. 2011; 2014).
Following Valiante et al. (2011), we assume that in major mergers pre-existing BHs merge in symbiosis with their host galaxies and form of a new, more massive BH. In minor mergers BHs are unable to spiral in on short timescales as the merger time scale is on the order of the Hubble time or longer (see e.g. Tanaka & Haiman 2009). As a result, the least massive BH of the merging pair remains as a satellite and we do not follow its evolution.
We assume Eddington-limited BH growth. The accretion rate is described by the Bondi-Hoyle-Lyttleton (BHL) formula where we introduce a free parameter, , which is commonly adopted to quantify the increased density in the inner regions around the BH (Di Matteo et al., 2005). A value of is fixed to match the observed SMBH mass of J1148. A fraction of the energy released by supernova explosions and BH accretion is converted into kinetic energy of the gas in the host galaxy, thus driving gas outflows in the form of winds. In our previous study (Valiante et al., 2012) we show that the BH-host galaxy co-evolution is regulated by quasar feedback, with SN-driven winds providing a negligible contribution to the mass outflow rate, in good agreement with observations of outflowing gas in J1148 (Maiolino et al., 2012; Cicone et al., 2015). The AGN-driven wind efficiency, is fixed to match the observed gas mass in the host galaxy of J1148 (see Section 2.7).
Finally, the ISM of each progenitor galaxy is progressively enriched with metals and dust produced by Asymptotic Giant Branch (AGB) stars and Supernovae (SNe) according to their stellar evolutionary time scales. Here we adopt the improved version of the chemical evolution module of GAMETE/QSOdust presented in Valiante et al. (2014), where we consistently follow the evolution of metals and dust taking into account the dust life-cycle in a two-phase ISM. In hot diffuse gas, dust grains can be destroyed by SN shocks while in cold, dense clouds - where stars form - dust grains can grow by accretion of gas-phase heavy elements.
In the following sections we describe the new features introduced in the model for the purpose of the present study.
2.1 Resolving mini-halos
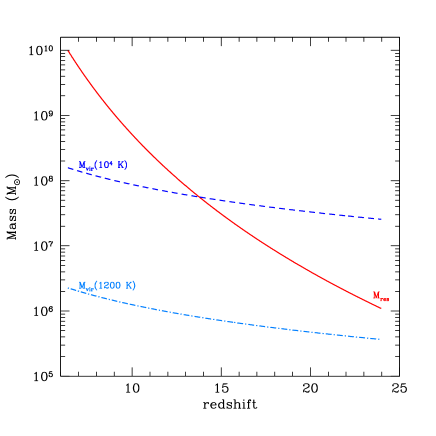
The first collapsed objects where the gas is able to cool and form stars have small masses, M⊙, and virial temperatures K (see e.g. Bromm 2013 for a recent review). To resolve these so-called mini-halos, we simulate the merger trees adopting a minimum mass of:
| (1) |
where M⊙ is the host DM halo at redshift . The redshift evolution of this resolution mass is shown in the left panel of Fig. 1. This choice enables us to simulate different realizations of the merger tree resolving high- mini-halos in a relatively short computational time.
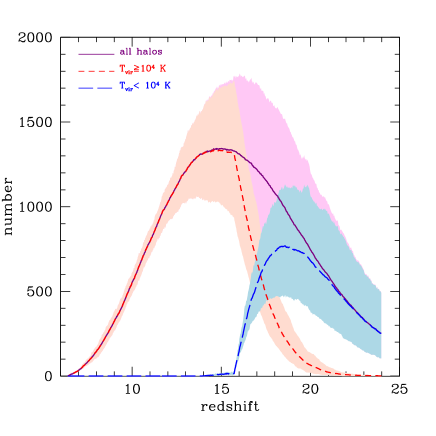
In mini-halos, which we define here as dark matter halos with K, the primordial gas can cool via rotational transitions of H2 (e.g. Haiman et al. 1996). Dark matter halos whose virial temperature exceeds the threshold for efficient atomic line cooling, K, are instead referred to as Lyman (Ly) halos. The number of mini-halos and Ly halos averaged over 10 different merger tree realizations is shown as a function of redshift in the right panel of Fig. 1. As expected, at mini-halos represent the dominant population among dark matter progenitors. Their number decreases at lower redshift down to , below which the halo population is completely dominated by more massive systems. This is a consequence of the redshift evolution of the assumed resolution mass which exceeds the minimum mass of Ly halos at these redshifts111In other words, we are note able to resolve mini-halos at redshift due to the chosen resolution mass threshold. This does not affect our results because at these radiative feedback has already suppressed star and BH formation in all halos below a virial temperature of K. This will be discussed in section 3..
2.2 UV radiation
The radiation emitted by stars and accreting BHs gradually builds up a cosmic ultraviolet (UV) background. Since we reconstruct the merger history of a single biased, high density region at , here we refer to UV background as the cumulative emission coming from all the progenitor galaxies of the M⊙ DM halo within its comoving volume at the turn-around radius, .
Radiative feedback effects have a fundamental role in the history of star and BH seed formation. Photons in the LymanWerner (LW) band, eV, can easily dissociate H2 molecules, suppressing cooling and star formation in metal-poor mini-halos (e.g. Haiman et al. 1997a; Haiman & Loeb 1997, Omukai & Nishi 1999, Omukai 2001, Machacek et al. 2001). Even a moderate LW flux can lead to an increase of the minimum mass required for DM halos to host star formation (see Appendix A).
The increased gas temperature in photo-ionized regions leads to an increase of the cosmological Jeans mass. As a result, gas accretion onto low-mass dark matter halos is suppressed in ionized regions, while the internal gas in existing low-mass halos will be photo-evaporated (e.g. Barkana & Loeb 1999, Shapiro et al. 2004, Sobacchi & Mesinger 2013).
The cumulative flux (in units of erg cm-2 s-1 Hz-1 sr-1) at the observed frequency and redshift is computed as (e.g. Haardt & Madau 1996):
| (2) |
where is the H2 optical depth in the LW band and is the comoving emissivity, namely the monochromatic luminosity per unit comoving volume (erg s-1 Hz-1 cm-3), in the LW band at redshift . The redshift represents the highest redshift from which a LW photon emitted by a source at can reach the observer at before being redshifted at lower frequencies, outside the LW range, into a H Lyman resonance line. In the dark screen approximation, this redshift can be defined as (see e.g. Haiman et al. 1997b, Haiman et al. 2000) being the first Lyman line frequency above the observed one.
In general, depends on H2 number density, on the line profile and on the probability that the molecule is dissociated after a transition. It can reach values (Ciardi et al. 2000, Ricotti et al. 2001) leading to a reduction in the LW background flux of about one order of magnitude. Following Ahn et al. (2009) we compute the intergalactic absorption averaged over the LW band using the modulation factor described by the fitting formula:
| (3) |
where is the distance between the emitting source, at redshift , and the observer at redshift , expressed in units of comoving Mpc:
| (4) |
with . The scaling factor in eq. (3) is defined as:
| (5) |
The resulting average attenuation of the UV flux increases with increasing comoving ratio , approaching zero when which is the maximum distance from which the observer can see LW photons emitted by a source at redshift , the so-called LW horizon (see Fig. 3 of Ahn et al. 2009).
In what follows, we call the LW background flux in units of erg cm-2 s-1 Hz-1 sr-1 and we compute it at the central frequency of the LW band using eqs. (2) – (5).
Following Salvadori et al. (2014), the time evolution of the filling factor of ionized regions is computed as:
| (6) |
where is the escape fraction of ionizing photons, is the total production rate of ionizing photons per unit volume summed over all the emitting sources, is the comoving hydrogen number density in the integalactic medium (IGM), is the IGM gas number density and is the hydrogen mass fraction. In the right-hand side of eq. (6), cm3 s-1 is the hydrogen recombination rate and is the clumping factor.
At each given redshift, the total LW emissivity and ionizing photon rate are computed summing over all the emitting sources, both stars and accreting BHs. For Pop III stars, we use the mass-dependent emissivities given by Schaerer (2002) for stars with no mass loss (see Table 4 and Table 6 of the original paper). For Pop II/I stars we compute the metallicity and age-dependent emissivities using Bruzual & Charlot (2003) population synthesis model. We assume that the stars form in a single burst with a Salpeter Initial Mass Function (IMF) in the mass range M⊙. For accreting BHs, we compute the LW and ionizing photons production rates by modeling the Spectral Energy Distribution (SED) as a classic multicolor disk spectrum up to (Shakura & Sunyaev, 1973), and a non-thermal power-law component with spectral slope , with at higher energies (Shakura & Sunyaev, 1973; Sazonov et al., 2004).
2.3 Star formation rate
In each progenitor galaxy, the star formation rate is computed as:
| (7) |
where is the gas mass, is the
total star formation efficiency accounting for both quiescent and merger-driven episodes of star formation.
Following Valiante et al. (2011), we take and for equal mass
mergers, with a modulation that depends on the mass ratio of the merging pairs
(see eq. 11 and Table 2 in Valiante et al. 2011). Finally, the quantity quantifies the
reduced cooling efficiency of mini-halos with respect to Ly halos. Hence, we assume
in progenitor systems with K whereas in mini-halos this parameter quantifies the
mass fraction of gas that can cool in one dynamical time and it depends on the virial temperature,
redshift, gas metallicity and intensity of the LW background. The computation of
is described in Appendix A.
Photo-heating feedback.
To account for the effects of the increased gas temperature in photo-ionized regions,
we assume that star formation is suppressed, i.e.
, in halos with virial temperature below the
temperature of the IGM. Hence, we neglect the hydrodynamic
response of the gas (see Sobacchi & Mesinger 2013) and we assume a
feedback model where star formation is suppressed instantaneously when .
The mean IGM temperature is computed taking into account the volume filling factor of
ionized regions,
where K is
the assumed post-reionization temperature and .
Photo-dissociating feedback.
Suppression of cooling and star formation in mini-halos due to
photo-dissociation by LW photons is taken into account through the
parameter in eq. (7), whose calculation
is presented in Appendix A. Depending on the halo virial temperature,
redshift, gas metallicity and intensity of the LW background, we compare
the cooling time and the free-fall time and quantify the mass fraction of
gas that is able to cool and form stars. We find that in the presence
of a LW background, the cooling efficiency is rapidly suppressed in
mini-halos. In fact, when ,
only in mini-halos at or if the gas is already
metal-enriched to Z⊙. For more details, we refer the
reader to Appendix A and Figs. 14-17.
2.4 Stellar initial mass function
Currently, there are no direct observational constraints on the initial mass function of the first generation of stars. Theoretical studies do not yet provide a firm determination of the stellar mass spectrum emerging from the first star forming regions (see e.g. Bromm 2013 and Glover 2013 for comprehensive reviews). Recent numerical studies suggest that - depending on their formation environment - Pop III stars can have masses varying from 10s to 1000s M⊙, with a distribution that peaks around few tens to few hundreds solar masses (e.g. Hosokawa et al. 2011; Hirano et al. 2014; Susa et al. 2014; Hirano et al. 2015).
Following de Bennassuti et al. (2014), we assume that Pop III stars form according to a Larson IMF (Larson, 1998),
| (8) |
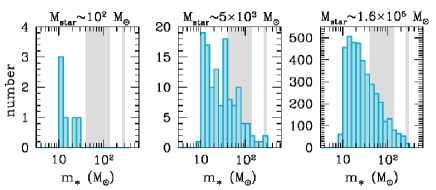
with , M⊙ and M M⊙. During each star formation episode, we stochastically sample the IMF until we reach the total stellar mass formed222We have tested that the IMF is fully reconstructed in the mass range when the total stellar mass formed is .(see also de Bennassuti et al. 2015). In Fig. 2 we show three examples of the mass distribution of Pop III stars emerging from a star formation episode where the total stellar mass formed is (left panel), (middle panel) and (right panel). The stellar population shown in the left panel is representative of the conditions that apply in small mass mini-halos. Only 6 stars are formed with masses in the range . In larger mass halos, as shown in the middle and right panels, the mass range that is populated is extended toward larger stellar masses.
When the metallicity in star forming regions is , where is the critical metallicity for low-mass star formation (Schneider et al. 2001; 2002; 2003), we assume that Pop II stars form in the stellar mass range according to a Larson IMF with . In what follows, we adopt Z⊙ and we discuss the impact of assuming a dust-driven transition at lower (Omukai et al., 2005; Schneider et al., 2012).
2.5 Light black hole seed formation
Light BH seeds form as remnants of Pop III stars. Here we assume that stars with masses in the range and do not explode as SNe and directly collapse to BHs (Heger & Woosley, 2002). The number and masses of BH remnants depend on the frequency with which these mass ranges are sampled when Pop III stars form and stochastically populate the IMF (see the previous section). In the two halos shown in the middle and right panels of Fig. 2, the stochastic sampling selects 124 and 3900 stars. The shaded regions in the same figure indicate the mass range leading to BH remnants. In small mini-halos, light BH seeds are very rare (see left panel).
The subsequent evolution of newly formed BHs depends on their mass. As discussed by Volonteri (2010), lighter BHs are not expected to settle at the center but rather wander through the host galaxy, interacting with stars. For this reason, we select as a light BH seed the most massive BH remnant333 In the three examples shown in Fig. 2, we do not assign any light BH seed to the population represented by the left panel and only one light BH seed in the other cases, taken to be the most massive BH remnant among the 2 (15) BHs of formed in the middle (right) panel.. We discuss the implications of this assumption in section 4.
2.6 Heavy black hole seed formation
Fragmentation of gas clouds, and thus star formation, is prevented in Ly halos ( K) in which the ISM metallicity is sub-critial () and the LW background is strong enough to photo-dissociate (Omukai et al., 2008). The latter condition is usually expressed as , where is the critical value in units of erg cm-2 s-1Hz-1 sr-1. If all the above conditions are simultaneously satisfied, the collapse proceeds almost isothermally thanks to atomic H line cooling, avoiding fragmentation into smaller clumps. This process leads to the formation of a single BH with mass in the range , that we call heavy BH seed, in some cases through an intermediate phase of super-massive star formation (see e.g. Hosokawa et al. 2012; Hosokawa et al. 2013 for more details). Recently, Ferrara et al. (2014) investigated the mass spectrum of heavy BH seeds and found that their masses range between to (see also Volonteri & Begelman 2010).
Following these studies, we assume that heavy BH seeds form with an average mass of in Ly halos with sub-critical metallicity and super-critical LW background.
The exact value of is still a matter of debate. Its value depends on whether sufficient to cool the gas within a free-fall time is formed before it is collisionally dissociated at , and depends on the spectral energy distribution of the sources of radiation (Omukai, 2001; Oh & Haiman, 2002; Bromm & Loeb, 2003; Omukai et al., 2008; Agarwal et al., 2012; Latif et al., 2014; Sugimura et al., 2014; Sugimura et al., 2015; Agarwal et al., 2015). In addition, Ly halos can be exposed to intense local radiation, which exceeds the background level, in biased, dense regions of the Universe, and close to star forming galaxies (Dijkstra et al., 2008; Tanaka & Haiman, 2009; Dijkstra et al., 2014). Additional complications come when H2 self-shielding is taken into account (Shang et al., 2010; Hartwig et al., 2015) and when the presence of X-ray or ionizing radiation increase the free electron fraction, favoring the formation of (Inayoshi & Omukai, 2011; Yue et al., 2014; Johnson et al., 2014; Inayoshi & Tanaka, 2015). As a result, values of between and have been proposed and used to estimate the number density of heavy seeds. In particular, and up to is always required to enable the direct collapse mechanism in 3D numerical simulations to produce supermassive stars with mass (Latif et al., 2014; Regan et al., 2014; Latif & Volonteri, 2015). Here we adopt a reference value of and we discuss the implications of this assumption in section 4.
3 Results
In this section we present the main results of our study. In the same spirit of Valiante et al. (2011, 2014), we follow the formation of a SMBH with a mass of M⊙ at redshift , similar to the one expected to power the bright quasar J1148 (Barth et al., 2003; Willott et al., 2003; De Rosa et al., 2011). In what follows, we present the results averaged over 10 independent realizations of the merger tree of a M⊙ DM halo. However, in order to explore the dependence of some results on the merger history, we also discuss the properties of individual merger trees.
3.1 Evolution of the black hole mass
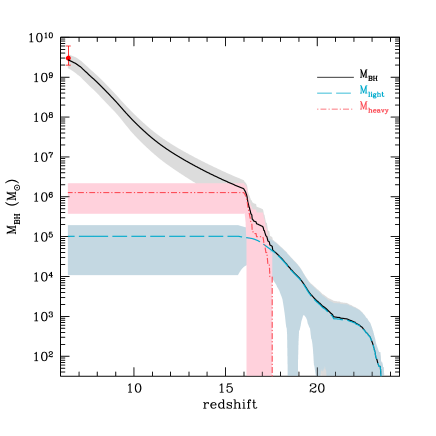
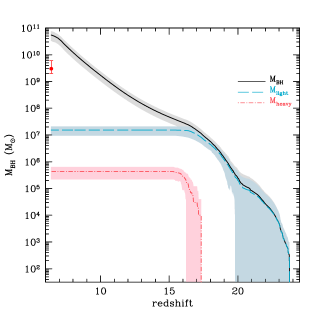
In Fig. 3 we show the predicted evolution of the total BH mass in a
merger tree as a function of redshift.
For each merger tree, we consider the contribution of BH progenitors to the total BH mass at each redshift.
We classify as BH progenitors only those BHs which do not become satellites at any stage of the
merger tree and whose mass will be inherited by the final SMBH at 444For each
merger tree, we follow backward in time the evolution of the SMBH. At each minor merger event, we cut the branch of the tree
of the lighter, satellite progenitor BH and we only follow the branch of the most massive one. At each major merger event, we continue to
follow both branches of the progenitor BHs. This procedure allows us to reconstruct a-posteriori the sample of BH progenitors whose masses
directly contribute to the final SMBH mass at ..
The free parameters of the model have been selected to reproduce a SMBH mass of
at , in good agreement with that expected for quasar J1148 (red
data point in Fig. 3).
In the same figure we also show the separate contribution of light (blue dashed line) and
heavy (red dot-dashed line) BH seeds to the total BH mass at different epochs.

Light seeds-dominated regime.
At high redshift (), BH growth is dominated by
the formation of light seeds. Their rate of formation
is strongly regulated by photo-dissociating feedback which inhibits
Pop III star formation in mini-halos.
The total mass from BH light seeds rapidly grows in time,
reaching, on average, a maximum value of
at , below which their formation is suppressed by
metal enrichment.
Heavy seeds-dominated regime.
Heavy seeds start to form at redshift and dominate
the evolution of the BH mass for a brief but significant period of time.
In fact, they rapidly grow in number and by
their contribution to the total BH mass is, on average, M⊙,
more than one order of magnitude larger than that of light BH seeds. Not
surprisingly, the rise of heavy seeds marks the fall of
light seeds. In fact, Ly halos with either form Pop III stars,
hence light BH seeds (when ), or form heavy seeds
(when ).
Accretion-dominated regime.
At , BH growth is dominated by gas accretion. In fact, at this epoch
the progenitor galaxies are all enriched to preventing the formation
of both light and heavy seeds. Overall, gas accretion provides the dominant contribution
to the final SMBH mass at , in agreement with Valiante et al. (2011)555
In Valiante et al. (2011) gas accretion dominates the evolution of the BH mass at .
In the present model gas accretion starts to dominate at an earlier
redshift. The difference with Valiante et al. (2011) is due to the different merger histories (which now include
mini-halos) and BH seeding prescription.. This is a consequence of the strong BH mass dependence
of the BHL accretion law, which leads to run-away BH growth.
In our reference model, a total of light and heavy seeds are formed, on average, at . However, only of these seeds ( light and heavy) are BH progenitors, because a dominant fraction is lost along minor branches of the merger tree and become satellites.
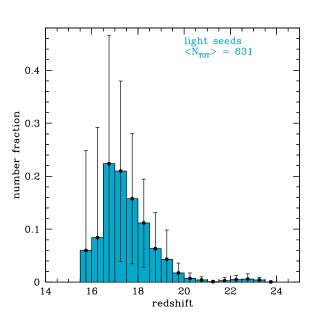
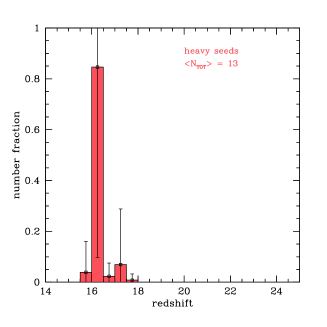
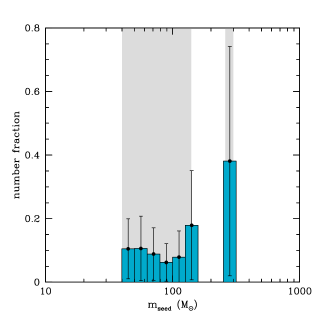
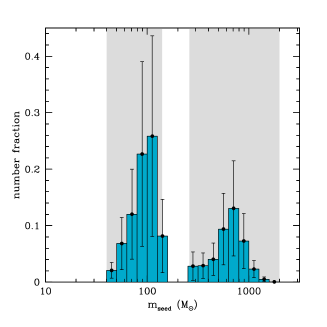
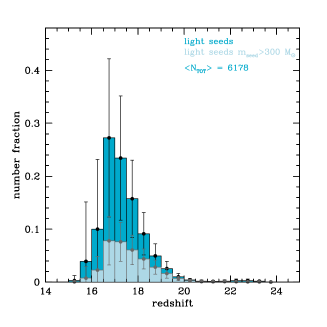
In Fig. 4 we show the BH progenitor formation redshifts and birth masses. Light BH seeds start forming at although their number increases considerably at , with a peak at followed by a rapid decline. This redshift distribution reflects the properties of their birth environments. At the highest , light BH seeds form in mini-halos, whose star formation efficiency is low and prone to photo-dissociating feedback. Their birth mass distribution shows that the largest number of light BH seeds is concentrated in the most massive bin, with BHs ( of the total) with mass in the range , while the remaining are almost equally distributed between and (see the right panel). On the other hand, heavy seed BH progenitors form, on average, over a very narrow redshift range, at , with a peak at that is slightly shifted with respect to that of light seeds, followed by a sharp decline. This sudden appearance and decline of heavy seeds is a consequence of their tight birth environmental conditions which are satisfied only by a relatively small number of halos and over a very limited period of time, as it will be clarified in the following section.
3.2 Birth environment of SMBH seeds
The results presented in the previous section show how the mass growth of SMBHs at depends on a complex interplay between radiative and chemical feedback processes that shape the birth environment of light and heavy BH seeds. Since SMBHs at form in biased regions of the Universe, the intensity of the LW background, the volume filling factor of ionized regions and the gas metallicity, which set the relative strength of feedback processes, are expected to be different from the cosmic mean values at the same redshift.
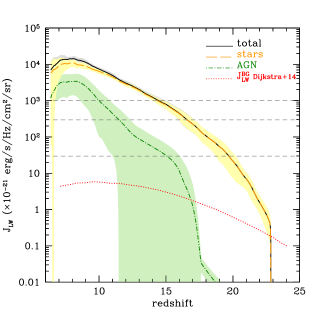
The left panel of Fig. 5 shows the relative contribution of accreting BHs (AGNs, green dot-dashed line) and stellar emission (yellow dashed line) to the LW background (black solid line). At all redshifts, the LW emission is dominated by star formation. The intensity of the LW background increases very rapidly, exceeding values of , and (marked by the horizontal lines), on average, at and , with some dispersion among different merger histories (see section 3.3). In the same figure we also show, for comparison, the cosmic mean LW background predicted by Dijkstra et al. (2014).
The central panel of Figure 5 shows the evolution of the volume filling factor of ionized regions. We find that at , consistent with the expectations from the rapid increase of the UV background intensity.
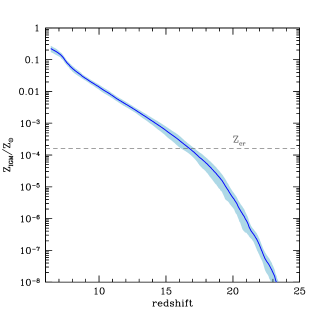
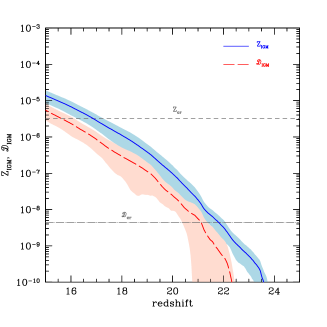
Finally, in the right panel of Figure 5 we present the redshift evolution of the metallicity of the IGM, the medium in which all halos are embedded. This metallicity, , increases as mechanical feedback, in the form of galaxy-scale winds driven by the SNe and AGNs, ejects metal-enriched gas out of the galaxies, enriching the surrounding medium. The horizontal line indicates the critical metallicity for low-mass star formation that we have adopted in the reference model, Z⊙. The average IGM metallicity exceeds this critical value at , with some dispersion among different merger histories.
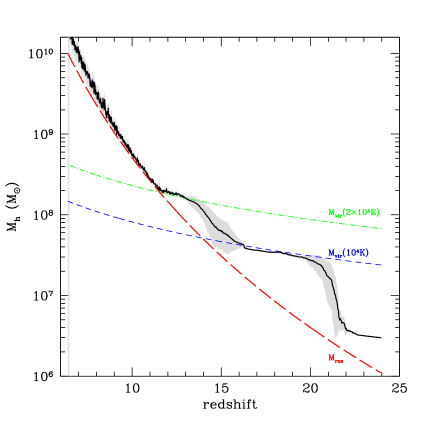
The effects of radiative feedback on the environment where light and heavy BH seeds form is summarized in Fig. 6, which shows the redshift evolution of the minimum halo mass for star formation (black solid line). At high redshifts the minimum halo mass rapidly increases as a consequence of photo-dissociating feedback, reaching the minimum mass of Ly halos (short-dashed line) already at , on average. Hence, as it was anticipated in section 3.1, the dominant fraction of light BH seeds form in Ly halos which are less vulnerable to photo-dissociating feedback. Between Ly halos with masses and sub-critical metallicity can either form light or heavy BH seeds depending on the intensity of . When the minimum mass for star formation increases as a consequence of photo-heating feedback and achieve the adopted minimum mass for star formation in ionized regions, (dot-dashed line), by , when the IGM is fully ionized. The figure also shows that the minimum mass for star formation depends on the adopted resolution mass only at , when the epoch of BH seed formation is already terminated. Hence, the results are independent of the mass resolution of the merger trees.
Finally, to quantify the effect of chemical feedback on heavy BH seeds formation, we compute their occurence ratio, defined as the number of progenitor halos which satisfy the conditions and divided by the number of progenitor halos with . When averaged over 10 independent merger histories, we find the occurrence ratio at to be , meaning that chemical feedback plays a dominant role.
3.3 Dependence on the hierarchical history
One of the advantages of a semi-analytical model is that it allows one to run independent merger tree simulations of the same quasar.
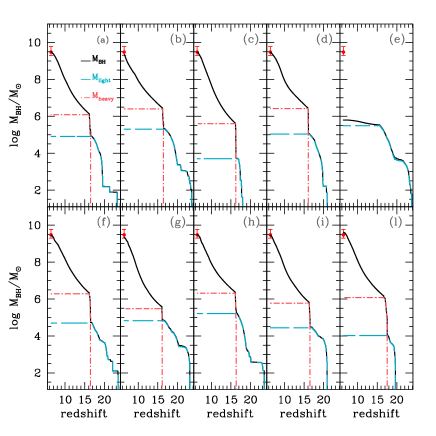
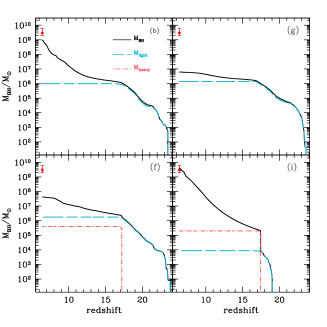
In Fig. 7 we show the evolution of the BH mass and the contribution of light and heavy seeds as a function of redshift for 10 different merger trees. In 9 out of 10 runs, the final BH mass is in very good agreement with the data. The only exception is the simulation shown in panel (e), where only light BH seeds form. This supports the conclusion that, as long as gas accretion is assumed to be Eddington-limited, heavy BH seeds are required to grow a SMBH at .
The relative contribution of light and heavy BH seeds depends on the individual merger tree. Even when light BH seeds start to form at (see panels a, b, f, g and h), their total mass does not exceed and it is comparable to the mass of one single heavy BH seed. Only between to heavy BH seeds are required to grow a SMBH by , and their total mass ranges between and .
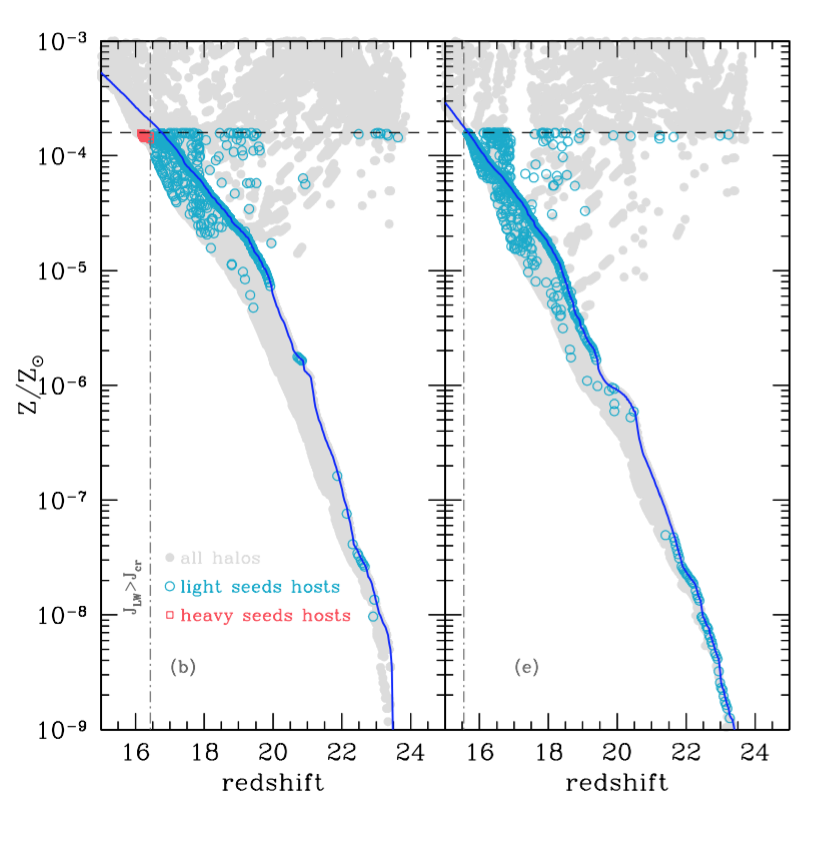
It is interesting to investigate in more details why no heavy BH seed is formed in the simulation shown in panel (e). We compare the properties of this simulation with the one shown in panel (b), which is characterized by a similar high- evolution of the light BH seeds mass. In Fig. 8 we show the metallicity of all progenitor halos in the two simulations (gray points) as a function of redshift. The solid line is the mean metallicity of the IGM and open blue circles (red squares) represent progenitor halos hosting light (heavy) BH seeds. Light BH seeds form in halos with , where the value corresponding to in the reference model is shown by the horizontal dashed line. As expected, heavy seeds form only in a small number of halos of simulation (b), where and (the redshift at which this condition is satisfied is indicated by the vertical dot-dashed line).
The redshift and metallicity distribution of progenitor halos is different in the two simulations. Newly virialized progenitor halos have the same metallicity of the IGM, while in others the metallicity can be significantly smaller or larger. At , is slightly smaller in simulation (e) and there is a smaller fraction of halos with , meaning that self-enrichment is more efficient than in simulation (b). In addition, the LW background intensity becomes larger than at a lower redshift in simulation (e), instead of . As a result, there is no single progenitor halo where the conditions for heavy BH seed formation are satisfied.
4 Discussion
The results of the reference model depend on a number of assumptions whose importance is critically discussed below.
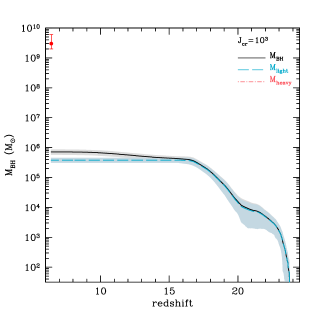
4.1 Dependence on
The critical intensity of the LW background that enables the collapse of gas in metal-poor Ly halos is still highly debated. Here we discuss the consequences of increasing to .
Although the LW background can reach very large values in the biased region that we are simulating, on average it exceeds at (see left panel in Fig. 5), when all progenitor halos have been already enriched above the critical metallicity for Pop II star formation. Ly halos with and now host Pop III star formation and no single heavy BH seed forms.
The redshift evolution of the total BH mass is shown in the left panel of Fig. 9. The growth of the BH is strongly suppressed and at . In fact, despite the larger number of light seeds at compared to the reference model ( times larger, on average), their BH masses are too small to activate efficient gas accretion, unless a much higher BH accretion efficiency () or super-Eddington accretion is assumed (Volonteri & Rees 2005; Li 2012; Alexander & Natarajan 2014; Madau et al. 2014; Pezzulli et al. 2015).
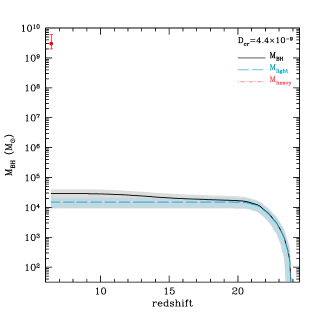
4.2 Dependence on the critical dust-to-gas ratio
In the reference model we assume that low mass Pop II stars form when the metallicity of the star forming gas reaches a critical value of Z⊙, above which metal fine-structure line cooling becomes efficient. However, semi-analytic and numerical studies suggest that gas cooling and fragmentation can be activated at a lower metallicity when dust grains are present (Schneider et al. 2002; Schneider et al. 2006; Omukai et al. 2010; Dopcke et al. 2011). Schneider et al. (2012) show that low-mass Pop II stars can form when the dust-to-gas mass ratio, , exceeds a critical value of . Moreover, a dust-driven transition is consistent with observations of the tail of the metallicity distribution function of Galactic halo stars (Schneider et al., 2012; de Bennassuti et al., 2014).
In GAMETE/QSOdust we follow dust enrichment in the ISM of all progenitor halos and we can explore the effects of dust cooling and fragmentation on the formation of Pop III stars, hence of light BH seeds, and on the direct collapse of gas onto a heavy BH seed. Following Omukai et al. (2008), we assume that when and , the gas collapses almost isothermally until the densities are large enough to activate dust cooling and fragmentatio, forming a compact Pop II stellar cluster. The middle panel of Fig. 9 shows that the effect is similar to imposing a larger LW flux critical threshold. A smaller number of light seeds is formed, heavy seed formation is suppressed, and BH growth is dramatically inefficient, leading to at . In fact, on average, dust enrichment allows most of the halos to reach the critical threshold at (see the right panel of Fig. 9), confining the formation of light seeds only in the first star forming progenitors and preventing the formation of heavy seeds, as the condition is achieved only at smaller redshifts.
This conclusion does not depend on the fate of the newly formed dust-induced compact Pop II stellar clusters. Even assuming that their dynamical evolution favors the collapse into a black hole of mass (Omukai et al., 2008; Devecchi & Volonteri, 2009; Devecchi et al., 2010, 2012), their number and mass are too small to significantly affect the BH mass growth rate.
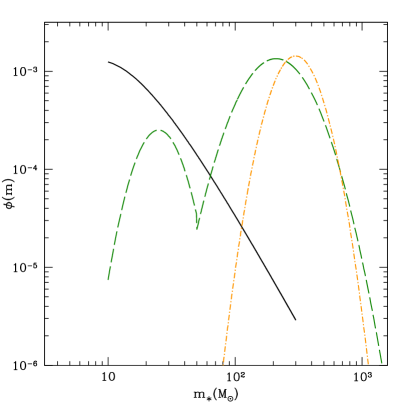
4.3 IMF of Population III stars
First attempts to predict the Pop III stellar mass spectrum ab-initio, starting from cosmological initial conditions, have been recently made through sophisticated numerical simulations (Hirano et al., 2014, 2015). According to Hirano et al. (2015), Pop III stars which form in halos exposed to a LW background intensity follow a mass distribution characterized by two peaks, at and . Conversely, only very massive () stars form when as less efficient cooling causes higher gas temperature and larger accretion rates (see Fig. 6 in Hirano et al. 2015).
In order to test the implications of this environment-dependent Pop III IMF, we approximate the mass distribution found by Hirano et al. (2015) with the analytic functions shown in Fig. 10, where the IMF are normalized to 1 in the stellar mass range (dashed and dot-dashed lines for and , respectively). For comparison, we also show the IMF adopted in the reference model (solid line). Given the shape of the new distribution, we expect a larger number of massive Pop III remnants, leading to more frequent light BH seeds with mass compared to the reference model.
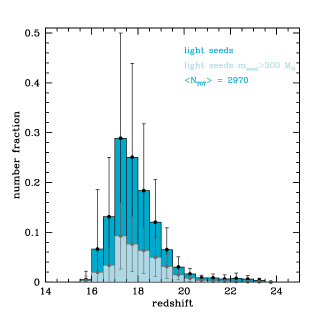
The resulting average mass and redshift distributions of light seeds are shown in the left and middle panels of Fig. 11. The two peaks of the mass distribution reflect the underlying Pop III IMF. The number of light BH seeds is times larger than in the reference model, and of these have a mass . In fact, the shape of the underlying Pop III IMF affects the star formation history at through both mechanical and chemical feedback: the larger number of stars with masses in the pair-instability SN range, (Heger & Woosley, 2002), and above leads to strong SN and AGN-driven outflows of metal-enriched gas out of the first mini-halos. The integrated effect of this feedback-regulated star formation rate along the hierarchical evolution is to decrease the metallicity of gas-poor star forming progenitors - favoring the formation of a larger number of Pop III BH remnants - and the LW emissivity, hence the intensity of the LW background. As a result, the condition is met at lower compared to the reference model, when most of the Ly halos have already been enriched above the critical metallicity and the formation of heavy seeds is suppressed in 7 out of 10 merger trees.
In these conditions, the BH mass growth at is very sensitive to the amount of leftover gas from winds in progenitor systems. In the right panel of Fig. 11 we show the BH mass growth and the contribution of light and heavy seeds as a function of redshift for 4 different merger tree simulations. In the top panels, we show the results for the same (b) and (g) merger tree realizations presented in Fig. 7. Despite no heavy seed is formed, at in simulation (b), only a factor of a few smaller than the observed value. Although the total BH mass contributed by light seeds is similar, gas accretion is less efficient in simulation (g) and the final BH mass is significantly smaller. In the bottom panel, we show the results of two simulations where, despite a comparable number of heavy seeds forms, the final BH mass at differs by almost two orders of magnitude. In simulation (f), a large number of light BH seeds forms over the redshift range . Gas depletion in their progenitor galaxies due to AGN feedback causes a lower average accretion rate at and the BH mass at is only . On the contrary, the small number of light BH seeds formed in simulation (i) at does not significantly affect the gas content of progenitor galaxies and gas accretion at can be efficient enough to form a SMBH at , with a mass consistent with the data.
4.4 Dynamics of light BH seeds
In the reference model, we assume that only the most massive Pop III remnant form a light BH seed that settles at the galaxy center accreting gas from the surrounding medium. To test the effect of this assumption, here we investigate the opposite, extreme scenario and we allow all BH remnants to merge and form a single more massive light BH seed that migrates at the center of the galaxy. The underlying assumption is that the merging timescale is shorter than the characteristic timestep of the simulation, and that dynamical effects, such as 3-body scattering (Miller & Hamilton, 2002; Gültekin et al., 2006) and gravitational recoil (Haiman, 2004; Shapiro, 2005; Volonteri & Rees, 2006) are not ejecting the merging BHs. Regarding 3-body scattering, we can rescale the results by Gültekin et al. (2004; 2006) and Miller & Lauburg (2009), while for the gravitational recoil we can use the Monte Carlo sampling of recoil velocities in Volonteri et al. (2010). In general, the potential well of the halo becomes sufficiently massive to retain merging and scattering BHs only when the halo mass is . This is because most of the merging BHs have mass ratio between 1:6 and 1:1, where the recoil velocity is typically km/s for random spin magnitudes and configurations. Similarly, 3-body scattering appears to cease to be effective in ejecting BHs when the escape velocity becomes km/s. We note, however, that sudden gas inflows, triggered by mergers or collimated gas streams from the cosmic web, can temporarily deepen the potential well and allow mergers and 3-body scattering to occur (Davies et al., 2011; Lupi et al., 2014). We will in the following assume, optimistically, that all formed BHs can merge, but in reality we expect that only a fraction of them can be retained, and this fraction increases with the mass of the host halo.
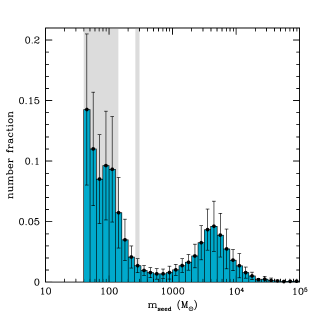
The resulting mass and redshift distribution of light seeds is shown in the left and middle panels of Fig. 12, respectively. As expected, the mass spectrum of light seeds now extends well beyond , the maximum BH remnant mass for the adopted Pop III IMF. Less massive, more numerous, light seeds () form in less efficient star forming halos, while more massive light seeds () are the result of the coalescence of several (from few to hundreds) Pop III remnants formed in more efficient star forming halos. Interestingly, there is a tail of the mass distribution that extends up to , showing that few light seeds may reach a mass comparable to that of heavy seeds.
The redshift distribution of light seeds is fairly independent of their mass, as shown by the two histograms in the middle panel of Fig. 12. Compared with the analogous plot for the reference model shown in Fig. 4, a much larger number of light seeds is formed. This is a consequence of the stronger feedback induced by more massive BHs on their host galaxy. In the shallow potential wells of small halos at high redshift, BH feedback is able to unbind most - if not all - of the gas. As a result, the ISM metallicity remains below the critical value for a longer period of time, leading to a prolonged phase of Pop III star and light BH seeds formation.
The effect on the BH mass growth rate is shown in the right panel of Fig. 12. In this case, the contribution of light seeds exceeds that of heavy seeds, which is smaller (by a factor ) than in the reference model, and triggers a faster and more efficient growth. The BH mass exceeds at and reaches a final value of at , a factor of 20 larger than in the reference model.
5 Conclusions
We have investigated the origin of SMBHs at applying a largely improved version of the semi-analytical model GAMETE/QSOdust. In this work we explore the relative role of light BH seeds, formed as remnants of massive Pop III stars, and heavy BH seeds, formed by the direct collapse of gas, in the formation pathway to the first SMBHs.
To this aim, we have implemented a physically motivated prescription to estimate the cold gas mass fraction in mini-halos, taking into account molecular and metal fine-structure cooling and the photo-dissociation of in the presence of an external LW background. We then follow the subsequent evolution of the BHs and their host galaxies along the hierarchical history of a halo with a mass of . The free parameters of the model, such as the accretion efficiency entering in the formulation of Eddington-limited Bondi accretion, the AGN wind efficiency, the efficiency of quiescent and merger-driven star formation, have been fixed to reproduce the observed properties of SDSS J1148. Simulating different merger trees of the same halo, we compute the intensity of the LW background, accounting for the contribution of stars and accreting BHs, the filling factor of ionized regions, the metal and dust enrichment in and outside the progenitor galaxies, to explore if and when heavy BH seeds can form in metal-poor Lyman- halos exposed to a strong LW background.
In the reference model, where we assume that Pop III stars form in progenitor galaxies with Z⊙ according to a Larson IMF in the mass range , a small number of light BH seeds are hosted in mini-halos at before radiative feedback is able to suppress cooling. The dominant fraction of light BH seeds form in Lyman- cooling halos at , before the intensity of the LW background becomes larger than allowing the direct collapse of gas and the formation of heavy seeds. In these conditions, we find that in 9 out of 10 merger tree simulations between 3 to heavy seeds are able to form before metals have enriched all the progenitor galaxies to and low-mass Pop II stars form. We find that:
-
•
The growth of SMBHs relies on heavy seeds. The only simulation where the interplay between chemical and radiative feedback effects prevents the formation of heavy seeds predicts a final BH mass of .
-
•
The above result dramatically depends on the assumed values of and . A larger value of () or a Pop III/Pop II transition driven by dust-cooling at a critical dust-to-gas ratio of prevents the formation of heavy seeds, hampering the mass growth of the nuclear BH so that its final mass at is in all the merger tree simulations.
-
•
The relative importance of heavy and light BH seeds depends on the adopted IMF of Pop III stars, as this affects the history of cold gas along the merger tree by means of SN and AGN-driven winds.
-
•
As long as gas accretion is assumed to be Eddington-limited, the mass of individual BH seeds is the key condition to trigger SMBH growth. If all BH remnants merge before settling to the center of their progenitor galaxy, the mass distribution of light BH seeds extends to . In these conditions, gas accretion is so efficient that by the SMBH mass is - on average - and the evolution is completely dominated by light BH seeds.
We conclude that the formation of a BH at depends on a complex interplay of feedback processes, where the mass and redshift distribution of both light and heavy seeds have a fundamental role. The first SMBHs can grow by Eddington-limited accretion only if sufficiently massive BH seeds are able to form in their progenitor galaxies. This can be achieved by means of Pop III BH remnants (light seeds) if Pop III stars form with or if smaller mass BH remnants merge to form a single, more massive BH. Alternatively, even a few heavy seeds with mass can provide the right “head-start”, but their formation requires favourable conditions that can only be achieved if and Z⊙. Since is lower than required by 3D cosmological simulations of the collapse of primordial clouds, alternative models of direct collapse driven by dynamical processes should be kept in mind (e.g. Loeb & Rasio 1994; Eisenstein & Loeb 1995; Begelman et al. 2006; Mayer et al. 2007; Volonteri & Begelman 2010).
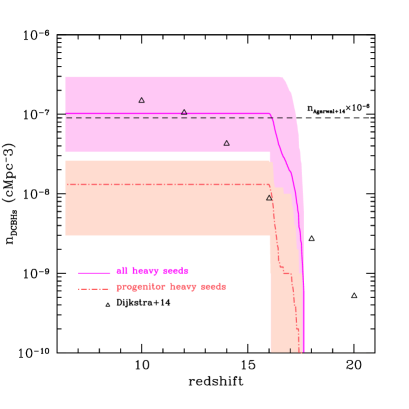
In our reference model, where the formation of a SMBH relies on heavy seeds, the number of heavy seeds progenitors varies between 3 and 27 among the different merger tree simulations, with an average number of 13. If we weight these numbers by the observed comoving density of quasars at , , we can predict the comoving number density of direct collapse BHs (DCBHs). This is shown in Fig. 13, where we compare the results of our reference model with other studies. We find that by the comoving number density of DCBH is . We clarify that these numbers refer to heavy BH seeds progenitors of SMBHs at . In the same reference model, a much larger population of direct collapse BHs form ( on average) which - however - end up as satellites and do not directly contribute to the mass growth of the SMBH. For these enlarged population, the comoving number density that we predict is , in very good agreement with the results of Dijkstra et al. (2014) for their fiducial model. A much larger value has been found by Agarwal et al. (2014), who report potential DCBH hosts in their 4 cMpc size simulation box at , leading to an estimated comoving number density of . As already noted by Dijkstra et al. (2014), the main reason for this discrepancy is that Agarwal et al. (2014) adopts a . No DCBH would form in their box if were to be assumed (see the bottom panel of their Fig. 1).
Compared to these previous analyses, our study allows to identify BH seeds that are the progenitors of the first SMBHs, and to study the conditions that allow these BH seeds to germinate.
Acknowledgments
We thank the anonymous referee for useful comments and suggestions. The research leading to these results has received funding from the European Research Council under the European Union’s Seventh Framework Programme (FP/2007-2013) / ERC Grant Agreement n. 306476. This work is supported in part by the Grant-in-Aid from the Ministry of Education, Culture, Sports, Science and Technology (MEXT) of Japan (25287040 KO).
Appendix A Halo gas cooling efficiency
In each dark matter halo, the fraction of gas mass that is able to cool is set by the balance between the cooling time and the dynamical time. Here we adopt a procedure similar to that presented in Madau et al. (2001).
We compute the free-fall time as,
| (9) |
where is the escape velocity ( is the infall velocity of a test particle at rest at ), dark matter halos are assumed to have a NFW density profile with concentration parameter , and the gas follows an isothermal gas density distribution (see eqs. 9, 18 and 21 in Madau et al. 2001).
The cooling time is defined as,
| (10) |
where is Boltzmann’s constant, is the gas number density and is the density and metallicity dependent cooling rate per unit volume.
The parameter introduced in section 2.3 is defined as the ratio between the gas mass within a radius such that and the total gas mass within the virial radius.
In Lyman- halos, even in primordial conditions the gas can efficiently cool by means of H and He transitions. Hence, we assume that in these systems and the SFR is only limited by the infall rate (see eq. 7)666This condition is strictly true only at for halos with K. In fact, above this temperature and in primordial conditions the cooling rate is dominated by free-free emission. Here we assume for all Lyman- halos because most of these larger virial temperatures (mass) halos are already metal-enriched when they first appear along the merger tree and therefore the cooling rate is dominated by highly ionized metal species (Sutherland & Dopita, 1993)..
In mini-halos the cooling time
can be longer than the free-fall time at most radii, so that . The
exact value of this parameter depends on the virial temperature, redshift (hence halo mass) and metallicity of
the gas. The cooling rate is computed considering a simplified version of the chemical evolution model of
Omukai (2012) that we describe below.
Cooling and heating processes:
To compute the cooling rate we consider the following physical processes: H Ly
emission (), H2 rovibrational emission (), and CII and OI
fine-structure line emission (, ). Photoelectric emission
by dust () is also taken onto account as it provides an important heating process when
the medium is dust enriched and in the presence of a far UV (FUV) background (Wolfire et al. 1995). For
simplicity, we assume the same spectral shape in the Galactic ISM and we take the Habing parameter for
the FUV to be . Hence, the total cooling rate is computed as:
| (11) |
Ionization degree:
The post-recombination leftover electron fraction is . Following
virialization, the ionization degree can increase due to collisional ionization:
| (12) |
followed by radiative recombination:
| (13) |
Hence, the ionization fraction reaches an equilibrium value given by:
| (14) |
In the model, we take the ionization degree to be and the
atomic hydrogen fraction as because the molecular fraction is always .
Molecular fraction:
Molecular hydrogen can form from the gas phase via the H- channel:
| (15) | |||
| (16) |
or on the surface of dust grains. In one free-fall time, the H2 fraction formed can be approximated as:
| (17) |
where is the formation rate via the H- channel, is the formation rate on dust grains, and the recombination time is:
| (18) |
In the presence of a LW background, the fraction reaches an equlibrium value given by (Anders & Grevesse, 1989):
| (19) |
where is the dissociation coefficient and it is calculated considering the self-shielding factor as is
Wolcott-Green et al. (2011). In the model, we take the fraction to be .
Metal fractions:
For simplicity, at each given metallicity all the carbon atoms are assumed to be in CII and the oxygen atoms in OI,
with an elemental abundance given by:
| (20) |
When dust grains are present, we account for partial depletion of these two elements on dust grains and we assume an elemental fraction of (Pollack et al., 1994):
| (21) |
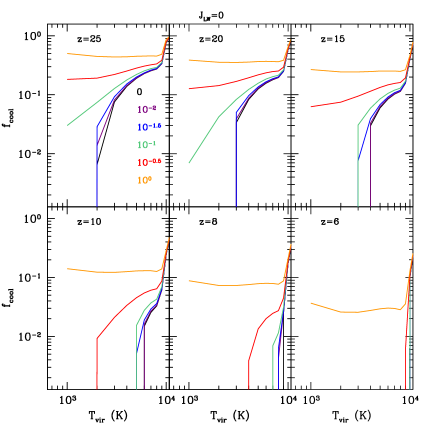
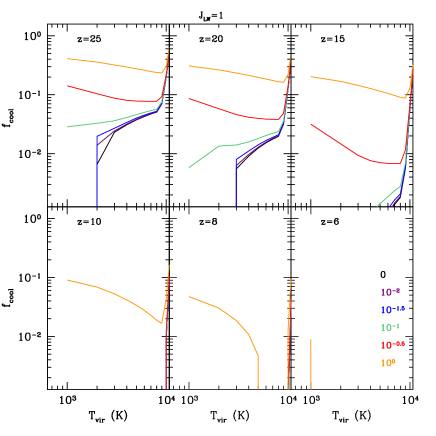
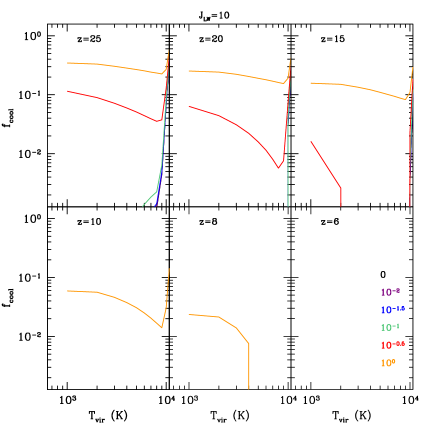
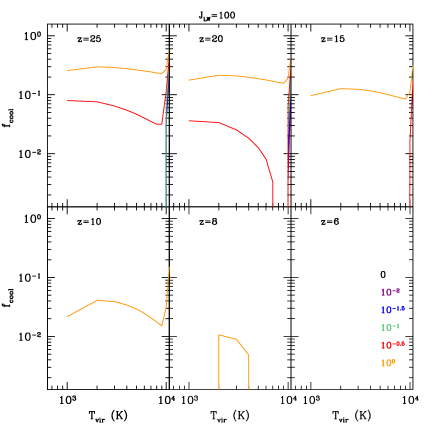
Using the above prescription we run a large set of models, changing the virial temperature, redshift, gas metallicity, and the value of the external LW background, and we compute the corresponding . The results are summarized in Figs. 14-17. When , is a strong function of . In the absence of a LW background (see Fig.14), drops from to in the temperature range , followed by a smoother decline to at . Even in these favourable conditions (no dissociation), for a fixed strongly depends on redshift. This reflects the density dependence of the cooling rate, which - for the same physical conditions - leads to a shorter cooling time at high redshift. This result holds even when the gas metallicity is . Significant deviations from the primordial case require a metallicity of Z⊙ at , of Z⊙ at , of Z⊙ at . Finally at we find that - independently of the gas metallicity - gas cooling in mini-halos is suppressed.
Figs.15-17 show how the above results change when the intensity of the LW background ranges between . As expected, the largest effect is in the behaviour of the Z⊙ gas, which can cool only if and .
References
- Abel et al. (2002) Abel T., Bryan G. L., Norman M. L., 2002, Science, 295, 93
- Agarwal et al. (2014) Agarwal B., Dalla Vecchia C., Johnson J. L., Khochfar S., Paardekooper J.-P., 2014, MNRAS, 443, 648
- Agarwal et al. (2012) Agarwal B., Khochfar S., Johnson J. L., Neistein E., Dalla Vecchia C., Livio M., 2012, MNRAS, 425, 2854
- Agarwal et al. (2015) Agarwal B., Smith B., Glover S., Natarajan P., Khochfar S., 2015, arXiv:1504.04042
- Ahn et al. (2009) Ahn K., Shapiro P. R., Iliev I. T., Mellema G., Pen U.-L., 2009, ApJ, 695, 1430
- Alexander & Natarajan (2014) Alexander T., Natarajan P., 2014, Science, 345, 1330
- Anders & Grevesse (1989) Anders E., Grevesse N., 1989, Geochim. Cosmochim. Acta, 53, 197
- Barkana & Loeb (1999) Barkana R., Loeb A., 1999, ApJ, 523, 54
- Barth et al. (2003) Barth A. J., Martini P., Nelson C. H., Ho L. C., 2003, ApJ, 594, L95
- Begelman et al. (2006) Begelman M. C., Volonteri M., Rees M. J., 2006, MNRAS, 370, 289
- Bromm (2013) Bromm V., 2013, Reports on Progress in Physics, 76, 112901
- Bromm et al. (2001) Bromm V., Ferrara A., Coppi P. S., Larson R. B., 2001, MNRAS, 328, 969
- Bromm & Loeb (2003) Bromm V., Loeb A., 2003, ApJ, 596, 34
- Bruzual & Charlot (2003) Bruzual G., Charlot S., 2003, MNRAS, 344, 1000
- Ciardi et al. (2000) Ciardi B., Ferrara A., Abel T., 2000, ApJ, 533, 594
- Cicone et al. (2015) Cicone C., Maiolino R., Gallerani S., Neri R., Ferrara A., Sturm E., Fiore F., Piconcelli E., Feruglio C., 2015, A&A, 574, A14
- Davies et al. (2011) Davies M. B., Miller M. C., Bellovary J. M., 2011, ApJ, 740, L42
- de Bennassuti et al. (2015) de Bennassuti M., Salvadori S., Schneider R., Valiante R., Omukai K., 2015, in prep
- de Bennassuti et al. (2014) de Bennassuti M., Schneider R., Valiante R., Salvadori S., 2014, MNRAS, 445, 3039
- De Rosa et al. (2011) De Rosa G., Decarli R., Walter F., Fan X., Jiang L., Kurk J., Pasquali A., Rix H. W., 2011, ApJ, 739, 56
- De Rosa et al. (2014) De Rosa G., Venemans B. P., Decarli R., Gennaro M., Simcoe R. A., Dietrich M., Peterson B. M., Walter F., Frank S., McMahon R. G., Hewett P. C., Mortlock D. J., Simpson C., 2014, ApJ, 790, 145
- Devecchi & Volonteri (2009) Devecchi B., Volonteri M., 2009, ApJ, 694, 302
- Devecchi et al. (2010) Devecchi B., Volonteri M., Colpi M., Haardt F., 2010, MNRAS, 409, 1057
- Devecchi et al. (2012) Devecchi B., Volonteri M., Rossi E. M., Colpi M., Portegies Zwart S., 2012, MNRAS, 421, 1465
- Di Matteo et al. (2005) Di Matteo T., Springel V., Hernquist L., 2005, Nature, 433, 604
- Dijkstra et al. (2014) Dijkstra M., Ferrara A., Mesinger A., 2014, MNRAS, 442, 2036
- Dijkstra et al. (2008) Dijkstra M., Haiman Z., Mesinger A., Wyithe J. S. B., 2008, MNRAS, 391, 1961
- Dopcke et al. (2011) Dopcke G., Glover S. C. O., Clark P. C., Klessen R. S., 2011, ApJ, 729, L3
- Eisenstein & Loeb (1995) Eisenstein D. J., Loeb A., 1995, ApJ, 443, 11
- Fan et al. (2004) Fan X., Hennawi J. F., Richards G. T., Strauss M. A., Schneider D. P., Donley J. L., Young J. E., Annis e. a., 2004, AJ, 128, 515
- Fan et al. (2001) Fan X., Narayanan V. K., Lupton R. H., Strauss M. A., Knapp G. R., Becker R. H., White R. L., Pentericci L., Leggett S. K., Haiman Z. e. a., 2001, AJ, 122, 2833
- Ferrara et al. (2014) Ferrara A., Salvadori S., Yue B., Schleicher D., 2014, MNRAS, 443, 2410
- Glover (2013) Glover S., 2013, in Wiklind T., Mobasher B., Bromm V., eds, Astrophysics and Space Science Library Vol. 396 of Astrophysics and Space Science Library, The First Stars. p. 103
- Glover (2015a) Glover S. C. O., 2015a, MNRAS, 451, 2082
- Glover (2015b) Glover S. C. O., 2015b, MNRAS, 453, 2901
- Gültekin et al. (2004) Gültekin K., Miller M. C., Hamilton D. P., 2004, ApJ, 616, 221
- Gültekin et al. (2006) Gültekin K., Miller M. C., Hamilton D. P., 2006, ApJ, 640, 156
- Haardt & Madau (1996) Haardt F., Madau P., 1996, ApJ, 461, 20
- Haiman (2004) Haiman Z., 2004, ApJ, 613, 36
- Haiman et al. (2000) Haiman Z., Abel T., Rees M. J., 2000, ApJ, 534, 11
- Haiman & Loeb (1997) Haiman Z., Loeb A., 1997, ApJ, 483, 21
- Haiman et al. (1997a) Haiman Z., Rees M. J., Loeb A., 1997a, ApJ, 476, 458
- Haiman et al. (1997b) Haiman Z., Rees M. J., Loeb A., 1997b, ApJ, 476, 458
- Haiman et al. (1996) Haiman Z., Thoul A. A., Loeb A., 1996, ApJ, 464, 523
- Hartwig et al. (2015) Hartwig T., Glover S. C. O., Klessen R. S., Latif M. A., Volonteri M., 2015, MNRAS, 452, 1233
- Heger et al. (2003) Heger A., Fryer C. L., Woosley S. E., Langer N., Hartmann D. H., 2003, ApJ, 591, 288
- Heger & Woosley (2002) Heger A., Woosley S. E., 2002, ApJ, 567, 532
- Hirano et al. (2015) Hirano S., Hosokawa T., Yoshida N., Omukai K., Yorke H. W., 2015, MNRAS, 448, 568
- Hirano et al. (2014) Hirano S., Hosokawa T., Yoshida N., Umeda H., Omukai K., Chiaki G., Yorke H. W., 2014, ApJ, 781, 60
- Hosokawa et al. (2012) Hosokawa T., Omukai K., Yorke H. W., 2012, ApJ, 756, 93
- Hosokawa et al. (2011) Hosokawa T., Omukai K., Yoshida N., Yorke H. W., 2011, Science, 334, 1250
- Hosokawa et al. (2013) Hosokawa T., Yorke H. W., Inayoshi K., Omukai K., Yoshida N., 2013, ApJ, 778, 178
- Inayoshi & Haiman (2014) Inayoshi K., Haiman Z., 2014, MNRAS, 445, 1549
- Inayoshi & Omukai (2011) Inayoshi K., Omukai K., 2011, MNRAS, 416, 2748
- Inayoshi & Omukai (2012) Inayoshi K., Omukai K., 2012, MNRAS, 422, 2539
- Inayoshi et al. (2014) Inayoshi K., Omukai K., Tasker E., 2014, MNRAS, 445, L109
- Inayoshi & Tanaka (2015) Inayoshi K., Tanaka T. L., 2015, MNRAS, 450, 4350
- Johnson et al. (2014) Johnson J. L., Whalen D. J., Agarwal B., Paardekooper J.-P., Khochfar S., 2014, MNRAS, 445, 686
- Johnson et al. (2012) Johnson J. L., Whalen D. J., Fryer C. L., Li H., 2012, ApJ, 750, 66
- Johnson et al. (2013) Johnson J. L., Whalen D. J., Li H., Holz D. E., 2013, ApJ, 771, 116
- Katz et al. (2015) Katz H., Sijacki D., Haehnelt M. G., 2015, MNRAS, 451, 2352
- Larson (1998) Larson R. B., 1998, MNRAS, 301, 569
- Latif et al. (2014) Latif M. A., Bovino S., Van Borm C., Grassi T., Schleicher D. R. G., Spaans M., 2014, MNRAS, 443, 1979
- Latif et al. (2014) Latif M. A., Schleicher D. R. G., Bovino S., Grassi T., Spaans M., 2014, ApJ, 792, 78
- Latif et al. (2013a) Latif M. A., Schleicher D. R. G., Schmidt W., Niemeyer J., 2013a, MNRAS, 433, 1607
- Latif et al. (2013b) Latif M. A., Schleicher D. R. G., Schmidt W., Niemeyer J. C., 2013b, MNRAS, 436, 2989
- Latif & Volonteri (2015) Latif M. A., Volonteri M., 2015, MNRAS, 452, 1026
- Li (2012) Li L.-X., 2012, MNRAS, 424, 1461
- Loeb & Rasio (1994) Loeb A., Rasio F. A., 1994, ApJ, 432, 52
- Lupi et al. (2014) Lupi A., Colpi M., Devecchi B., Galanti G., Volonteri M., 2014, MNRAS, 442, 3616
- Machacek et al. (2001) Machacek M. E., Bryan G. L., Abel T., 2001, ApJ, 548, 509
- Madau et al. (2001) Madau P., Ferrara A., Rees M. J., 2001, ApJ, 555, 92
- Madau et al. (2014) Madau P., Haardt F., Dotti M., 2014, ApJ, 784, L38
- Madau & Rees (2001) Madau P., Rees M. J., 2001, ApJ, 551, L27
- Maiolino et al. (2012) Maiolino R., Gallerani S., Neri R., Cicone C., Ferrara A., Genzel R., Lutz D., Sturm E., Tacconi L. J., Walter F., Feruglio C., Fiore F., Piconcelli E., 2012, MNRAS, 425, L66
- Mayer et al. (2007) Mayer L., Kazantzidis S., Madau P., Colpi M., Quinn T., Wadsley J., 2007, Science, 316, 1874
- Miller & Hamilton (2002) Miller M. C., Hamilton D. P., 2002, MNRAS, 330, 232
- Miller & Lauburg (2009) Miller M. C., Lauburg V. M., 2009, ApJ, 692, 917
- Mortlock et al. (2011) Mortlock D. J., Warren S. J., Venemans B. P., Patel M., Hewett P. C., McMahon R. G., Simpson C., Theuns T., Gonzáles-Solares E. A., Adamson A., Dye S., Hambly N. C., Hirst P., Irwin M. J., Kuiper E., Lawrence A., Röttgering H. J. A., 2011, Nature, 474, 616
- Oh & Haiman (2002) Oh S. P., Haiman Z., 2002, ApJ, 569, 558
- Omukai (2001) Omukai K., 2001, ApJ, 546, 635
- Omukai (2012) Omukai K., 2012, PASJ, 64, 114
- Omukai et al. (2010) Omukai K., Hosokawa T., Yoshida N., 2010, ApJ, 722, 1793
- Omukai & Nishi (1999) Omukai K., Nishi R., 1999, ApJ, 518, 64
- Omukai et al. (2008) Omukai K., Schneider R., Haiman Z., 2008, ApJ, 686, 801
- Omukai et al. (2005) Omukai K., Tsuribe T., Schneider R., Ferrara A., 2005, ApJ, 626, 627
- Petri et al. (2012) Petri A., Ferrara A., Salvaterra R., 2012, MNRAS, 422, 1690
- Pollack et al. (1994) Pollack J. B., Hollenbach D., Beckwith S., Simonelli D. P., Roush T., Fong W., 1994, ApJ, 421, 615
- Rees (1978) Rees M. J., 1978, The Observatory, 98, 210
- Regan et al. (2014) Regan J. A., Johansson P. H., Wise J. H., 2014, ApJ, 795, 137
- Ricotti et al. (2001) Ricotti M., Gnedin N. Y., Shull J. M., 2001, ApJ, 560, 580
- Salvadori & Ferrara (2009) Salvadori S., Ferrara A., 2009, MNRAS, 395, L6
- Salvadori & Ferrara (2012) Salvadori S., Ferrara A., 2012, MNRAS, 421
- Salvadori et al. (2008) Salvadori S., Ferrara A., Schneider R., 2008, MNRAS, 386, 348
- Salvadori et al. (2007) Salvadori S., Schneider R., Ferrara A., 2007, MNRAS, 381, 647
- Salvadori et al. (2015) Salvadori S., Skúladóttir Á., Tolstoy E., 2015, MNRAS, 454, 1320
- Salvadori et al. (2014) Salvadori S., Tolstoy E., Ferrara A., Zaroubi S., 2014, MNRAS, 437, L26
- Sazonov et al. (2004) Sazonov S. Y., Ostriker J. P., Sunyaev R. A., 2004, MNRAS, 347, 144
- Schaerer (2002) Schaerer D., 2002, A&A, 382, 28
- Schneider et al. (2002) Schneider R., Ferrara A., Natarajan P., Omukai K., 2002, ApJ, 571, 30
- Schneider et al. (2003) Schneider R., Ferrara A., Salvaterra R., Omukai K., Bromm V., 2003, Nature, 422, 869
- Schneider et al. (2012) Schneider R., Omukai K., Bianchi S., Valiante R., 2012, MNRAS, 419, 1566
- Schneider et al. (2006) Schneider R., Omukai K., Inoue A. K., Ferrara A., 2006, MNRAS, 369, 1437
- Schneider et al. (2012) Schneider R., Omukai K., Limongi M., Ferrara A., Salvaterra R., Chieffi A., Bianchi S., 2012, MNRAS, 423, L60
- Shakura & Sunyaev (1973) Shakura N. I., Sunyaev R. A., 1973, A&A, 24, 337
- Shang et al. (2010) Shang C., Bryan G. L., Haiman Z., 2010, MNRAS, 402, 1249
- Shapiro et al. (2004) Shapiro P. R., Iliev I. T., Raga A. C., 2004, MNRAS, 348, 753
- Shapiro (2005) Shapiro S. L., 2005, ApJ, 620, 59
- Sobacchi & Mesinger (2013) Sobacchi E., Mesinger A., 2013, MNRAS, 432, 3340
- Spaans & Silk (2006) Spaans M., Silk J., 2006, ApJ, 652, 902
- Sugimura et al. (2015) Sugimura K., Coppola C. M., Omukai K., Galli D., Palla F., 2015, arXiv:1509.04562
- Sugimura et al. (2014) Sugimura K., Omukai K., Inoue A. K., 2014, MNRAS, 445, 544
- Susa et al. (2014) Susa H., Hasegawa K., Tominaga N., 2014, ApJ, 792, 32
- Sutherland & Dopita (1993) Sutherland R. S., Dopita M. A., 1993, ApJS, 88, 253
- Tanaka & Haiman (2009) Tanaka T., Haiman Z., 2009, ApJ, 696, 1798
- Valiante et al. (2012) Valiante R., Schneider R., Maiolino R., Salvadori S., Bianchi S., 2012, MNRAS, 427, L60
- Valiante et al. (2011) Valiante R., Schneider R., Salvadori S., Bianchi S., 2011, MNRAS, 416, 1916
- Valiante et al. (2014) Valiante R., Schneider R., Salvadori S., Gallerani S., 2014, MNRAS, 444, 2442
- Volonteri (2010) Volonteri M., 2010, ARA&A, 18, 279
- Volonteri & Begelman (2010) Volonteri M., Begelman M. C., 2010, MNRAS, 409, 1022
- Volonteri & Bellovary (2012) Volonteri M., Bellovary J., 2012, Reports on Progress in Physics, 75, 124901
- Volonteri et al. (2010) Volonteri M., Gültekin K., Dotti M., 2010, MNRAS, 404, 2143
- Volonteri & Rees (2005) Volonteri M., Rees M. J., 2005, ApJ, 633, 624
- Volonteri & Rees (2006) Volonteri M., Rees M. J., 2006, ApJ, 650, 669
- Volonteri et al. (2015) Volonteri M., Silk J., Dubus G., 2015, ApJ, 804, 148
- Willott et al. (2003) Willott C. J., McLure R. J., Jarvis M. J., 2003, ApJ, 587, L15
- Wolcott-Green et al. (2011) Wolcott-Green J., Haiman Z., Bryan G. L., 2011, MNRAS, 418, 838
- Wu et al. (2015) Wu X.-B., Wang F., Fan X., Yi W., Zuo W., Bian F., Jiang L., McGreer I. D., Wang R., Yang J., Yang Q., Thompson D., Beletsky Y., 2015, Nature, 518, 512
- Yoshida et al. (2008) Yoshida N., Omukai K., Hernquist L., 2008, Science, 321, 669
- Yue et al. (2014) Yue B., Ferrara A., Salvaterra R., Xu Y., Chen X., 2014, MNRAS, 440, 1263