The gas mass of star-forming galaxies at
Abstract
We report a Giant Metrewave Radio Telescope (GMRT) search for Hi 21 cm emission from a large sample of star-forming galaxies at , lying in sub-fields of the DEEP2 Redshift Survey. The search was carried out by co-adding (“stacking”) the Hi 21 cm emission spectra of 857 galaxies, after shifting each galaxy’s Hi 21 cm spectrum to its rest frame. We obtain the upper limit SJy on the average Hi 21 cm flux density of the 857 galaxies, at a velocity resolution of km s-1. This yields the constraint M on the average Hi mass of the 857 stacked galaxies, the first direct constraint on the atomic gas mass of galaxies at . The implied limit on the average atomic gas mass fraction (relative to stars) is , comparable to the cold molecular gas mass fraction in similar star-forming galaxies at these redshifts. We find that the cosmological mass density of neutral atomic gas in massive star-forming galaxies at is , significantly lower than estimates in both galaxies in the local Universe and damped Lyman- absorbers at . Massive blue star-forming galaxies thus do not appear to dominate the neutral atomic gas content of the Universe at .
Subject headings:
galaxies: high-redshift — galaxies: ISM — galaxies: star formation — radio lines: galaxies1. Introduction
Over the last decade, optical and infrared studies of the so-called “deep fields” (e.g. Giavalisco et al. 2004; Scoville et al. 2007; Newman et al. 2013) have revolutionized our understanding of galaxy formation and evolution. Detailed studies of the cosmic star formation history have shown that the comoving star formation rate (SFR) density rises towards the end of epoch of reionization and peaks in the redshift range , before declining by an order of magnitude from to today (e.g. Le Floc’h et al. 2005; Hopkins & Beacom 2006; Bouwens et al. 2009). Indeed, the range is often referred to as the “epoch of galaxy assembly”, as roughly half of today’s stellar mass density was formed during this period (e.g. Reddy et al. 2008; Marchesini et al. 2009). It is also known that the nature of the galaxies undergoing star formation evolves significantly from to today, via cosmic downsizing (Cowie et al. 1996): the SFR density at is dominated by massive galaxies with high SFRs, while that at mostly arises in lower-mass systems with lower SFRs (e.g. Le Floc’h et al. 2005; Seymour et al. 2008). A tight relation (the “main sequence”) has been found between the specific SFR (sSFR) and the stellar mass of most high- star-forming galaxies (Noeske et al. 2007), while a small fraction, the starbursts, undergo far more efficient star formation than main-sequence galaxies of the same stellar mass, with sSFRs larger by an order of magnitude (e.g. Rodighiero et al. 2011).
The above remarkable recent progress in studies of stars in high- galaxies has not been mirrored in studies of the other major constituent of galaxies, the neutral gas, the fuel for the star formation. In the local Universe, this gas is best probed with emission studies in the Hi 21 cm line. Unfortunately, the weakness of the Hi 21 cm transition has meant that the highest redshift at which it has so far been detected in emission is (e.g. Catinella & Cortese 2015). In the case of the molecular component, studies of CO in emission at have indeed found evidence for massive reservoirs of molecular gas (, comparable to the stellar mass) in star-forming galaxies (e.g. Daddi et al. 2010; Tacconi et al. 2010, 2013). Unfortunately, CO is only a tracer of the bulk of the molecular gas, and the conversion factor from the CO line luminosity to molecular gas mass is known to depend on galaxy type, varying by a factor of between starburst and spiral galaxies, and by larger factors in low-metallicity galaxies (e.g. Genzel et al. 2012; Carilli & Walter 2013).
Overall, the situation today is that little is known about the neutral gas, especially the atomic component, in high- star-forming galaxies. Unfortunately, even very deep integrations with today’s best radio telescopes will only be able to detect Hi 21 cm emission from even the most massive galaxies () out to relatively low redshifts, (e.g. Verheijen et al. 2007; Fernández et al. 2013); detecting Hi 21 cm emission from individual galaxies at will need the large collecting area of the Square Kilometre Array. However, information can be obtained about the average gas properties of high- galaxies by co-adding (“stacking”) the Hi 21 cm emission signals of a large number of galaxies with known redshifts that lie within the primary beam of the radio telescope but that are too faint to be detected individually (Zwaan 2000; Chengalur et al. 2001). Such Hi 21 cm stacking can be used to infer the average Hi mass of the galaxies and the cosmological mass density in neutral gas in these systems (e.g. Lah et al. 2007; Chang et al. 2010; Delhaize et al. 2013; Rhee et al. 2013). One can also determine average properties of the galaxy sample, including the dependence of the gas mass on various attributes (e.g. SFR, stellar mass, environment, and redshift), the average Tully-Fisher relation, etc (e.g. Fabello et al. 2011, 2012; Meyer et al. 2016).
Stacking of the Hi 21 cm spectra of individual galaxies with known redshifts, obtained using radio interferometry, has so far only been carried out at low redshifts, (e.g. Lah et al. 2007, 2009; Rhee et al. 2013). This has been extended to slightly higher redshifts, , via cross-correlation of single-dish Hi 21 cm intensity maps with deep optical images (Chang et al. 2010; Masui et al. 2013). In this Letter, we report Giant Metrewave Radio Telescope (GMRT) results from the first Hi 21 cm stacking experiment at , obtaining tight constraints on the average gas mass of star-forming galaxies at .
2. The DEEP2 Survey fields
The stacking approach critically requires a large sample of galaxies with accurately known redshifts in the target field. This is a significant restriction when selecting fields for searches for Hi 21 cm emission at , as this is the “redshift desert” where the bright optical lines (e.g. H, Oii, H) that are typically used to identify galaxies are redshifted to wavelengths Å, into regions full of night-sky lines. Most spectroscopic galaxy samples in deep fields are hence dominated by galaxies at , or at . The DEEP2 Galaxy Redshift Survey is unique in this regard as its redshift coverage extends out to (Davis et al. 2003; Newman et al. 2013), due to the use of the high spectral resolution () mode of the DEIMOS spectrograph on the Keck-II Telescope, allowing the clear identification of the Oii doublet out to . The DEEP2 Survey covers four fields with a total areal coverage of 2.8 deg.2, and has yielded accurate redshifts for 38,000 massive galaxies in the redshift range (Newman et al. 2013). A few thousand galaxies lie at , for which the Hi 21 cm line is redshifted to MHz, i.e. into the GMRT 610 MHz band. This picks out the DEEP2 Survey fields as the ideal targets for a GMRT search for Hi 21 cm emission at . Three of the DEEP2 fields are of size , each consisting of three sub-fields of size , while the fourth, the Extended Groth Strip (EGS), is of size . The size of the sub-fields of the first three DEEP2 fields are well-matched to the size of the GMRT primary beam at 610 MHz, which has a full width at half maximum (FWHM) of . Hence, although the EGS has excellent ancillary multi-wavelength information, we chose to focus on the DEEP2 sub-fields 21, 22, 31/32 and 32/33 (see Newman et al. 2013), all with full spectroscopic coverage, for the present GMRT pilot survey.
3. Observations and Data Analysis
We used the GMRT 610 MHz receivers to observe the four DEEP2 sub-fields in 2011 November (sub-fields 21 and 22, with pointing centers of RA=16h48m00.0s, Dec=+34d56’00.0” and RA=16h51m00.0s, Dec=+34d56’00.0”, respectively) and 2012 October and November (pointing midway between sub-fields 31 and 32, and 32 and 33, with pointing centers of RA=23h28m00.0s, Dec=+00d09’00.0” and RA=23h32m00.0s, Dec=+00d09’00.0”, respectively). A bandwidth of 33.33 MHz, sub-divided into 512 channels, was used for all observations, with 30 antennas, and the GMRT Software Backend as the correlator. The frequency coverage was MHz in 2011 and MHz in 2012, implying a redshift coverage of and , respectively, with a velocity resolution of km s-1. The different frequency settings were used to test the possibility that radio frequency interference (RFI) might restrict the sensitivity in different parts of the GMRT 610 MHz band. Observations of 3C286 and 3C48 were used to calibrate the flux density scale, and of 0022+002 and 1609+266 to calibrate the antenna gains and bandpasses. The total on-source times on each field ranged from 500 minutes (field 32) to 804 minutes (field 22).
The data were analysed in “classic” aips, using standard procedures. For each field, after initial data editing and calibration of the antenna bandpasses and gains, the visibility data were averaged to produce a dataset of spectral resolution MHz. Accurate antenna-based gains were then derived via a self-calibration procedure, first iterating between 3-D imaging and phase-only self-calibration for a few rounds, followed by amplitude-and-phase self-calibration, 3-D imaging, and data editing. The procedure was repeated until the continuum image did not improve on additional self-calibration; the continuum root-mean-square (RMS) noise near the center of the primary beam is Jy in three of the GMRT pointings, but Jy for sub-field 22, probably due to dynamic range issues due to bright sources at or below the half-power point of the primary beam.
For each field, the task uvsub was then used to subtract the final image from the calibrated spectral-line visibilities, after which any residual continuum was subtracted via a linear fit to each visibility spectrum using the task uvlin. The residual visibilities were then shifted to the heliocentric frame, using the task cvel. Polyhedral imaging was then used, with natural weighting, to produce wide-field spectral cubes, extending beyond the FWHM of the primary beam. The angular resolution of the final spectral cubes ranges from to , corresponding to a spatial size of kpc at 111We assume a standard -cold-dark-matter (CDM) cosmology, with km s-1 Mpc-1, and (Planck Collaboration 2015)..
4. Stacking the Hi 21 cm spectra
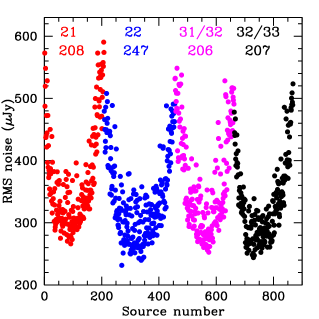
We stacked the Hi 21 cm spectra of all DEEP2 galaxies lying within the FWHM of the GMRT primary beam and with accurately known redshifts (redshift quality in the DEEP2 catalog; Newman et al. 2013) that shift the Hi 21 cm line into the observed band for each target field. We initially excluded 20 channels from each edge of the observing band, where the sensitivity is significantly lower than in the band center. Next, in order to have sufficient spectral baseline around any putative stacked spectral feature, we only considered galaxies with redshifts km s-1 from the edges of the retained frequency range. This yielded galaxies in the four GMRT pointings, with a total of 868 galaxies. Hi 21 cm spectra were obtained by taking a cut through the different spectral cubes at the location of each galaxy. A second-order baseline was fit to each spectrum and subtracted out to remove any residual curvature, and each spectrum was then scaled to account for the location of the galaxy within the GMRT primary beam. The distribution of spectral RMS noise values per km s-1 channel for the different spectra, after the above primary beam correction, is shown in Fig. 1; the RMS noise at the center of each field is Jy per km s-1 channel.
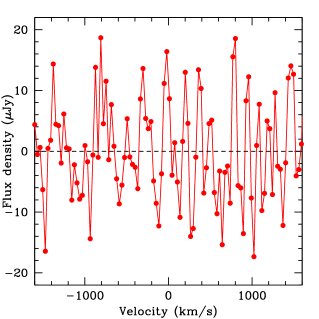
Each spectrum was tested for gaussianity, via both the Kolmogorov-Smirnov rank-1 (K-S) and Anderson-Darling (A-D) tests; 11 spectra found to have p-values in the A-D test were excluded from the stacking (note that retaining these spectra does not significantly affect our results). The Hi 21 cm spectrum for each retained galaxy was next shifted to its rest frame and then interpolated onto a single velocity axis, before the spectra of each field were optimally co-added with weights determined from their RMS noise values (after the primary beam correction; see Fig. 1) to produce the final stacked spectrum for each field. These four spectra were then co-added, again with appropriate weights based on their RMS noise values, and a second-order baseline subtracted out from the result, to produce the final stacked Hi 21 cm spectrum. This is shown in Fig. 2[A] and has an RMS noise of Jy per km s-1.
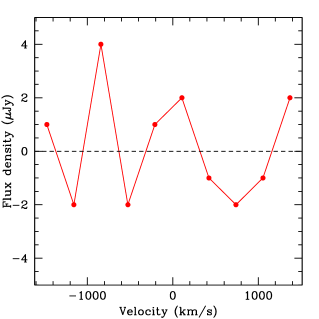
The signal-to-noise ratio in a search for line emission is maximized on smoothing the spectrum to a resolution equal to the line FWHM. We hence searched for Hi 21 cm emission in the stacked spectrum after smoothing to, and resampling at, a range of velocity resolutions from km s-1; no statistically significant feature was detected at any resolution. Fig. 2[B] shows the spectrum smoothed to, and resampled at, a resolution of km s-1; this has an RMS noise of Jy and shows no evidence for Hi 21 cm emission.
The upper limit on the strength of Hi 21 cm emission in the final spectrum at a resolution of km s-1 can be used to derive a limit on the average Hi mass of the 857 stacked galaxies. However, our estimate of the RMS noise on this spectrum is based on only 10 points. We hence used a bootstrap approach to obtain a more reliable estimate of the RMS noise on the stacked spectrum, by stacking the 857 spectra after randomizing the galaxy redshifts; this was done for 100 independent realizations and yielded an average RMS noise of Jy per km s-1 channel. This estimate of the RMS noise will be used in the later analysis.
5. Discussion and Summary
The DEEP2 galaxy sample is selected at R-band, with a limiting R-magnitude of 24.1 (Newman et al. 2013). For the median redshift of of our 857 galaxies, this corresponds to selection at a rest-frame wavelength of Å. As pointed out by Weiner et al. (2009), the high- DEEP2 sample is hence highly biased towards star-forming galaxies in the blue cloud of the galaxy color-magnitude diagram (e.g. Willmer et al. 2006). Our target galaxies are thus expected to predominantly be blue star-forming galaxies. Cooper et al. (2006) find that % of DEEP2 galaxies at all redshifts lie in clusters, with % in the field and % in small groups; the fraction of cluster galaxies is even smaller for blue, star-forming galaxies. Ram-pressure stripping of the Hi in our target galaxies (as observed in nearby clusters, e.g. Giovanelli & Haynes 1983; Verheijen et al. 2007) is thus unlikely to be a serious issue.
For the assumed CDM cosmology and the median redshift of our stacked galaxies, our non-detection of Hi 21 cm emission in the stacked spectrum of Fig. 2[B] implies the upper limit on the average Hi mass of the 857 stacked galaxies, where we have assumed a Gaussian line shape with FWHM km s-1. Note that the large spatial extent of the GMRT synthesized beam ( kpc kpc at ) implies that it is very unlikely that we are resolving out the Hi 21 cm emission. This is the first direct constraint on the atomic gas mass of star-forming galaxies at .
Stellar mass estimates are available for galaxies in two of our target fields (22 and 32) from K-band imaging (Bundy et al. 2006), with an average stellar mass of . Assuming that our other target galaxies have the same average stellar mass then gives an atomic gas mass fraction (relative to stars, and after including a factor of 1.32 to account for the contribution of helium) of , at significance. Note that Tacconi et al. (2013) used CO studies of star-forming galaxies at in the EGS to infer an average cold molecular gas fraction relative to stars of , comparable to our upper limit on the atomic gas fraction. Our results thus indicate that neutral gas in massive star-forming galaxies at is likely to be mostly in the molecular phase (e.g. Tacconi et al. 2013; Lagos et al. 2014).
Since the DEEP2 galaxies were selected uniformly in R-band as a magnitude-limited sample (Newman et al. 2013), our non-detection of Hi 21 cm emission can be used to constrain the cosmological density of neutral gas in star-forming galaxies at . The FWHM of the GMRT primary beam at 627.1 MHz (corresponding to the redshifted Hi 21 cm line frequency for ) is , implying a comoving area of Mpc Mpc. Our stacking analysis first excluded 20 edge channels, and then galaxies with redshifts km s-1 from the retained channels; this implies an effective bandwidth of MHz centered at 627.1 MHz, i.e. a comoving line-of-sight distance of 177.8 Mpc. The effective comoving volume of a single GMRT pointing is hence Mpc3. The upper limit to the cosmological mass density of Hi in star-forming galaxies is then , where is the average number of DEEP2 galaxies in a single GMRT pointing. This yields . To obtain the cosmological mass density of neutral gas in star-forming galaxies, , we include a factor of 1.32 for helium to obtain .
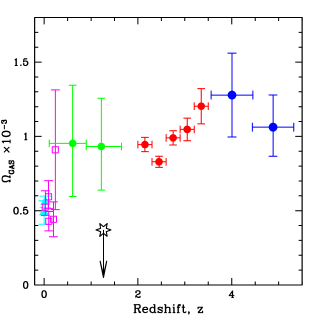
Fig. 3 plots versus redshift from a variety of measurements at different redshifts. The figure shows that our upper limit to is significantly lower (by a factor ) than the measured at both and . It thus appears that blue star-forming galaxies do not dominate the cosmological gas mass density in neutral atomic gas at .
We note that it is possible that the most Hi-rich galaxies at a given redshift do not dominate the star formation activity. For example, the “Hi monsters” of Lee et al. (2014), with Hi masses at , have SFRs /yr. Our results thus do not rule out the possibility that at is dominated by massive, low-surface brightness galaxies with low SFRs.
In summary, we have used the GMRT to carry out a search for Hi 21 cm emission at by stacking the Hi 21 cm emission signals from 857 star-forming galaxies in four DEEP2 survey fields. Our non-detection of Hi 21 cm emission in the stacked Hi 21 cm spectrum yields the upper limit on the average Hi mass of galaxies in our sample. Comparing this to the average stellar mass of DEEP2 galaxies yields the upper limit on the atomic gas mass fraction relative to stars. This is similar to the measured average cold molecular gas mass fraction in star-forming galaxies at , suggesting that the neutral gas in these galaxies may be mostly in the molecular phase. Finally, we obtain the limit on the cosmological mass density of neutral gas in star-forming galaxies at . This is significantly lower than estimates of at both and , indicating that massive blue star-forming galaxies do not dominate the gas content of the Universe during the epoch of galaxy assembly.
References
- Bouwens et al. (2009) Bouwens, R. J., Illingworth, G. D., Franx, M., et al. 2009, ApJ, 705, 936
- Bundy et al. (2006) Bundy, K., Ellis, R. S., Conselice, C. J., et al. 2006, ApJ, 651, 120
- Carilli & Walter (2013) Carilli, C. L. & Walter, F. 2013, ARA&A, 51, 106
- Catinella & Cortese (2015) Catinella, B. & Cortese, L. 2015, MNRAS, 446, 3526
- Chang et al. (2010) Chang, T.-C., Pen, U.-L., Bandura, K., & Peterson, J. B. 2010, Nature, 466, 463
- Chengalur et al. (2001) Chengalur, J. N., Braun, R., & Wieringa, M. 2001, A&A, 372, 768
- Cooper et al. (2006) Cooper, M. C., Newman, J. A., Croton, D. J., et al. 2006, MNRAS, 370, 198
- Cowie et al. (1996) Cowie, L. L., Songaila, A., Hu, E. M., & Cohen, J. G. 1996, AJ, 112, 839
- Crighton et al. (2015) Crighton, N. H. M., Murphy, M. T., Prochaska, J. X., et al. 2015, MNRAS, 452, 217
- Daddi et al. (2010) Daddi, E., Bournaud, F., Walter, F., et al. 2010, ApJ, 713, 686
- Davis et al. (2003) Davis, M., Faber, S. M., Newman, J. A., et al. 2003, Proc. SPIE 4834, 161
- Delhaize et al. (2013) Delhaize, J., Meyer, M. J., Staveley-Smith, L., & Boyle, B. J. 2013, MNRAS, 433, 1398
- Fabello et al. (2011) Fabello, S., Catinella, B., Giovanelli, R., et al. 2011, MNRAS, 411, 993
- Fabello et al. (2012) Fabello, S., Kauffmann, G., Catinella, B., et al. 2012, MNRAS, 427, 2841
- Fernández et al. (2013) Fernández, X., van Gorkom, J. H., Hess, K. M., et al. 2013, ApJL, 770, L29
- Genzel et al. (2012) Genzel, R., Tacconi, L. J., Combes, F., et al. 2012, ApJ, 746, 69
- Giavalisco et al. (2004) Giavalisco, M., Ferguson H. C., Koekemoer A. M., et al. 2004, ApJ, 600, L93
- Giovanelli & Haynes (1983) Giovanelli, R. & Haynes, M. P. 1983, AJ, 88, 881
- Hopkins & Beacom (2006) Hopkins, A. M. & Beacom, J. F. 2006, ApJ, 651, 142
- Lagos et al. (2014) Lagos, C. D. P., Baugh, C. M., Zwaan, M. A., et al. 2014, MNRAS, 440, 920
- Lah et al. (2007) Lah, P., Chengalur, J. N., Briggs, F. H., et al. 2007, MNRAS, 376, 1357
- Lah et al. (2009) Lah, P., Pracy, M. B., Chengalur, J. N., et al. 2009, MNRAS, 399, 1447
- Le Floc’h et al. (2005) Le Floc’h, E., Papovich, C., Dole, H., et al. 2005, ApJ, 632, 169
- Lee et al. (2014) Lee, C., Chung, A., Yun, M. S., et al. 2014, MNRAS, 441, 1363
- Marchesini et al. (2009) Marchesini, D., van Dokkum, P. G., Förster Schreiber, N. M., et al. 2009, ApJ, 701, 1765
- Martin et al. (2010) Martin, A. M., Papastergis, E., Giovanelli, R., et al. 2010, ApJ, 723, 1359
- Masui et al. (2013) Masui, K. W., Switzer, E. R., Banavar, N., et al. 2013, ApJ, 763, L20
- Meyer et al. (2016) Meyer, S. A., Meyer, M., Obreschkow, D., & Staveley-Smith, L. 2016, MNRAS, 455, 3136
- Neeleman et al. (2016) Neeleman, M., Prochaska, J. X., Ribaudo, J., et al. 2016, MNRAS, in press, (arxiv:1601.01691)
- Newman et al. (2013) Newman, J. A., Cooper, M. C., Davis, M., et al. 2013, ApJS, 208, 5
- Noeske et al. (2007) Noeske, K. G., Weiner, B. J., Faber, S. M., et al. 2007, ApJ, 660, L43
- Noterdaeme et al. (2012) Noterdaeme, P., Laursen, P., Petitjean, P., et al. 2012, A&A, 540, 63
- Planck Collaboration (2015) Planck Collaboration 2015, A&A, submitted (arXiv:astro-ph/1502.01589)
- Rao et al. (2006) Rao, S. M., Turnshek, D. A., & Nestor, D. B. 2006, ApJ, 636, 610
- Reddy et al. (2008) Reddy, N. A., Steidel, C. C., Pettini, M., et al. 2008, ApJS, 175, 48
- Rhee et al. (2013) Rhee, J., Zwaan, M. A., Briggs, F. H., et al. 2013, MNRAS, 435, 2693
- Rodighiero et al. (2011) Rodighiero, G., Daddi, E., Baronchelli, I., et al. 2011, ApJ, 739, L40
- Scoville et al. (2007) Scoville, N., Aussel, H., Brusa, M., et al. 2007, ApJS, 172, 1
- Seymour et al. (2008) Seymour, N., Dwelly, T., Moss, D., et al. 2008, MNRAS, 386, 1695
- Tacconi et al. (2010) Tacconi, L. J., Genzel, R., Combes, F., et al. 2010, Nature, 463, 786
- Tacconi et al. (2013) Tacconi, L. J., Neri, R., Genzel, R., et al. 2013, ApJ, 768, 74
- Verheijen et al. (2007) Verheijen, M., van Gorkom, J. H., Szomoru, A., et al. 2007, ApJ, 668, L9
- Weiner et al. (2009) Weiner, B. J., Coil, A. L., Prochaska, J. X., et al. 2009, ApJ, 692, 187
- Willmer et al. (2006) Willmer, C. N. A., Faber, S. M., Koo, D. C., et al. 2006, ApJ, 647, 853
- Zwaan (2000) Zwaan, M. A. 2000, PhD thesis, Ph.D. Thesis, Groningen: Rijksuniversiteit, 2000
- Zwaan et al. (2005a) Zwaan, M. A., Meyer, M. J., Staveley-Smith, L., & Webster, R. L. 2005a, MNRAS, 359, L30