The Eating Habits of Milky Way Mass Halos: destroyed dwarf satellites and the metallicity distribution of accreted stars
Abstract
We study the mass spectrum of destroyed dwarfs that contribute to the accreted stellar mass of Milky Way (MW) mass () halos using a suite of 45 zoom-in, dissipationless simulations. Empirical models are employed to relate (peak) subhalo mass to dwarf stellar mass, and we use constraints from observations and hydrodynamical simulations to estimate the metallicity distribution of the accreted stellar material. The dominant contributors to the accreted stellar mass are relatively massive dwarfs with . Halos with more quiescent accretion histories tend to have lower mass progenitors (), and lower overall accreted stellar masses. Ultra-faint mass () dwarfs contribute a negligible amount () to the accreted stellar mass and, despite having low average metallicities, supply a small fraction () of the very metal-poor stars with [Fe/H] . Dwarfs with masses provide a substantial amount of the very metal-poor stellar material (), and even relatively metal-rich dwarfs with can contribute a considerable fraction () of metal-poor stars if their metallicity distributions have significant metal-poor tails. Finally, we find that the generic assumption of a quiescent assembly history for the MW halo seems to be in tension with the mass spectrum of its surviving dwarfs. We suggest that the MW could be a “transient fossil”; a quiescent halo with a recent accretion event(s) that disguises the preceding formation history of the halo.
Subject headings:
Galaxy: formation — Galaxy: halo — Galaxy: stellar content — galaxies: dwarf — galaxies: interactions — Local Group1. Introduction
Dark matter halos grow hierarchically over time from the aggregation of several lower mass “subhalos”. The rate of growth, and the mass spectrum of lower mass progenitors, strongly depend on the mass of the host halo, as well as its surrounding environment. However, even at fixed halo mass, the halo-to-halo scatter is large, reflecting the breadth of different assembly histories shaping each dark matter halo. Relating the build up of cold dark matter to the growth of stellar material in galaxy halos is non-trivial; the relation between stellar and dark matter mass is highly non-linear (e.g., Conroy & Wechsler 2009; Behroozi et al. 2013c; Moster et al. 2013). For example, at low masses the relation is very steep, and it is likely that below some mass threshold star formation is completely suppressed and subhalos are simply “dark” (e.g., Bullock et al. 2000; Benson et al. 2002; Kravtsov et al. 2004).
The growth of stellar mass in Milky Way (MW) mass halos is generally dominated by intrinsic star formation in the very center of the halo. However, stars can also be accreted from the digestion of lower mass subhalos that have their own stellar populations. While this accreted component is generally lower in mass than the stars born in-situ (e.g. Behroozi et al., 2013c), the stellar material splayed out throughout the halo is a remnant of the halo’s assembly history, and provides a visual (as opposed to dark) record of the lower mass fragments that have contributed to the halo’s growth over time.
Several studies have attempted to connect the predictions of the CDM paradigm to the vast stellar halos that surround galaxies like the MW (e.g., Bullock & Johnston 2005; Purcell et al. 2007; De Lucia & Helmi 2008; Cooper et al. 2010). A general consensus from these theoretical studies is that the majority of the stellar material accreted by MW mass halos comes from early, massive accretion events. However, studies specifically focusing on the build-up of “MW-type” halos are often biased to halos with quiescent accretion histories. There is significant evidence that our Galaxy has been largely undisturbed over the past several Gyr (e.g., Gilmore et al. 2002; Hammer et al. 2007), but this bias limits our ability to understand the true breadth in assembly histories at MW mass scales, and how this relates to the mass spectrum of accreted dwarfs. Furthermore, approximately of MW mass halos likely host disk galaxies (e.g., Weinmann et al. 2006; Choi et al. 2007). Thus, while restricting to quiescent accretion histories likely excludes most elliptical galaxies undergoing recent major mergers, a significant number of halos hosting disk galaxies are likely also excluded (cf. Stewart et al. 2008). This limitation is important if we want to place our own Galaxy’s accretion history in context with other, similar mass disk galaxies.
In our own Galaxy, the chemical properties of halo stars have often been used to connect them to their progenitor galaxies. For example, the relation between [/Fe] and [Fe/H] can be linked to the host galaxy’s mass (e.g., Tolstoy et al. 2009). Halo stars are typically more -enhanced at metallicities [Fe/H] than the (classical) dwarf galaxy satellites in the MW (e.g., Tolstoy et al. 2003; Venn et al. 2004), which suggests that their progenitors are not represented in the surviving dwarf galaxy population. However, Robertson et al. (2005) (see also Font et al. 2006) showed that this mismatch in chemical properties can be reconciled if the progenitors of halo stars are biased towards early, massive accretion events, as predicted from CDM simulations. More massive progenitors have also been favored from recent observational studies. Deason et al. (2015) showed that the (relatively high) ratio of blue straggler to blue horizontal branch stars in the stellar halo favors more massive dwarfs as the “building blocks” of the stellar halo, and Fiorentino et al. (2015) found that the period and luminosity amplitudes of RR Lyrae stars in the halo are more consistent with massive dwarfs than lower-mass dwarfs.
There is a fair amount of agreement, at least qualitatively, between observations and theory that relatively massive dwarf galaxies are the dominant contributors to the overall accreted stellar material in MW mass galaxies. However, it is less clear what mass progenitors supply the majority of the very metal-poor ([Fe/H] ) material in the halo. Early studies of the metallicity distributions of the classical dwarfs found a lack of very metal-poor stars in these galaxies (e.g., Helmi et al. 2006), however a re-calibration of the Calcium ii triplet lines at low metallicities (e.g., Starkenburg et al. 2010) found that these dwarfs are not as devoid of low-metallicity stars as previously thought, and their metal-poor tails are similar to the MW halo stars. In fact, the abundance ratios of metal-poor stars in classical dwarfs are indistinguishable from the halo population (e.g., Tolstoy et al. 2009). Moreover, the “ultra-faint” dwarf galaxy population () has similar chemical properties as metal-poor halo stars (e.g., Frebel et al. 2010; Norris et al. 2010; Simon et al. 2010; Lai et al. 2011) and very low average metallicities (e.g., Kirby et al. 2013). It has been suggested that these low mass ultra-faints could be the dominant source of the very metal-poor stellar material in the MW (e.g., Frebel et al. 2010). However, cosmological models quantifying the contribution of ultra-faint mass dwarfs to the accreted stellar component of galaxies are scarce. High resolution simulations are needed to resolve down to these mass scales, and the relation between subhalo mass and stellar mass at these low-mass scales is still rather uncertain (cf. recent theoretical determinations, e.g., Garrison-Kimmel et al. 2014; Hopkins et al. 2014). Furthermore, while the abundance of low mass subhalos in dark matter only simulations is very high, it is likely that only a small fraction of these subhalos host luminous galaxies (e.g., Sawala et al. 2014).
It is clear that there is some bias in comparing the surviving dwarf galaxy population with the dwarfs that were destroyed several Gyr ago. The survivors are generally lower mass and have likely experienced more prolonged star formation than their destroyed counterparts. However, the mass spectrum of surviving satellite galaxies at the group/cluster mass-scale has often been related to the assembly histories of their halos (e.g., Conroy et al. 2007; Dariush et al. 2010; Deason et al. 2013b). For example, the “magnitude-gap” statistic, the difference in absolute magnitude between the most massive satellite galaxy and the central galaxy, is often used to distinguish old, quiescent halos (i.e., fossil groups) from groups undergoing recent major mergers. However, on galaxy scales the relation, if any, between the halo assembly histories and the mass spectrum of surviving dwarfs is relatively unexplored. Furthermore, if both the surviving and destroyed dwarfs are signposts of halo accretion histories, we should be more invested, both observationally and theoretically, in finding a link between the dwarfs that survived and those that perished.
In this contribution, we employ a suite of 45 zoom-in simulations to investigate the mass spectrum of destroyed dwarfs that contribute to the accreted stellar mass of MW mass halos. Our simulation suite spans a narrow mass range (), but has a wide range of accretion histories. This allows us to focus solely on the relation between halo assembly history and the growth of stellar mass from accreted lower mass fragments. Furthermore, the high-resolution of these zoom-in simulations allows us to study subhalos down to the ultra-faint mass dwarf scale in a fully cosmological context. The paper is arranged as follows. Section 2 describes our simulation suite and outlines how we assign stellar mass to dark matter subhalos. In Section 3 we investigate the stellar mass spectrum of destroyed dwarfs in MW mass galaxies, and relate the dominant contributors of the accreted stellar mass to the host halo assembly histories. We use constraints from observations and hydrodynamical simulations in Section 4 to predict the metallicity distribution of the accreted stellar material, and we estimate the contribution of different mass dwarfs to the metal-poor stellar component. In Section 5 we relate the most massive surviving dwarf satellite galaxies to the mass spectrum of destroyed dwarfs. Finally, we summarize our main conclusions in Section 6.
2. Simulations

We use a suite of 45 zoom-in simulations of MW mass halos (Mao et al. 2015). The halos are selected from a low-resolution dark matter only cosmological simulation (c125-1024 box) with cosmological parameters , , , , and . The low-resolution box has particles with a side length of 125 Mpc, and was run using L-Gadget (Springel et al. 2001; Springel 2005).
The selected halos fall in the narrow mass-range in the c125-1024 box. The initial conditions of the zoom-in simulations are generated using Music (Hahn & Abel 2011), and the Lagrangian volume enclosing the highest-resolution particles is set by the rectangular volume that the particles within of the halo occupied at . The mass resolution in the zoom regions is , and the softening length is 170 pc comoving. Note that the zoom-in simulations are not randomly chosen from the mass-selected sample in the c125-1024 box. The zoom-ins are slightly biased towards early forming halos, but span a wide range of accretion histories.
Dark matter subhalos are identified using the six-dimensional halo finder Rockstar (Behroozi et al. 2013a), and merger trees were constructed by Consistent Trees (Behroozi et al. 2013b) with 235 snapshots between and 19, equally spaced in logarithmic scale factor. Halos are assigned a virial mass, , and radius, , using the evolution of the virial relation from Bryan & Norman (1998). For our cosmology this corresponds to an overdensity of at . Host halos are defined as isolated halos than can host lower mass subhalos within their virial radii, and subhalos are defined as halos that are within of a more massive host halo. We compute the peak mass, of each subhalo as the maximum mass that a subhalo ever reached along the main branch of its progenitor.
2.1. Identifying Destroyed Subhalos
We trace back the progenitors of host halos at each simulation time step, and identify all progenitors that are not the most massive progenitor as the “destroyed” (sub)halos. In other words, when a (sub)halo is no longer tracked by the halo finder, it is considered “destroyed”. All other subhalos are “surviving” subhalos, i.e., those subhalos which are tracked by the halo finder down to . A cartoon illustrating our definition of “destroyed” and “surviving” subhalos is shown in Figure 1. With the above definition, it is clear that the time when a subhalo is destroyed depends on how the halo finder identifies subhalos and how the tree builder links progenitors. For example, adjusting the parameter “unbound threshold” in Rockstar would affect how long a merged, stripped subhalo is tracked. As a sanity check, we apply the iterative unbinding procedure in Rockstar developed by Griffen et al. (2015) to a high resolution (particle mass ) version of one of the host halos (Halo 937). We find that the inclusion of iterative unbinding increases the median mass-loss of subhalos with before destruction to 97% (cf. 90% for the fiducial runs). However, we find that the inclusion of this algorithm does not significantly affect our main results. Different halo finders and tree builders could also produce different results; we refer the reader to Avila et al. (2014) for a detailed comparison. Nevertheless, in our analysis, the conservative resolution criterion we have applied helps to minimize the impact of these uncertainties.
Subhalos can lose a significant amount of mass () before they are “destroyed”, but this definition of destruction is a good proxy for when the stellar mass associated with a subhalo is liberated into the host halo (see e.g., Peñarrubia et al. 2008; Wetzel & White 2010). Note, however, that the true definition of when the stellar material from subhalos is liberated into the main halo is highly uncertain, and likely dependent on the orbital properties and mass of the subhalos as well as the subhalo finder used in the analysis. Moreover, even observationally, it is unclear when a dwarf undergoing tidal stripping should no longer be identified as a distinct object (cf. the Sagittarius dwarf in the MW). In our analysis, we use the simple definition described above for destroyed subhalos and focus on the relative differences between host halos, however, it is worth bearing in mind that the derived time of subhalo destruction does depend on our adopted definition.
In our analysis, we only consider subhalos that are progenitors of the host halo. Thus, we do not take into account “sub-subhalos” that can be destroyed within the virial radius of the progenitor subhalos before they themselves are destroyed. The population of sub-subhalos can be significant, especially at the low-mass end (e.g Wetzel et al. 2015a). To investigate the potential effect of this population, we track each host halo progenitor back to its (first) infall onto the host halo, and consider its own subhalo population at infall. Those sub-subhalos that get destroyed within the virial radius of the progenitor subhalos after infall onto the host halo can be counted as additional progenitors of the host halo. However, we find that the inclusion of this population makes little difference to our results, so we do not include these destroyed sub-subhalos in the remainder of the analysis.
Note that in this work, we do not consider the subhalos of progenitors that are destroyed before these progenitors fall into the host halos. For example, a massive dwarf that is eventually destroyed in a MW-mass halo has its own accretion history while it is an isolated halo (i.e., before infall), and several smaller mass dwarfs may have contributed to the mass of this massive dwarf. In this study, we only consider the mass-spectrum of subhalos destroyed within the virial radius of the main (MW-mass) host halo, which, by definition, excludes any subhalos or sub-subhalos destroyed before infall onto the host.
Throughout our analysis, we only consider subhalos with ( km s-1). Mao et al. (2015) estimate that this a conservative lower limit for convergence of the zoom-in MW simulations. For one of our host halos (Halo 937), we have a higher resolution run (particle mass ) that we can use to test for numerical convergence. By directly comparing this higher resolution simulation with its lower resolution counterpart (particle mass ), we confirm that our results are robust to numerical resolution effects.
2.2. Assigning Stellar Mass to Subhalos
We assign stellar mass to subhalos using the relation derived by Garrison-Kimmel et al. (2014); these authors showed that this relation agrees well with number counts of local group dwarfs. We apply 0.2 dex scatter in log at fixed log for and 0.3 dex scatter for lower mass subhalos with . Our lower mass threshold of for subhalos corresponds to a stellar mass limit of .
We assume no redshift evolution in the relation. This assumption is motivated by the lack of evidence for a strong redshift evolution on dwarf mass-scales from either theoretical (Hopkins et al. 2014; Graus et al. 2015), empirical (e.g. Behroozi et al., 2013c), or observational (Wake et al. 2011; Leauthaud et al. 2012; Hudson et al. 2015) studies. However, we do check that employing the redshift-dependent relations derived by Behroozi et al. (2013c) and Moster et al. (2013) makes little difference to our main results. Note that when we adopt these redshift-dependent relations we use the mass and redshift at infall onto the host halo when assigning stellar mass to subhalos.
Our prescription assumes that all subhalos down to (the resolution limit of the simulations) host a central (dwarf) galaxy. However, several studies (e.g., Okamoto & Frenk 2009; Nickerson et al. 2011; Shen et al. 2014; Sawala et al. 2014) have shown that reionization can prevent star formation in halos below (). Thus, at the ultra-faint dwarf mass scale, not all subhalos will form stars. Our implementation will therefore overestimate the number of ultra-faint dwarfs in the simulations, and thus their contribution to the accreted stellar mass (see Section 4.3) is likely an upper limit.
Note that we use the term “dwarf” to describe the stellar component of all subhalos with . This includes a small number galaxies with stellar masses () that would not normally be considered as dwarf galaxies. For our purposes, we use this loose definition of “dwarf” to describe the galaxies less massive than the main host throughout the paper, but caution the reader that this definition does include a handful of more massive galaxies (particularly in recent major mergers).
In the following sections, we consider the stellar mass that is accreted by MW mass halos from dwarf progenitors111Note that this does not include the stellar mass residing in surviving dwarf satellites.. We note that this does not include any of the stellar mass born in situ in the central galaxy, which generally comprises the majority of the stellar mass budget on these mass scales. Furthermore, the accreted stellar mass need not reside solely in the galaxy stellar halos, as a significant fraction can end up in the disk/bulge (Read et al. 2008; Cooper et al. 2010; Pillepich et al. 2015). Where possible, we make approximate comparisons with observations of stellar halos, but note that direct comparisons should be taken with a healthy grain of salt.
Throughout this work we consider “mass-weighted” quantities, which will naturally bias us towards the inner regions of observed halos ( kpc). However, while it is beyond the scope of this work to probe radial trends in galaxy halos (see e.g., recent work by Amorisco 2015 and Rodriguez-Gomez et al. 2015), we do focus on the region where most of the accreted stellar mass resides.
3. Mass Spectrum of Destroyed Dwarfs
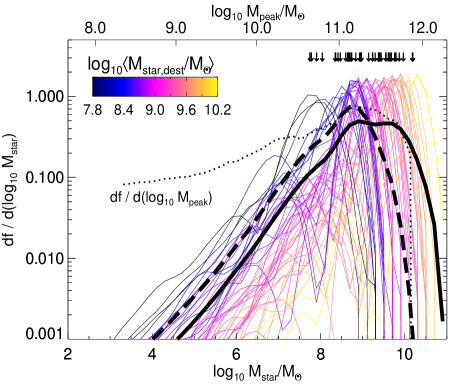
In this Section, we investigate the “mass-spectrum” of destroyed dwarfs of our 45 MW-mass halos. We show the differential contribution to the accreted stellar mass from destroyed dwarfs with stellar mass as a function of in Figure 2.
The mass weighted average stellar mass for destroyed dwarfs gives the typical dwarf mass of contributors to the total accreted stellar mass.
| (1) |
Here, the sum is performed over all destroyed dwarfs with . Similarly, we can define the mass weighted average time when these dwarfs are destroyed:
| (2) |
The thin colored lines in Figure 2 show the differential contributions to the accreted stellar mass for each host halo. The lines are colored according to (darker/blue = low mass, lighter/yellow = high mass), and for each host halo is indicated by the black arrows. The typical ranges from , but the halo-to-halo scatter is large.
The thick black line shows the average distribution. The dotted line shows the differential contribution of dark matter . The steep relation at low mass scales () suppresses the contribution of subhalos with low to the accreted stellar mass.
We also define a subsample of host halos with a “quiescent” accretion history, defined as having no major mergers (dark matter mass ratio ) since . Note that we only consider major mergers with dwarfs that are now destroyed; surviving satellites are not included. Only 40 % (19) of the whole sample pass this cut. This quiescent criteria is generally used to define samples of “Milky Way type” halos in simulations (e.g., Bullock & Johnston 2005; De Lucia & Helmi 2008; Cooper et al. 2010). However, while there is plenty of observational evidence suggesting that the MW has undergone a relatively quiescent accretion history (e.g., Gilmore et al. 2002; Hammer et al. 2007; Deason et al. 2013a, 2014; Ruchti et al. 2015), approximately of halos with are expected to host disk galaxies (e.g., Weinmann et al. 2006; Choi et al. 2007). Thus, the strict criteria for a quiescent accretion history likely excludes several halos that could host disk galaxies with similar mass to the MW.
The distribution for the quiescent sample is shown with the thick dashed black line in Figure 2; this sample is biased to lower values, typically . The typical mass dwarfs that are accreted by these quiescent halos are in good agreement with the findings of previous works attempting to model stellar halos of MW type galaxies (e.g., Bullock & Johnston 2005; De Lucia & Helmi 2008; Cooper et al. 2010).
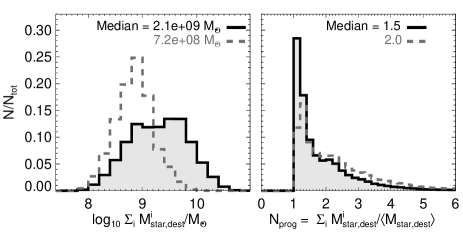
The left-hand panel of Figure 3 shows the distribution of total stellar masses contributed by destroyed dwarfs for each host halo. The halo-to-halo scatter is large, with total stellar masses ranging from to (cf. Cooper et al. 2013). The quiescent halo sample generally has lower total accreted stellar masses. The right-hand panel of Figure 3 shows the typical number of progenitors for each host halo (, cf. Cooper et al. 2010). Generally, dwarfs comprise the majority of the stellar mass contributed by destroyed dwarf galaxies.
3.1. Dependence on Accretion History

We now consider how the mass spectrum of accreted dwarfs depends on the accretion histories of the host halos. In Figure 4 we show the cumulative fraction of accreted stellar mass from destroyed dwarfs as a function of lookback time (left panels) and dwarf mass (right panels). Each row shows the cumulative fractions for a range .
Halos with earlier accretion epochs and thus earlier values, tend to build-up their accreted stellar mass from lower mass dwarfs. Halos undergoing recent merger events have larger contributions from more massive dwarfs. Thus, the “mass-spectrum” or masses of the most dominant progenitors, depend strongly on the epoch at which most of the stellar mass is accreted. Note that this distinction between late- and early-forming halos is largely due to the addition (or absence) of massive dwarfs at late times (e.g., recent major mergers).
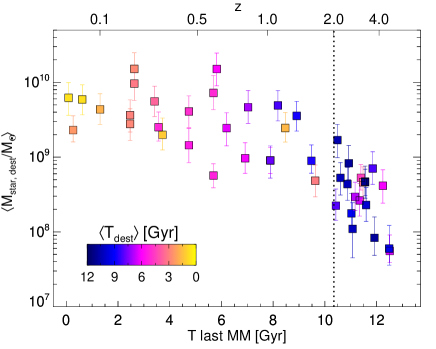
As shown in Figure 2, our quiescent sample of host halos are biased towards lower average (mass weighted) destroyed dwarf masses (). In Figure 5 we show explicitly how depends on the time of the last major merger of the host halos. Here, we only consider mergers of dwarfs that eventually get destroyed (i.e., we do not include surviving satellites), and we use a (dark matter) mass ratio threshold to define major mergers. The filled symbols are colored by . The dotted line indicates the boundary used to define the quiescent sample of halos. As alluded to in the previous section, the quiescent sample have lower values (), while halos undergoing more recent major mergers have significant contributions to their accreted stellar mass by more massive dwarfs ().
4. Metallicity of Destroyed Dwarfs
In this Section, we consider the metallicity distribution of accreted stellar material contributed by destroyed dwarfs.
4.1. Empirical Model
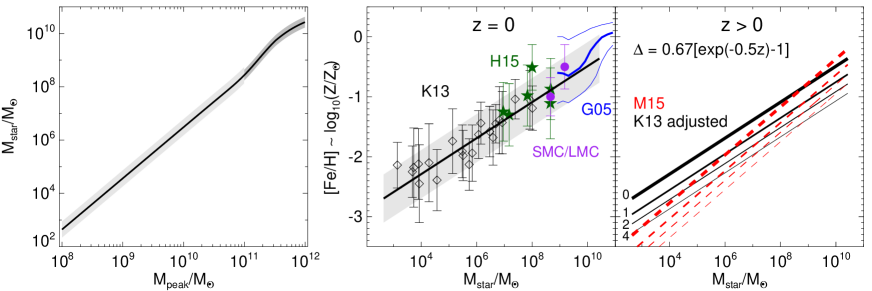
We employ empirical models to estimate the metallicity of the destroyed dwarfs in the simulations. For completeness, the left-hand panel of Figure 6 shows the stellar mass-peak halo mass relation that we have adopted to assign stellar mass to subhalos (see Section 2.2). To relate this stellar mass to an average metallicity ([Fe/H]) we adopt a stellar mass-metallicity relation. Our starting point is the relation for dwarf galaxies, which is well-defined over several orders of magnitude in stellar mass (e.g., Kirby et al. 2013). This relation is shown in the middle panel of Figure 6; the thick black line shows the best-fit relation derived by Kirby et al. (2013). The data points are mainly from the Kirby et al. (2013) sample (black diamonds). We also show values for massive dwarfs in M31 (Ho et al. 2015, green stars) and the Magellanic Clouds (LMC/SMC, Carrera et al. 2008; Parisi et al. 2010, purple filled circles). The error bars on the observed sample include the intrinsic spread in metallicity for individual dwarfs. We also show the relation for slightly more massive dwarfs derived by Gallazzi et al. (2005) for local Sloan Digital Sky Survey galaxies with the blue lines. The approximate scatter in [Fe/H] at fixed stellar mass is dex (shown by the gray shaded region).
At fixed stellar mass, a galaxy at higher redshift has, on average, a lower metallicity than one at lower redshift (e.g., Erb et al. 2006; Mannucci et al. 2010; Henry et al. 2013; Zahid et al. 2013). This redshift evolution is well-studied observationally for , but is poorly understood for dwarf galaxies with . With no observations to guide us, we adopt the relations recently derived by Ma et al. (2015) from hydrodynamical simulations. These simulations have been successful in matching many observational properties on dwarf mass scales, such as the stellar mass–halo mass relation (Hopkins et al. 2014), the stellar mass-metallicity relation (Ma et al. 2015) and the presence of dark matter cores (Oñorbe et al. 2015). The Ma et al. (2015) redshift evolution of the [Fe/H]– relation is shown in the right-hand panel of Figure 6 with the red dashed lines. We adopt the Kirby et al. (2013) relation at , which is slightly shallower than the relation given by Ma et al. (2015). However, we use the redshift evolution that Ma et al. (2015) derive: [Fe/H] . Our adopted stellar mass–metallicity relation for a range of redshifts is shown by the black lines in Figure 6. Note that our adopted redshift dependence is in good agreement with observational studies probing the metal abundances of galaxies at different redshifts (e.g. Rodrigues et al. 2008; Zahid et al. 2011).
We note that our assumed relation does not evolve with redshift. Thus, a dwarf surviving today with the same peak subhalo mass as a dwarf that was destroyed Gyr ago, is assigned the same stellar mass. This may seem counterintuitive, as the dwarf surviving today could, presumably, have formed more stars. In practice, our simple prescription assumes that both of these dwarfs form the same amount of stars, but over very different timescales, i.e., the dwarf that was destroyed Gyr ago formed the same amount of stars as the surviving dwarf, but over a shorter timescale. This simplification, although crude, does naturally take into account the fact that star formation rates are higher at higher redshifts. Furthermore, as noted in Section 2.2, we do ensure that our results are not significantly affected if we instead adopt the redshift-dependent relations derived by Behroozi et al. (2013c) and Moster et al. (2013).
To apply our prescription to the subhalos in simulations we must define an appropriate redshift in the subhalo’s evolution when we define the metallicity of the dwarf. For example, we could use the redshift when the subhalo reaches its peak mass () or when it first infalls onto the host halo (), and assume no star formation occurs after this point. For simplicity, we assign an average metallicity to each dwarf at the redshift it gets destroyed (). This is the minimum redshift we could apply, and allows us to naturally agree with the relation for the surviving dwarfs. In practice, it is worth noting that adopting or would lower our derived average metallicities by dex, but does not significantly affect our conclusions. This is probably because most dwarfs are destroyed relatively rapidly after falling into the host MW halos.
The appropriate redshift at which star formation ceases likely requires different definitions depending on the stellar mass of the dwarf galaxy. For example, Wetzel et al. (2015b) and Fillingham et al. (2015) recently showed that environmental quenching is much more efficient for dwarfs with than for more massive dwarfs. We find that varying the redshift at which we apply the mass-metallicity relation (e.g., for and for ) makes little difference to our results. Finally, we note that the ultra-faint dwarf galaxy population likely stopped forming stars several Gyr ago (e.g., Brown et al. 2012), thus the ultra-faint dwarfs destroyed in the past may look very similar (at least in terms of metallicity) to the population. Thus, it may be more appropriate to simply use the observed stellar mass-metallicity relation for these very low-mass dwarfs. However, we find that assuming no redshift evolution in the stellar mass-metallicity relation for dwarfs with does not significantly affect our results. This is because most of the accreted stellar material, even at relatively low metallicity, comes from more massive dwarfs (see Section 4.3).
In addition to an average metallicity, we assume a Gaussian metallicity distribution function (MDF) for each dwarf with standard deviation of dex, motivated by the observed intrinsic scatter for individual dwarfs at . Introducing this intrinsic dispersion is an important component of our model as a more massive dwarf with higher average metallicity than a lower mass dwarf can still contribute more stellar mass at lower metallicities owing to the low metallicity tail of its distribution. Of course, the MDFs for individual dwarfs (even at fixed stellar mass) can vary widely (e.g., Kirby et al. 2013; Ho et al. 2015), but our our simple assumption of a Gaussian distribution with fixed dispersion is a good approximation for the “average” MDF at a given stellar mass (see below).
In the top panel of Figure 7 we show the form of our fiducial Gaussian MDF ( dex) with the gray filled region. The black dotted line shows a narrower Gaussian with dex. The thick purple and green lines show the combined MDFs for luminous dwarf spheroidal galaxies (dSphs) and luminous dwarf irregular galaxies (dIrrs) from Kirby et al. (2013) (see their Fig. 12). The combined MDFs for the observed dwarfs only include galaxies with , and each individual galaxy’s MDF was centered at its mean [Fe/H] before the MDFs were stacked together. The average MDF for dSphs is narrower and more peaked than the average MDF for dIrrs. Our model MDF is in good agreement with the average dIrr MDF. The model is less peaked than the average dSph MDF, but is a good approximation to the metal-poor tail of the observed distribution. In contrast, a narrower Gaussian with does not agree well with the observed distributions.
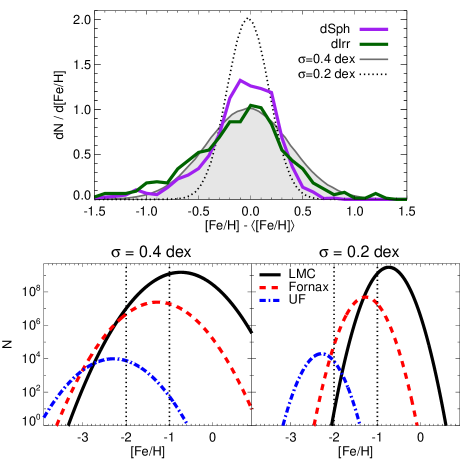
In the bottom panels of Figure 7 we show schematically the affect of varying the dispersion of the MDFs. Here, we adopt the mass-metallicity relation (Kirby et al. 2013), and show Gaussian MDFs for LMC mass (, solid black lines), Fornax mass (, dashed red lines) and ultra-faint mass (, blue dot-dashed lines) dwarfs. The dispersion in [Fe/H] we adopt directly affects the contribution of different mass dwarfs to the metal-poor component of the accreted stars (see Section 4.3). Most importantly, the metal-poor tails of the MDFs for more massive dwarfs are vital. Below, we outline our results with our fiducial assumption of Gaussian metallicity distributions with dex, but we also comment on how our results are affected by our adopted .
4.2. Metallicity dependence of the Mass Spectrum
After applying our empirical models (described above), we can investigate the approximate metallicity of the stellar material accreted by destroyed dwarfs.
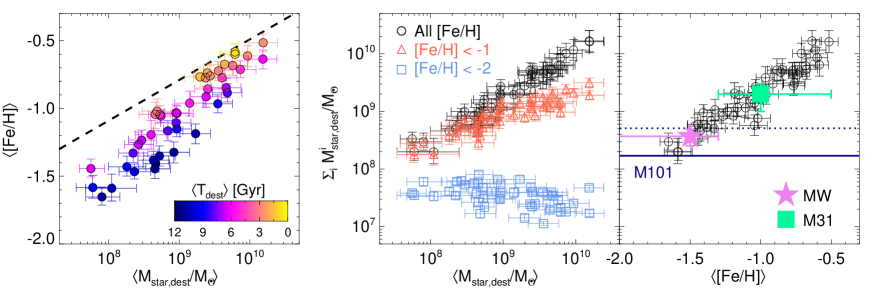
The left-hand panel of Figure 8 shows the average (mass weighted) metallicity of the accreted stellar component in each host halo against the average (mass weighted) destroyed dwarf stellar mass (). The colors indicate the average (mass weighted) lookback time when these dwarfs were destroyed. This relation reflects our adopted stellar mass-metallicity-redshift relation, whereby more massive dwarfs have higher metallicities, and dwarfs destroyed at earlier times have lower metallicities.
We can use the average metallicities of the destroyed dwarfs, and their intrinsic scatter (0.4 dex) to estimate the fraction of the total accreted stellar mass that is low metallicity ([Fe/H] ) or very low metallicity ([Fe/H] ). This is shown in the middle panel of Figure 8 as a function of . The total stellar mass (black circles) and total low metallicity ([Fe/H] , red triangles) stellar mass increases with . However, the total stellar mass of very low metallicity stars ([Fe/H] , blue squares) stays approximately constant with . Thus, regardless of the average (mass weighted) mass of the destroyed dwarfs, approximately the same mass of very low metallicity stars is accreted by each halo.
In the right-hand panel of Figure 8 we show the total accreted stellar mass against the average metallicity of the accreted material. For comparison, we show the approximate observational constraints for the stellar halos of the MW (; Bell et al. 2008, [Fe/H] to ; Carollo et al. 2010), M31 (; Williams et al. 2015, [Fe/H] to ; Kalirai et al. 2006), and the nearby galaxy M101 (; van Dokkum et al. 2014). The agreement is pretty remarkable, especially given the simplicity of our models. However, it is worth cautioning that our accreted stellar masses are only an approximate representation of the stellar halos of galaxies. This is because some of the accreted material can end up in the disk/bulge and a significant fraction of the observed masses could be contributed by halo stars born in-situ (e.g., Zolotov et al. 2009; Font et al. 2011). Nonetheless, it is reassuring that our simple empirical models provide a reasonable agreement with the available observational constraints, and, perhaps more importantly, we can reproduce the relative difference between the MW and M31 stellar halos. This difference is, at least in part, likely indicative of their respective accretion histories. We also note that the models by Purcell et al. (2008) find diffuse intrahalo light metallicities of for mass host halos, in good agreement with our models.
The stellar halo masses and average metallicities of the MW and M31 halos can be used to roughly estimate the dominant contributors to their accreted stellar components. The MW seems to favor relatively low-mass progenitors (SMC/Sagittarius mass), while M31 is more consistent with an order of magnitude larger progenitors (LMC mass). Note that the very low stellar halo mass recently measured by van Dokkum et al. (2014) for M101 suggests relatively low-mass progenitors (similar to the MW or lower) and also predicts a low average metallicity. While we only make rough comparisons with observations here, our simple models show that the dominant halo progenitors can be inferred from measurements of the stellar mass in the halo of galaxies and/or their average metal content. Both of these observational measurements are, or will be, feasible for many MW-mass galaxies in the nearby Universe.
4.3. Contributions from “Classical” and “Ultra-Faint” Dwarfs
We now use the empirical models developed in the previous section(s) to estimate the contributions from low mass dwarfs () and ultra-faint dwarfs () to the accreted stellar material.
We also consider the contributions from different mass dwarfs to the metal-poor accreted stellar material. Naively one may expect that the most metal-poor stars come from the the lowest mass dwarfs with the lowest average metallicity. However, although the average metallicities of more massive dwarfs are higher than low mass dwarfs, the tail of their MDFs can still contribute more metal-poor stars because they contain many more stars (see Figure 7).
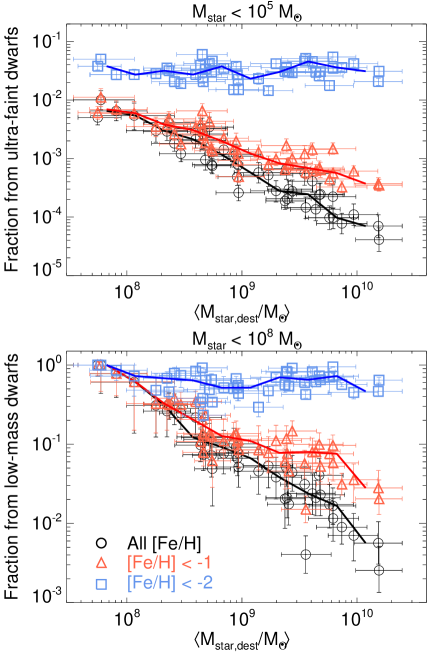
Figure 9 shows the fractional contribution from ultra-faint (top panel) and low-mass dwarfs (bottom panel) as a function of the average (mass weighted) destroyed dwarf stellar mass (). The black circles are for the overall stellar mass and the red triangles and blue squares show the metal-poor ([Fe/H] ) and very metal-poor ([Fe/H] ) components, respectively.
Ultra-faint dwarfs contribute very little to the accreted stellar mass regardless of the mass spectrum of destroyed dwarfs. Even at very low metallicities, they only contribute of the accreted stellar mass. On the other hand, low-mass “classical” dwarfs () can contribute a significant amount to the overall accreted material if is low. Furthermore, regardless of the mass-spectrum, they contribute a significant amount of the very metal-poor stars (). It is worth remarking that more massive dwarfs () can still contribute a significant amount () to the very metal-poor material, even though their average metallicities are [Fe/H] . Furthermore, they are generally the main contributors to the stellar material with [Fe/H] .
As shown in Figure 7, the intrinsic scatter of the dwarf MDFs is important when considering the contributions to the metal-poor component of the accreted stars. We find that adopting a narrower dispersion ( dex) has little affect on the contributions to the accreted material with [Fe/H] , but has a non-negligible affect at the lowest metallicities. With less intrinsic scatter, more massive dwarfs () contribute significantly less stellar material with [Fe/H] , and the majority () of the lowest metallicity stellar mass comes from dwarfs with . However, the contribution from ultra-faint mass dwarfs is still not dominant, with typical fractions of and a maximum fraction of .
It is worth re-emphasizing that our adopted model assumes that all subhalos with host luminous galaxies. Given that it is likely that a significant fraction of subhalos with do not form any stars (see Section 2.2), we are likely overestimating the contribution to the accreted stellar material from the ultra-faint mass dwarfs.
Finally, we note that we cannot rule out that ultra-faint dwarfs may be major contributors to galaxy stellar halos at large radii, but their contribution in the inner regions of the halo, where the majority of the stellar halo mass resides, is likely piddly. Furthermore, they may be the dominant source of rare, extremely metal-poor stars in galaxy halos with [Fe/H] .
5. Surviving and Destroyed Dwarfs
In this final section, we consider the relation between the surviving dwarf population at and the dwarfs that have since been destroyed.
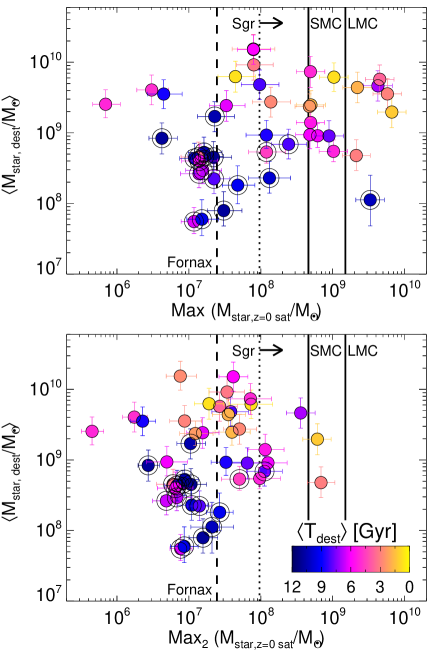
Figure 10 shows the average (mass weighted) stellar mass of destroyed dwarfs against the mass of the most massive (top panel) and second most massive (bottom panel) surviving dwarf at . The filled symbols are color coded according to the mass weighted average time of destruction for destroyed dwarfs. The black circles indicate the subset of halos with quiescent accretion histories. Solid lines indicate the approximate stellar masses of the Large and Small Magellanic clouds (LMC/SMC, McConnachie 2012), and the dotted line shows the approximate lower limit on the Sagittarius dwarf galaxy stellar mass derived by Niederste-Ostholt et al. (2010). We also indicate the stellar mass of the Fornax dwarf, the most massive classical dwarf, with the dashed black line.
Halos that typically destroyed less massive dwarfs (), tend to have less massive surviving satellites today. Halos that have destroyed more massive dwarfs tend to have more massive surviving satellites, but there is a lot of scatter.
Only one () of the quiescent halo sample has a surviving dwarf with a mass comparable to the LMC (), compared to 30% for the non-quiescent sample. Moreover, none of the quiescent halos have an LMC-mass dwarf at and a second most massive dwarf with . This suggests some potential tension between the general assumption of a quiescent MW mass halo and the mass spectrum of its surviving dwarfs. Note that 20% of the overall sample of MW-mass halos at host a dwarf satellite with , and 7% host a second most massive satellite with . These fractions are in good agreement with the numbers of LMC and SMC analogues in halos found by Boylan-Kolchin et al. (2011) and Busha et al. (2011) using the Millennium II and Bolshoi simulation suites, respectively. Observational studies by Liu et al. (2011), Tollerud et al. (2011) and Robotham et al. (2012) using spectroscopic samples from the Sloan Digital Sky Survey and the Galaxy And Mass Assembly project, also find comparable fractions of LMC- and SMC-mass satellites to these simulations222These studies use different selection criteria, though identical criteria were used in comparing the simulated study of Busha et al. (2011) to the observational study of Liu et al. (2011). Thus, although our results are based on a relatively small number of host halos, our statistics of massive satellites are in agreement with larger samples in both simulations and observations.
The mass spectrum of surviving dwarfs today can be compared to the “mass-gap” statistic often used on group/cluster scales to classify fossil groups (e.g., Ponman et al. 1994; Jones et al. 2003). Here, halos with more massive satellites, and thus smaller logarithmic “gaps” between the host halo mass and most massive satellite mass, tend to have younger and less concentrated dark matter halos. Fossil groups have large mass-gaps and tend to be old and highly concentrated (e.g., D’Onghia et al. 2005; von Benda-Beckmann et al. 2008; Dariush et al. 2010; Deason et al. 2013b). Again, scaling these relations down to MW mass scales presents somewhat of a conundrum, as the MW halo is likely old and perhaps even highly concentrated (e.g., Battaglia et al. 2005; Smith et al. 2007; Deason et al. 2012), despite having a massive LMC satellite. However, this extrapolation completely ignores the scatter in the mass-gap—halo age relation, which can be considerable. For example, Deason et al. (2013b) showed that a significant fraction ( 20%) of groups with large mass-gaps are young, and likely experienced a recent major merger between a massive satellite subhalo and the central subhalo (cf. the halo in Figure 10 with , Gyr, and Max() ). Conversely, there are halos that have recently accreted a massive satellite subhalo, but have had little “action” prior to this event. Thus, the transient nature of the halo mass-gap statistic leads to a population of halos that can be labeled as “transient fossils”; these are halos with a recent merger or accretion event that masks the preceding formation history of the halo. Given the observational evidence that the LMC and SMC were probably accreted very recently (e.g., Besla et al. 2007; Kallivayalil et al. 2013), it seems likely that the MW is one of these so-called transient fossils.
The “uniqueness” of the MW is an important topic to address, as our Galaxy is often viewed as a benchmark galaxy that we use to compare with both observations of external galaxies and simulations. It is well-known that less massive MW halos are less likely to host LMC/SMC mass satellites at (e.g., Boylan-Kolchin et al. 2010). Thus, the combination of a relatively low MW halo mass () and a quiescent accretion history would suggest that the MW is even more of an oddity than previously thought. The presence of an LMC/SMC has been used to probabilistically determine the mass of the MW using large samples of halos in numerical simulations (e.g., Busha et al. 2011; Cautun et al. 2014). Our results suggest that the inclusion of a proxy for accretion history in such calculations could have a significant affect on these inferences.
6. Conclusions
We used a suite of 45 zoom-in simulations of MW mass halos to study the mass spectrum of destroyed dwarfs that contribute to the accreted stellar mass of the halos. The halos have a narrow mass range, , which allows us to focus on the variation in assembly histories of the host halos. Empirical models are used to relate (peak) subhalo mass to stellar mass, and we use constraints from hydrodynamical simulations as well as observations to estimate the metallicity distribution of the accreted stellar material. Our main conclusions are summarized as follows:
-
•
Typically, destroyed dwarfs with stellar masses of contribute the majority of the accreted stellar mass of MW mass halos. The mass-weighted average stellar masses of destroyed dwarfs are strongly related to the assembly history of the host halos. The accreted stellar mass of host halos with quiescent histories are built up from lower mass dwarfs () and have lower total accreted stellar masses at . Halos undergoing recent major mergers have larger total accreted stellar masses, and are dominated by more massive destroyed dwarfs (). The dominant contributors to the accreted stellar mass are, for all halos, relatively high mass () dwarfs due to the steep relation between and at low halo masses.
-
•
The average metallicity of the accreted stellar material reflects the mass spectrum of the halo progenitors, as well as the time at which these dwarfs were destroyed. Low mass dwarfs destroyed at early times are lower metallicity than higher mass dwarfs destroyed relatively recently. Our derived relation between the average metallicity of accreted stellar mass and the total accreted stellar mass at is in good agreement with observational constraints for the stellar halos of the MW and M31. Accreted components with lower average metallicity and lower total mass, are likely present in host halos with more quiescent accretion histories. Thus, the higher average metallicity and total stellar halo mass of M31 relative to the MW suggests a more active, recent accretion history for the M31 galaxy. We note that employing stringent constraints on the assembly histories to select “MW-type” galaxies (i.e., no major mergers since ) can introduce severe biases, and likely excludes several disk galaxies (like M31) with similar masses to the MW.
-
•
The contribution to the total accreted stellar mass from classical mass () and ultra-faint mass () dwarfs depends on the destroyed dwarf mass spectrum, and thus the host halo assembly history. For all halos, the contribution from ultra-faint dwarfs is negligible (). However, classical dwarfs can contribute a significant amount to the accreted stellar mass in halos with very quiescent accretion histories. Furthermore, regardless of the mass spectrum, classical dwarfs contribute a substantial amount () to the accreted very metal-poor stars ([Fe/H] ). On the other hand, although the low mass ultra-faint dwarfs have lower average metallicities, their contribution to the very metal-poor stellar material is low (). In fact, if more massive dwarfs () have significant metal-poor tails to their metallicity distributions, they can contribute a considerable amount () to the very metal-poor material even though their average metallicities are [Fe/H] . Furthermore, these more massive dwarfs are generally the main contributors to the stellar material with [Fe/H] .
-
•
By comparing the average (mass weighted) destroyed dwarf mass to the surviving satellite population, we find that halos with relatively low mass progenitors, and thus relatively quiescent accretion histories, tend to have lower mass surviving dwarfs today. We find that only one of the “quiescent” host halos has a surviving satellite with mass similar to the LMC, and none also have a second most massive satellite of similar mass to the SMC and/or Sagittarius. Thus, the generic assumption of a quiescent MW halo seems in tension with the mass spectrum of its surviving dwarfs. We suggest that the MW could be a “transient fossil” — a quiescent halo with a recent accretion event(s) that disguises the preceding formation history of the halo.
Our analysis combines high-resolution CDM dark matter only simulations with empirical galaxy formation models (i.e., the stellar mass–halo mass relation and the stellar mass–metallicity–redshift relation) to study the stellar material accreted by MW-mass halos from destroyed dwarfs. Our results are a natural outcome of some of these underlying assumptions. For example, the relation between stellar mass and halo mass is steep for dwarf galaxies (), and despite their abundance, this steep relation diminishes the contribution of very low-mass dwarfs to the overall accreted stellar mass. It is worth emphasizing that the “true” relation between stellar mass and halo mass for low-mass galaxies is highly uncertain, but, as far as we are aware, there is no observational or theoretical evidence for a significantly flatter relation that would alter our conclusions.
Under our model assumptions, the dominant contributors to the accreted stellar mass are LMC/SMC-mass dwarfs (), and “classical” mass dwarfs () generally supply the majority of the very metal-poor stellar material. In Section 4, we highlighted the importance of our adopted MDFs of dwarf galaxies on our results, particularly for the more massive dwarfs. Although our models are chosen to reflect the current observational (and theoretical) MDFs of dwarfs, observations are somewhat scarce, and ultimately tied only to local group dwarfs. This work could greatly benefit from larger statistical samples of dwarf galaxy MDFs, over a range of masses and redshifts. At present, this is a daunting task, however the prospect of upcoming observational facilities, such as the 30-m class telescopes and wide-field spectrographs on 10-m class telescopes, will greatly facilitate this goal in the near future.
References
- Amorisco (2015) Amorisco, N. C. 2015, ArXiv e-prints, arXiv:1511.08806
- Avila et al. (2014) Avila, S., Knebe, A., Pearce, F. R., et al. 2014, MNRAS, 441, 3488
- Battaglia et al. (2005) Battaglia, G., Helmi, A., Morrison, H., et al. 2005, MNRAS, 364, 433
- Behroozi et al. (2013c) Behroozi, P. S., Wechsler, R. H., & Conroy, C. 2013c, ApJ, 770, 57
- Behroozi et al. (2013a) Behroozi, P. S., Wechsler, R. H., & Wu, H.-Y. 2013a, ApJ, 762, 109
- Behroozi et al. (2013b) Behroozi, P. S., Wechsler, R. H., Wu, H.-Y., et al. 2013b, ApJ, 763, 18
- Bell et al. (2008) Bell, E. F., Zucker, D. B., Belokurov, V., et al. 2008, ApJ, 680, 295
- Benson et al. (2002) Benson, A. J., Frenk, C. S., Lacey, C. G., Baugh, C. M., & Cole, S. 2002, MNRAS, 333, 177
- Besla et al. (2007) Besla, G., Kallivayalil, N., Hernquist, L., et al. 2007, ApJ, 668, 949
- Boylan-Kolchin et al. (2011) Boylan-Kolchin, M., Besla, G., & Hernquist, L. 2011, MNRAS, 414, 1560
- Boylan-Kolchin et al. (2010) Boylan-Kolchin, M., Springel, V., White, S. D. M., & Jenkins, A. 2010, MNRAS, 406, 896
- Brown et al. (2012) Brown, T. M., Tumlinson, J., Geha, M., et al. 2012, ApJ, 753, L21
- Bryan & Norman (1998) Bryan, G. L., & Norman, M. L. 1998, ApJ, 495, 80
- Bullock & Johnston (2005) Bullock, J. S., & Johnston, K. V. 2005, ApJ, 635, 931
- Bullock et al. (2000) Bullock, J. S., Kravtsov, A. V., & Weinberg, D. H. 2000, ApJ, 539, 517
- Busha et al. (2011) Busha, M. T., Marshall, P. J., Wechsler, R. H., Klypin, A., & Primack, J. 2011, ApJ, 743, 40
- Carollo et al. (2010) Carollo, D., Beers, T. C., Chiba, M., et al. 2010, ApJ, 712, 692
- Carrera et al. (2008) Carrera, R., Gallart, C., Hardy, E., Aparicio, A., & Zinn, R. 2008, AJ, 135, 836
- Cautun et al. (2014) Cautun, M., Frenk, C. S., van de Weygaert, R., Hellwing, W. A., & Jones, B. J. T. 2014, MNRAS, 445, 2049
- Choi et al. (2007) Choi, Y.-Y., Park, C., & Vogeley, M. S. 2007, ApJ, 658, 884
- Conroy & Wechsler (2009) Conroy, C., & Wechsler, R. H. 2009, ApJ, 696, 620
- Conroy et al. (2007) Conroy, C., Wechsler, R. H., & Kravtsov, A. V. 2007, ApJ, 668, 826
- Cooper et al. (2010) Cooper, A. P., Cole, S., Frenk, C. S., et al. 2010, MNRAS, 406, 744
- Cooper et al. (2013) Cooper, A. P., D’Souza, R., Kauffmann, G., et al. 2013, MNRAS, 434, 3348
- Dariush et al. (2010) Dariush, A. A., Raychaudhury, S., Ponman, T. J., et al. 2010, MNRAS, 405, 1873
- De Lucia & Helmi (2008) De Lucia, G., & Helmi, A. 2008, MNRAS, 391, 14
- Deason et al. (2012) Deason, A. J., Belokurov, V., Evans, N. W., & An, J. 2012, MNRAS, 424, L44
- Deason et al. (2013a) Deason, A. J., Belokurov, V., Evans, N. W., & Johnston, K. V. 2013a, ApJ, 763, 113
- Deason et al. (2014) Deason, A. J., Belokurov, V., Koposov, S. E., & Rockosi, C. M. 2014, ApJ, 787, 30
- Deason et al. (2015) Deason, A. J., Belokurov, V., & Weisz, D. R. 2015, MNRAS, 448, L77
- Deason et al. (2013b) Deason, A. J., Conroy, C., Wetzel, A. R., & Tinker, J. L. 2013b, ApJ, 777, 154
- D’Onghia et al. (2005) D’Onghia, E., Sommer-Larsen, J., Romeo, A. D., et al. 2005, ApJ, 630, L109
- Erb et al. (2006) Erb, D. K., Shapley, A. E., Pettini, M., et al. 2006, ApJ, 644, 813
- Fillingham et al. (2015) Fillingham, S. P., Cooper, M. C., Wheeler, C., et al. 2015, MNRAS, 454, 2039
- Fiorentino et al. (2015) Fiorentino, G., Bono, G., Monelli, M., et al. 2015, ApJ, 798, L12
- Font et al. (2006) Font, A. S., Johnston, K. V., Bullock, J. S., & Robertson, B. E. 2006, ApJ, 646, 886
- Font et al. (2011) Font, A. S., McCarthy, I. G., Crain, R. A., et al. 2011, MNRAS, 416, 2802
- Frebel et al. (2010) Frebel, A., Simon, J. D., Geha, M., & Willman, B. 2010, ApJ, 708, 560
- Gallazzi et al. (2005) Gallazzi, A., Charlot, S., Brinchmann, J., White, S. D. M., & Tremonti, C. A. 2005, MNRAS, 362, 41
- Garrison-Kimmel et al. (2014) Garrison-Kimmel, S., Boylan-Kolchin, M., Bullock, J. S., & Lee, K. 2014, MNRAS, 438, 2578
- Gilmore et al. (2002) Gilmore, G., Wyse, R. F. G., & Norris, J. E. 2002, ApJ, 574, L39
- Graus et al. (2015) Graus, A. S., Bullock, J. S., Boylan-Kolchin, M., & Weisz, D. R. 2015, ArXiv e-prints, arXiv:1509.01250
- Griffen et al. (2015) Griffen, B. F., Ji, A. P., Dooley, G. A., et al. 2015, ArXiv e-prints, arXiv:1509.01255
- Hahn & Abel (2011) Hahn, O., & Abel, T. 2011, MNRAS, 415, 2101
- Hammer et al. (2007) Hammer, F., Puech, M., Chemin, L., Flores, H., & Lehnert, M. D. 2007, ApJ, 662, 322
- Helmi et al. (2006) Helmi, A., Irwin, M. J., Tolstoy, E., et al. 2006, ApJ, 651, L121
- Henry et al. (2013) Henry, A., Scarlata, C., Domínguez, A., et al. 2013, ApJ, 776, L27
- Ho et al. (2015) Ho, N., Geha, M., Tollerud, E. J., et al. 2015, ApJ, 798, 77
- Hopkins et al. (2014) Hopkins, P. F., Kereš, D., Oñorbe, J., et al. 2014, MNRAS, 445, 581
- Hudson et al. (2015) Hudson, M. J., Gillis, B. R., Coupon, J., et al. 2015, MNRAS, 447, 298
- Jones et al. (2003) Jones, L. R., Ponman, T. J., Horton, A., et al. 2003, MNRAS, 343, 627
- Kalirai et al. (2006) Kalirai, J. S., Gilbert, K. M., Guhathakurta, P., et al. 2006, ApJ, 648, 389
- Kallivayalil et al. (2013) Kallivayalil, N., van der Marel, R. P., Besla, G., Anderson, J., & Alcock, C. 2013, ApJ, 764, 161
- Kirby et al. (2013) Kirby, E. N., Cohen, J. G., Guhathakurta, P., et al. 2013, ApJ, 779, 102
- Kravtsov et al. (2004) Kravtsov, A. V., Gnedin, O. Y., & Klypin, A. A. 2004, ApJ, 609, 482
- Lai et al. (2011) Lai, D. K., Lee, Y. S., Bolte, M., et al. 2011, ApJ, 738, 51
- Leauthaud et al. (2012) Leauthaud, A., Tinker, J., Bundy, K., et al. 2012, ApJ, 744, 159
- Liu et al. (2011) Liu, L., Gerke, B. F., Wechsler, R. H., Behroozi, P. S., & Busha, M. T. 2011, ApJ, 733, 62
- Ma et al. (2015) Ma, X., Hopkins, P. F., Faucher-Giguere, C.-A., et al. 2015, ArXiv e-prints, arXiv:1504.02097
- Mannucci et al. (2010) Mannucci, F., Cresci, G., Maiolino, R., Marconi, A., & Gnerucci, A. 2010, MNRAS, 408, 2115
- Mao et al. (2015) Mao, Y.-Y., Williamson, M., & Wechsler, R. H. 2015, ApJ, 810, 21
- McConnachie (2012) McConnachie, A. W. 2012, AJ, 144, 4
- Moster et al. (2013) Moster, B. P., Naab, T., & White, S. D. M. 2013, MNRAS, 428, 3121
- Nickerson et al. (2011) Nickerson, S., Stinson, G., Couchman, H. M. P., Bailin, J., & Wadsley, J. 2011, MNRAS, 415, 257
- Niederste-Ostholt et al. (2010) Niederste-Ostholt, M., Belokurov, V., Evans, N. W., & Peñarrubia, J. 2010, ApJ, 712, 516
- Norris et al. (2010) Norris, J. E., Wyse, R. F. G., Gilmore, G., et al. 2010, ApJ, 723, 1632
- Oñorbe et al. (2015) Oñorbe, J., Boylan-Kolchin, M., Bullock, J. S., et al. 2015, MNRAS, 454, 2092
- Okamoto & Frenk (2009) Okamoto, T., & Frenk, C. S. 2009, MNRAS, 399, L174
- Parisi et al. (2010) Parisi, M. C., Geisler, D., Grocholski, A. J., Clariá, J. J., & Sarajedini, A. 2010, AJ, 139, 1168
- Peñarrubia et al. (2008) Peñarrubia, J., Navarro, J. F., & McConnachie, A. W. 2008, ApJ, 673, 226
- Pillepich et al. (2015) Pillepich, A., Madau, P., & Mayer, L. 2015, ApJ, 799, 184
- Ponman et al. (1994) Ponman, T. J., Allan, D. J., Jones, L. R., et al. 1994, Nature, 369, 462
- Purcell et al. (2007) Purcell, C. W., Bullock, J. S., & Zentner, A. R. 2007, ApJ, 666, 20
- Purcell et al. (2008) —. 2008, MNRAS, 391, 550
- Read et al. (2008) Read, J. I., Lake, G., Agertz, O., & Debattista, V. P. 2008, MNRAS, 389, 1041
- Robertson et al. (2005) Robertson, B., Bullock, J. S., Font, A. S., Johnston, K. V., & Hernquist, L. 2005, ApJ, 632, 872
- Robotham et al. (2012) Robotham, A. S. G., Baldry, I. K., Bland-Hawthorn, J., et al. 2012, MNRAS, 424, 1448
- Rodrigues et al. (2008) Rodrigues, M., Hammer, F., Flores, H., et al. 2008, A&A, 492, 371
- Rodriguez-Gomez et al. (2015) Rodriguez-Gomez, V., Pillepich, A., Sales, L. V., et al. 2015, ArXiv e-prints, arXiv:1511.08804
- Ruchti et al. (2015) Ruchti, G. R., Read, J. I., Feltzing, S., et al. 2015, MNRAS, 450, 2874
- Sawala et al. (2014) Sawala, T., Frenk, C. S., Fattahi, A., et al. 2014, ArXiv e-prints, arXiv:1406.6362
- Shen et al. (2014) Shen, S., Madau, P., Conroy, C., Governato, F., & Mayer, L. 2014, ApJ, 792, 99
- Simon et al. (2010) Simon, J. D., Frebel, A., McWilliam, A., Kirby, E. N., & Thompson, I. B. 2010, ApJ, 716, 446
- Smith et al. (2007) Smith, M. C., Ruchti, G. R., Helmi, A., et al. 2007, MNRAS, 379, 755
- Springel (2005) Springel, V. 2005, MNRAS, 364, 1105
- Springel et al. (2001) Springel, V., Yoshida, N., & White, S. D. M. 2001, New A, 6, 79
- Starkenburg et al. (2010) Starkenburg, E., Hill, V., Tolstoy, E., et al. 2010, A&A, 513, A34
- Stewart et al. (2008) Stewart, K. R., Bullock, J. S., Wechsler, R. H., Maller, A. H., & Zentner, A. R. 2008, ApJ, 683, 597
- Tollerud et al. (2011) Tollerud, E. J., Boylan-Kolchin, M., Barton, E. J., Bullock, J. S., & Trinh, C. Q. 2011, ApJ, 738, 102
- Tolstoy et al. (2009) Tolstoy, E., Hill, V., & Tosi, M. 2009, ARA&A, 47, 371
- Tolstoy et al. (2003) Tolstoy, E., Venn, K. A., Shetrone, M., et al. 2003, AJ, 125, 707
- van Dokkum et al. (2014) van Dokkum, P. G., Abraham, R., & Merritt, A. 2014, ApJ, 782, L24
- Venn et al. (2004) Venn, K. A., Irwin, M., Shetrone, M. D., et al. 2004, AJ, 128, 1177
- von Benda-Beckmann et al. (2008) von Benda-Beckmann, A. M., D’Onghia, E., Gottlöber, S., et al. 2008, MNRAS, 386, 2345
- Wake et al. (2011) Wake, D. A., Whitaker, K. E., Labbé, I., et al. 2011, ApJ, 728, 46
- Weinmann et al. (2006) Weinmann, S. M., van den Bosch, F. C., Yang, X., & Mo, H. J. 2006, MNRAS, 366, 2
- Wetzel et al. (2015a) Wetzel, A. R., Deason, A. J., & Garrison-Kimmel, S. 2015a, ApJ, 807, 49
- Wetzel et al. (2015b) Wetzel, A. R., Tollerud, E. J., & Weisz, D. R. 2015b, ApJ, 808, L27
- Wetzel & White (2010) Wetzel, A. R., & White, M. 2010, MNRAS, 403, 1072
- Williams et al. (2015) Williams, B. F., Dalcanton, J. J., Bell, E. F., et al. 2015, ApJ, 802, 49
- Zahid et al. (2013) Zahid, H. J., Geller, M. J., Kewley, L. J., et al. 2013, ApJ, 771, L19
- Zahid et al. (2011) Zahid, H. J., Kewley, L. J., & Bresolin, F. 2011, ApJ, 730, 137
- Zolotov et al. (2009) Zolotov, A., Willman, B., Brooks, A. M., et al. 2009, ApJ, 702, 1058