Searching for filaments and large-scale structure around DAFT/FADA clusters ††thanks: Based on our own data (see Guennou et al. 2014) and archive data obtained with MegaPrime/MegaCam, a joint project of CFHT and CEA/DAPNIA, at the Canada-France-Hawaii Telescope (CFHT) which is operated by the National Research Council (NRC) of Canada, the Institute National des Sciences de l’Univers of the Centre National de la Recherche Scientifique of France, and the University of Hawaii, and based on Subaru/SuprimeCam archive data. Also based on observations made with the Gran Telescopio Canarias (GTC), installed in the Spanish Observatorio del Roque de los Muchachos of the Instituto de Astrofísica de Canarias, in the island of La Palma. This research has made use of the NASA/IPAC Extragalactic Database (NED) which is operated by the Jet Propulsion Laboratory, California Institute of Technology, under contract with the National Aeronautics and Space Administration.
Abstract
Context. Clusters of galaxies are located at the intersection of cosmic filaments and are still accreting galaxies and groups along these preferential directions. However, because of their relatively low contrast on the sky, filaments are difficult to detect (unless a large amount of spectroscopic data are available), and unambiguous detections have been limited until now to relatively low redshifts ().
Aims. This project is aimed at searching for extensions and filaments around clusters, traced by galaxies selected to be at the cluster redshift based on the red sequence. In the redshift range of our sample, clusters are believed to be already well formed, but still to be accreting material along filaments.
Methods. We have searched for extensions and filaments around the thirty clusters of the DAFT/FADA survey for which we had deep wide field photometric data. For each cluster, based on a colour-magnitude diagram, we selected galaxies that were likely to belong to the red sequence, and hence to be at the cluster redshift, and built density maps. By computing the background for each of these maps and drawing contours, we estimated the elongations of the structures detected in this way. Whenever possible, we identified the other structures detected on the density maps with clusters listed in NED.
Results. We find clear elongations in twelve clusters out of thirty, with sizes that can reach up to 7.6 Mpc. Eleven other clusters have neighbouring structures, but the zones linking them are not detected in the density maps at a 3 level. Three clusters show no extended structure and no neighbours, and four clusters are of too low contrast to be clearly visible on our density maps.
Conclusions. The simple method we have applied appears to work well to show the existence of filaments and/or extensions around a number of clusters in the redshift range . We plan to apply it to other large cluster samples such as the clusters detected in the CFHTLS and SDSS-Stripe 82 surveys in the near future.
Key Words.:
Galaxies: clusters, large scale structure1 Introduction
Starting with the pioneering work of de Lapparent et al. (1986), observations based on spectroscopic redshifts have shown that galaxies were not distributed homogeneously on the sky, but were concentrated along filaments and sheets, with large regions almost devoid of galaxies. Since then, this result has been confirmed by many surveys, either shallow but covering large regions on the sky (e.g. 6dF, Jones et al. 2009; SDSS, Doroshkevich et al. 2004), or deep but limited to much smaller fields (e.g. VVDS, Le Fèvre et al. 2005). Numerical simulations of dark matter particles, which were started in the 1970s by Press & Schechter (1974) with a few thousand particles and that now reach billions of particles (70 billions in the Horizon simulation, Teyssier et al. 2009), have obtained similar results, with matter also concentrating along filaments and sheets, clusters of galaxies being located at the intersection of several filaments. Although clusters are believed to form mainly at redshifts , they appear still to be accreting galaxies and groups of galaxies along the filaments they are connected to, as suggested for example by the analysis of large spectroscopic surveys from which the dynamical properties of clusters can be derived (for example for the Coma cluster, based on 715 spectroscopic redshifts, Adami et al. 2009).
Several methods have recently been developed to detect filamentary patterns in large surveys, such as the Bisous model (Stoica et al. 2005), an object point process with interactions, whose topology is based on the Felix model (Shivashankar et al. 2015), or the FilFinder algorithm that is based on techniques of mathematical morphology (Koch & Rosolowsky 2015). The Bisous model has been used by Tempel et al. (2014a) to build a public catalogue of filaments based on the SDSS data release 8. The longest filaments in this catalogue can reach 60 h-1 Mpc at a maximum redshift of . Interesting results were obtained by this team, showing in particular that galaxies and groups are not uniformly distributed along filaments, but tend to form a regular pattern with a characteristic length of between 4 h-1 Mpc and 7 h-1 Mpc, depending on the statistics used (Tempel et al. 2014b). The existence of a statistically significant alignment between the satellite galaxy positions and filament axes was also found (Tempel et al. 2015), as well as an alignment between the orientation of galaxy pairs and their host filaments (Tempel & Tamm 2015).
However, the detection of filaments at the intersection of which clusters are located remains difficult and limited to relatively low-redshift clusters. At optical or infrared wavelengths, filaments have been found in a few systems, in particular between two neighbouring clusters, based on spectroscopic data. In some cases star formation appears enhanced, as seen between the clusters Abell 1763 and Abell 1770 (), where starburst galaxies are numerous (Edwards et al. 2010). Weak-lensing techniques have also allowed detecting filaments, such as that between Abell 222 and Abell 223, at redshift (Dietrich et al. 2012). According to Dietrich and collaborators, this filament coincides with an overdensity of galaxies and with diffuse, soft-X-ray emission, and contributes a mass similar to that of an additional galaxy cluster to the total mass of the supercluster. In X-rays, the detection of filaments remains difficult, however, because of their very faint emission (see e.g. the filament in Abell 85, which was interpreted as due to groups falling onto the main cluster, Durret et al. 2003, 2005).
In the present paper, we aim to search for filaments of galaxies around clusters at relatively high redshifts, taking advantage of the large database that we have collected in the DAFT/FADA survey for clusters in the redshift range. This survey comprises 90 clusters selected to be massive from their X-ray/ROSAT properties, and with HST images available in at least two bands. We then obtained deep imaging data in five optical bands and one infrared band, and as many galaxy spectroscopic redshifts as possible, either from our own observations with various telescopes (we were granted about 70 nights of telescope time altogether) and from archive data. A short description of the project can be found here: http://cesam.lam.fr/DAFT/index.php.
We applied a method that consists of selecting galaxies that are likely to belong to each cluster based on a colour-magnitude diagram, and of computing density maps for these selected galaxies with an adaptive kernel method to estimate the extent of the galaxy distribution around each cluster. This method is very similar to that applied by Kartaltepe et al. (2008) on fourteen clusters from the MACS sample at . This is an exploratory study to determine whether we can apply this method to search for extensions and filaments around a much larger sample of clusters.
The paper is organized as follows. The data and method with which we searched for filaments and estimated their lengths are described in Sect. 2, and results are shown in Sect. 3 and discussed in Sect. 4.
We transformed angles into physical units using Ned Wright’s Cosmology Calculator111http://www.astro.ucla.edu/ wright/CosmoCalc.html with H0=70 km s-1 Mpc-1, , and .
2 Data and method
2.1 Data
| Cluster name | RA | DEC | redshift | scale | telescope/ | filters | Nz | maglim,1 | maglim,2 |
|---|---|---|---|---|---|---|---|---|---|
| (J2000.0) | (J2000.0) | (kpc/arcsec) | camera | ||||||
| Cl0016+1609 | 4.63888 | 16.4433 | 0.5455 | 6.385 | M | 224 | 24.0 | 23.0 | |
| Cl J0152.7-1357 | 28.17083 | -13.9625 | 0.8310 | 7.603 | S | V, R | 201 | 25.5 | 25.0 |
| RCS J0224-0002 | 36.14320 | -0.0415 | 0.7730 | 7.419 | M | 7 | 24.0 | 22.5 | |
| PDCS 018 | 36.85625 | 0.6678 | 0.4000 | 5.373 | M | 39 | 25.0 | 23.5 | |
| XDCS cm J032903.1+025640 | 52.26175 | 2.9403 | 0.4122 | 5.471 | M | 1 | 25.0 | 23.5 | |
| MACS J0454.1-0300 | 73.54552 | -3.0187 | 0.5377 | 6.339 | M | 312 | 24.0 | 21.5 | |
| MACS J0647.7+7015 | 101.94125 | 70.2508 | 0.5907 | 6.637 | SC | V, I | 1 | 24.5 | 24.0 |
| MACS J0717+3745 | 109.39083 | 37.7556 | 0.5458 | 6.387 | S | V, I | 452 | 24.5 | 24.0 |
| MACS J0744.9+3927 | 116.21583 | 39.4592 | 0.6860 | 7.087 | SC | V, I | 72 | 24.5 | 24.0 |
| Abell 851 | 145.73601 | 46.9894 | 0.4069 | 5.429 | M | 126 | 24.5 | 23.5 | |
| SEXCLAS 12 | 163.15917 | 57.5137 | 0.7080 | 7.178 | M | 20 | 23.0 | 22.5 | |
| SEXCLAS 13 | 163.22583 | 57.5360 | 0.6640 | 6.992 | M | 20 | 23.0 | 22.5 | |
| RXC J1206.2-0848 | 181.54991 | -8.8000 | 0.4400 | 5.685 | M | 52 | 24.0 | 22.0 | |
| BMW-HRI J122657.3+333253 | 186.74167 | 33.5484 | 0.8900 | 7.765 | S | V, I | 1 | 24.0 | 23.0 |
| ZwCl 1332.8+5043 | 203.58333 | 50.5151 | 0.6200 | 6.786 | M | 4 | 24.0 | 24.0 | |
| MJM98 034 | 203.80742 | 37.8156 | 0.3830 | 5.231 | M | 23 | 24.5 | 23.5 | |
| LCDCS 0829 | 206.88333 | -11.7617 | 0.4510 | 5.767 | M | 47 | 24.0 | 22.0 | |
| 3C 295 cluster | 212.83396 | 52.2025 | 0.4600 | 5.831 | M | 29 | 24.0 | 23.5 | |
| MACS J1423.8+2404 | 215.95125 | 24.0797 | 0.5450 | 6.382 | S | V, I | 1 | 24.5 | 23.5 |
| RX J1524.6+0957 | 231.16792 | 9.9608 | 0.5160 | 6.206 | M | 2 | 24.0 | 24.0 | |
| RCS J1620.2+2929 | 245.05000 | 29.4833 | 0.8700 | 7.713 | M | 1 | 24.0 | 22.0 | |
| MACS J1621.4+3810 | 245.35000 | 38.1672 | 0.4650 | 5.867 | S | V, I | 2 | 24.5 | 23.5 |
| MS 1621.5+2640 | 245.89863 | 26.5638 | 0.4260 | 5.579 | M | 77 | 24.0 | 23.0 | |
| OC02 J1701+6412 | 255.35659 | 64.2368 | 0.4530 | 5.781 | M | 5 | 23.5 | 22.0 | |
| RX J1716.4+6708 | 259.20667 | 67.1417 | 0.8130 | 7.549 | S | V, R | 4 | 24.5 | 24.5 |
| NEP 0200 | 269.33083 | 66.5253 | 0.6909 | 7.108 | M | 4 | 24.5 | 23.5 | |
| CXOSEXSI J205617.1-044155 | 314.07150 | -4.6986 | 0.6002 | 6.686 | S/M | V, | 1 | 24.5 | 23.0 |
| MS 2053.7-0449 | 314.09321 | -4.6287 | 0.5830 | 6.596 | S/M | V, | 1 | 24.5 | 23.0 |
| MACS J2129.4-0741 | 322.35833 | -7.6911 | 0.5889 | 6.627 | SC | V, I | 48 | 24.0 | 23.0 |
| RX J2328.8+1453 | 352.20792 | 14.8867 | 0.4970 | 6.084 | M | 2 | 24.5 | 22.5 |
The data used for this work come from the DAFT/FADA survey and were first presented by Guennou et al. (2010) and then analysed by Guennou et al. (2014, hereafter G14). A list of all the data available for this survey can be found at http://cesam.lam.fr/DAFT/project.php. We limited our analysis to the thirty clusters of the DAFT/FADA survey for which CFHT/Megacam or Subaru/SuprimeCam wide field data are available in at least two photometric bands (obtained with the same telescope, except for MS 2053.7-0449 and CXOSEXSI J205617.1-044155), either from our own observations or from the archives. The fields of these two cameras are deg2 and arcmin2, respectively, and only one field per cluster is available. Whenever possible, the two photometric bands were chosen to bracket the 4000 Å break. For the five following qclusters this was not possible: Cl J0152.7-1357, BMW-HRI J122657.3+333253, ZwCl 1332.8+5043, RX J1524.6+0957, and RCS J1620.2+2929.
For three clusters (indicated with SC in the sixth column of Table 1) the Subaru/SuprimeCam archive images had too short exposure times to be usable, therefore we retrieved the CLASH catalogue222https://archive.stsci.edu/prepds/clash/ and based our analysis on the CLASH V and I band data. For MACS J0717+3745 we analysed both archive images and the CLASH data and found similar results. The full cluster list is given in Table 1. In the last two columns of this table, we give an estimate of the completeness limits of the two images from which the cluster galaxies were selected. For this, we have drawn magnitude histograms in 0.5 magnitude bins. To be conservative, we consider that the histograms are complete up to two bins below the bin where the counts flatten. The Subaru data are of course deeper than the Megacam data, but although our data are not fully homogeneous, they are of sufficient quality and homogeneity for a pilot study.
2.2 Method
To map the galaxy distribution around the clusters of our sample, we first selected the galaxies that have a high probability to be at the cluster redshift. For this, we first ran SExtractor (Bertin & Arnouts 1996) on the images to assemble catalogues with magnitudes in two bands for each cluster. The magnitudes we used are MAG_AUTO. We then separated galaxies from stars using a maximum surface brightness of the light profile versus magnitude diagram and eliminated stars. We then corrected for Galactic extinction using the maps of Schlegel et al. (1998).
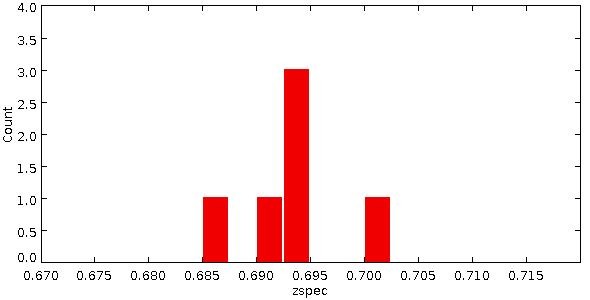
We also retrieved all the spectroscopic redshifts available in our own data and in NED for each cluster. Most of the redshift histograms thus obtained have been shown by G14, so we only show the redshift histograms that were not in G14 in Appendix C.
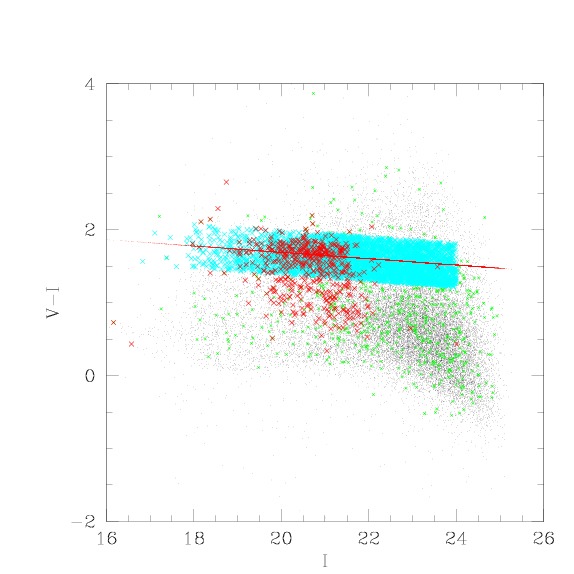
We then drew colour-magnitude diagrams for each cluster and superimposed the positions of the galaxies with spectroscopic redshifts that belong to the cluster. This allowed defining the red sequence of the early-type galaxies that belong to the cluster and to fit it with a linear function. Because the red sequence slope has been observed to not evolve across the redshift range considered here (e.g. De Lucia et al. 2007), we assumed a fixed slope of . Since for many clusters we only have a few spectroscopic redshifts, we preferred to take a fixed slope for the red sequence; this is the same we used in several of our papers (Durret et al. 2011a, Martinet et al. 2015a), to treat all the clusters in a consistent way. For the same reason, we also chose to select the same width of on either side of the red sequences of all the clusters. This value is often used in the literature (see e.g. Laganá et al 2009 and references therein). For the clusters with many spectroscopic members, this value allows encompassing these members quite well, as in Fig. 1. These choices are obviously simplifications, since the red-sequence slope and width are not exactly the same for all bands, but with the available data we would add noise by applying a more elaborate selection. Only galaxies with magnitudes brighter than (or the equivalent in other filters) were taken into account to perform the red sequence fit. We then selected all the galaxies within magnitudes of this sequence as probable cluster members, as illustrated in Fig. 1 for MACS J0717+3745. For clusters that only have a few spectroscopic redshifts, we imposed a value of the intercept by eye, based on the determinations computed for clusters with many spectroscopic redshifts, and requesting that the intercept increases with redshift in agreement with the colours given by Fukugita et al. (1995). We then extracted the catalogue of probable cluster galaxies in the same way as above.
We thus obtained for each cluster a catalogue of galaxies that are likely to belong to the cluster (hereafter “cluster galaxies”). For each cluster, we then computed a 2D density map based on the cluster members selected with the red sequence. To do this, we applied the adaptive kernel technique with a generalized Epanechnikov kernel as suggested by Silverman (1986). A summary of our implementation is given in Dantas et al (1997). It is based on an earlier version developed by Timothy Beers (ADAPT2) and further improved by Biviano et al. (1996). The statistical significance is established by bootstrap resampling of the data. A density map is computed for each new realisation of the distribution. For each pixel of the map, the final value is taken as the mean over all realisations. A mean bootstrapped map of the distribution is thus obtained (see Mazure et al., 2007). The number of bootstraps used here is 100.
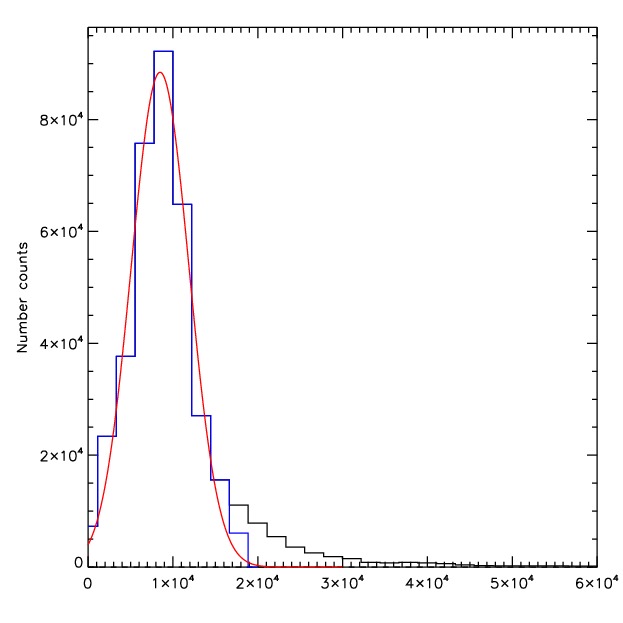
To derive the significance level of our detections, it is necessary to estimate the mean value and dispersion of the background of each image. For this, we drew the histogram of the pixel intensities for each density map. An example is shown in Fig. 2 for MACS J0717+3745. We applied a 2.5 clipping to eliminate those pixels of the image that have high values and correspond to objects in the image. We then redrew the histogram of the pixel intensities after clipping and fitted this distribution with a Gaussian. For each cluster, the mean value of the Gaussian will give the mean background level, and the width of the Gaussian will give the dispersion, which we call . We then computed the values of the contours that correspond to 3 detections as the background plus 3. In all the figures of the following Section where density maps with contours are presented, we show contours starting at 3 and increasing by 1. As mentioned in the previous subsection, the depths of all the images do not strongly differ from one cluster to another for a given telescope and filter, therefore the Megacam density maps on the one hand and the Subaru maps on the other hand can be considered as roughly homogeneous. Hence, our 3 detections can be considered as roughly homogeneous, at least for a given telescope and set of filters.
Interestingly, for several clusters for which the red sequence was defined by two sets of filters (for example and , and and ) the significance level of the detection is higher when the filter set brackets the 4000 Å break well, but the extent of the detection on the density map remains roughly the same. This gives us confidence on the detections achieved even for filter sets that do not bracket the 4000 Å break well.
2.3 Reliability tests of the galaxy selection
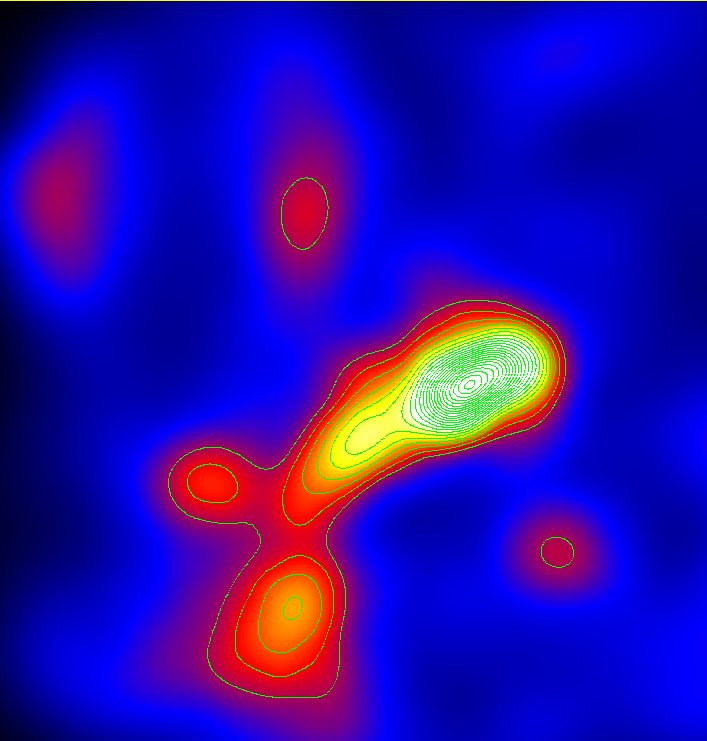
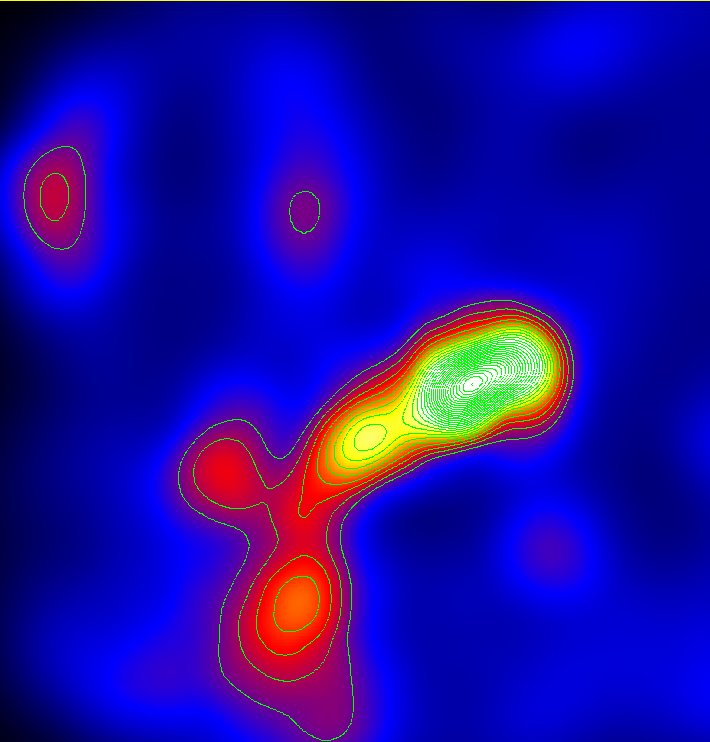
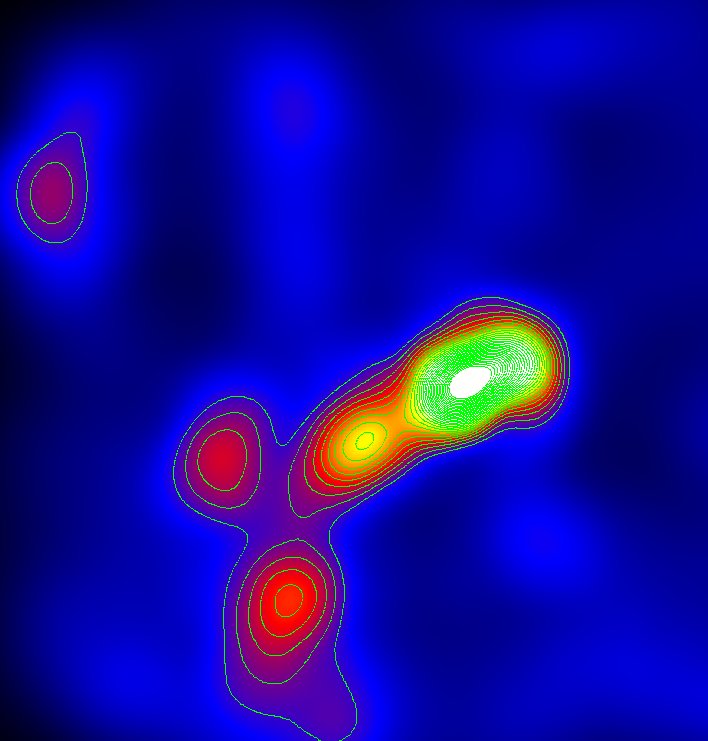
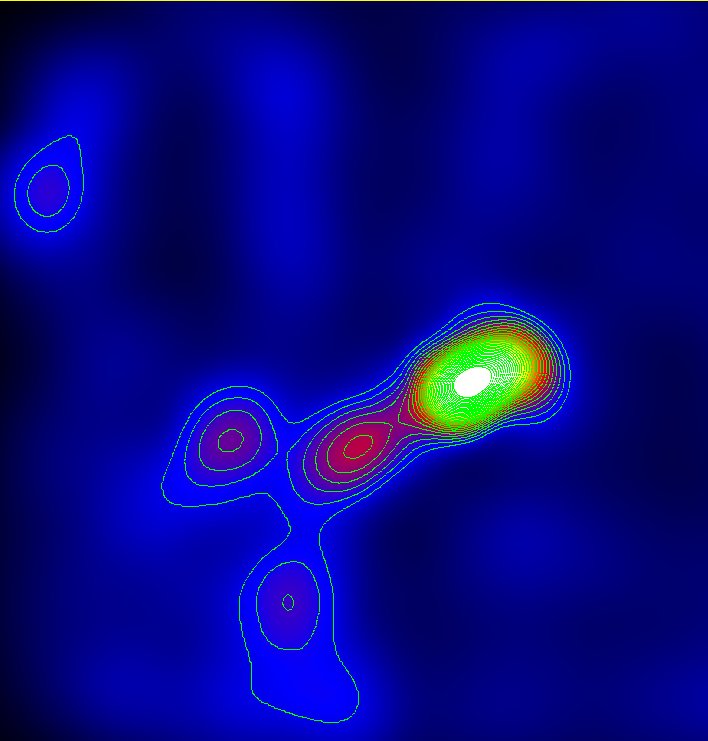
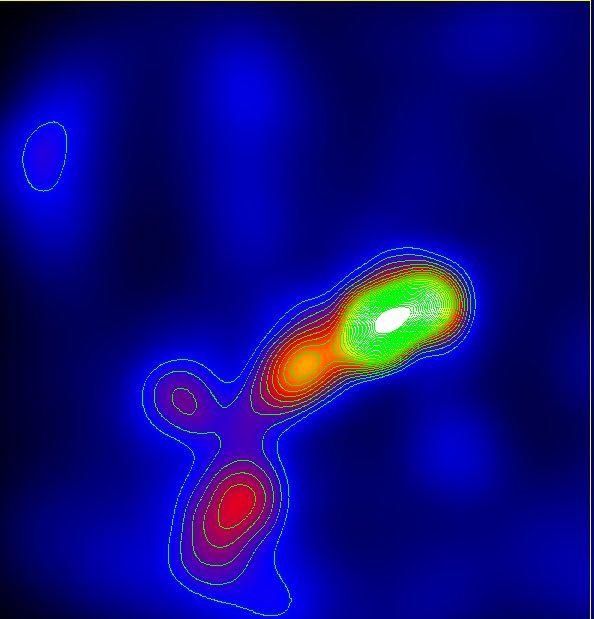
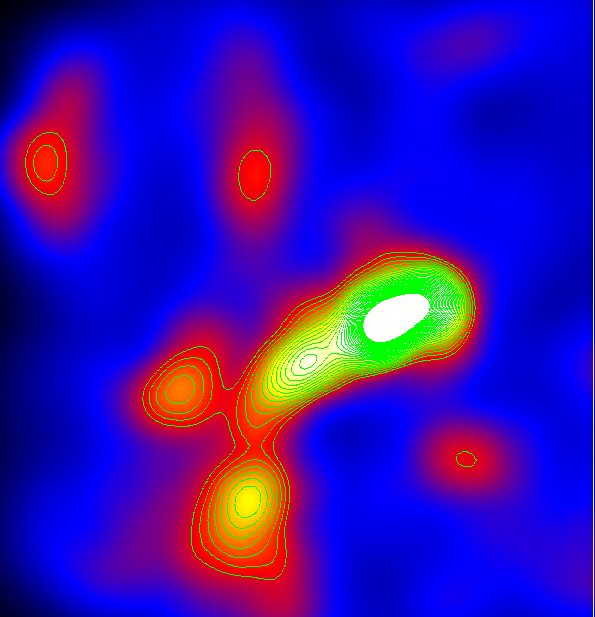
To test the reliability of our density maps, we made several tests on MACS J0717+3745, a bright cluster for which hundreds of spectroscopic redshifts are available. Our best fit is , with . Keeping our selection of galaxies within magnitudes from the red sequence, we first changed the value of by steps of 0.25, and built density maps for the following values: 2.50, 2.75, 3.00, and 3.25. Figure 28 clearly shows for that the cluster and its filament are detected with the largest extent at . The value gives similar results, but with a somewhat smaller extension, while the cluster fades for and 3.25. Second, we fixed and selected galaxies within and from the red sequence. Results are shown in Fig. 29. The best compromise is because reduces the cluster extension and adds noise by making other structures appear on the density map, which are probably mostly foreground structures. We therefore conclude that the parameters chosen to select the “cluster galaxies” that were used to compute the density maps are the best choice, and our detections remain reliable even if these parameters change slightly. This is important in particular for clusters for which the red sequence is more difficult to determine because only a few spectroscopic redshifts are available for them.
2.4 Reliability tests of the cluster detection levels
When studying the BMW-HRI J122657.3+333253 cluster, we faced several problems that led us to test the method we used to estimate the detection levels of our clusters.
First, our Subaru/SuprimeCam image suffered from contamination by diffuse light that is due to the bright nearby galaxy NGC 4395, which is located about 20 arcmin west of the cluster centre. Because this diffuse light was not masked during the SExtractor processing, a number of false detections were included in our catalogue, all of them on the west side of the field, and these spurious objects also strongly contaminated the cluster red sequence.
We therefore cut the density map to eliminate this structure and calculated contour levels. After this cut, Fig. 30 (top) shows three bright structures close to the image edges, but BMW-HRI J122657.3+333253 is not detected at the level. However, we clearly see the cluster, the position of which is indicated with a white circle in Fig. 30, and it corresponds to the X-ray detection (see G14, Fig. A.19).
This might mean that very bright structures artificially increase the level of the background we compute, and therefore also that of the contours required for an object to be considered as detected. We therefore made two attempts. First, we cut the density map to eliminate the three bright sources at the edges of the field and recomputed the contour levels. With this approach, BMW-HRI J122657.3+333253 is detected at , as seen in Fig. 30 (middle). Second, we cut the galaxy catalogue to the same size as the middle figure and recomputed the density map. The result is shown in Fig. 30 (bottom). Here, the cluster is detected at and structures that were too faint to be clearly visible before are now clearly detected. East of the cluster, a structure is detected at the level. It coincides with structure 1 in M15, which can be identified in NED with the cluster X-class 1808, at redshift . These detection levels are to be taken with caution, however, as the area over which the background has been estimated is too small to provide reliable statistics.
This shows that very bright sources in the field can artificially enhance our estimation of the background of the density map and cause us to underestimate the significance level of the structures that we detect. In addition, the initial smoothing scale applied to the data (i.e. the initial kernel dimension) depends on the 2D galaxy distribution in our sample. Very bright sources in the field tend to slightly oversmooth our 2D density maps in regions of lower density (compared to the density of very bright sources, including the cluster we are trying to detect). As a result, we might lose some details in the close environment of the cluster if sources brighter than the cluster are present in the field (as seen in the tests for BMW-HRI J122657.3+333253).
We therefore made a fourth attempt, which was to trim the catalogue of cluster galaxies to eliminate NGC 4395 as well as other edge effects (seen as bright sources in the corners of the density map), and we recomputed the density map. We consider this last map as the final result for BMW-HRI J122657.3+333253, as presented in Sect. 3.2.6. and Fig. 20. However, we must keep in mind that the significance levels we report may be underestimated when very bright structures are present as well. We checked that none of the other clusters showed such strong edge effects.
As a further test, we considered the cases of the five clusters where a structure with a brightness similar to or higher than that of the cluster was present in the density map: ZwCl 1332.8+5043, RCS J0224-0002, PDCS 018, XDCS cm J032903.1+025640, and MJM98 034. We spatially cut the cluster galaxy catalogues (i.e. the galaxies selected to belong to each of these clusters) and recomputed the density maps and contours (as in the bottom panel of Fig. 30). In all cases, the significance levels of the cluster detections increased by a modest amount () and the cluster extents became only slightly larger. This means that the contamination only becomes important when an object with a brightness higher than that of the cluster is present.
3 Results
We present our main results in this section. They are based on the density map of each cluster, onto which we superimposed the intensity contours computed as explained above, starting at . We only show those parts of the images in the figures that contain information. However, the background was always computed on the entire images. To indicate the scale, we plot a circle of 1 Mpc radius in all figures. This is centred on the position of the cluster taken from NED and given in Table 1. In some cases the circle is not exactly centred on the maximum of the galaxy density map. This is probably because the cluster position given by NED can have different origins (the brightest cluster galaxy, the X-ray maximum, or the centroid of the X-ray emission, etc.). We briefly discuss this question for each object when this is the case.
Figures 3 to 27 show the galaxy density maps. Yellow denotes the highest density, purple the lowest, and dark blue corresponds to no galaxies. These figures are illustrative, and the scales and density levels are not the same in each figure.
For each cluster, an approximate size of the extension was obtained by adjusting by eye an ellipse that fits the contours best. The major and minor axes of the ellipses are given in Table 2 for the extended objects. Two ellipses were necessary for MACS J0717+3745, but for all the other objects, a single ellipse was sufficient.
Whenever possible, we compare our results with the mass distributions derived by Martinet et al. (2015b, hereafter M15) with a weak-lensing analysis, and in some cases also from X-rays. These three methods are complementary. For a given cluster, the density map at the cluster redshift is sensitive to clusters and filaments in the plane of the sky. On the other hand, weak lensing detects mass along the line of sight, and therefore clusters and filaments regardless of their orientation, but it can be contaminated by projection effects of foreground and background structures. Finally, X-rays trace the hot baryons of groups and clusters.
We separate our results into four different subsections: the twelve clusters showing an extended structure and/or filaments detected at a level, the eleven clusters with neighbouring structures but showing no large elongation or filament detected at a level, the three clusters showing no large extension and no significantly detected neighbouring structures or filaments, and the four clusters whose contrast is too low to be detected at on the density maps.
3.1 Twelve clusters showing an extended structure and/or filaments
| Cluster name | a (Mpc) | b (Mpc) |
|---|---|---|
| Cl0016+1609 | 7.4 | 3.2 |
| 4.8 | 3.4 | |
| MACS J0647.7+7015 | 6.8 | 2.2 |
| MACS J0717+3745 | 6.0 | 1.8 |
| 3.2 | 2.1 | |
| MACS J0744.9+3927 | 3.8 | 1.5 |
| RXC J1206.2-0848 | 5.7 | 2.4 |
| ZwCl 1332.8+5043 | 5.8 | 5.4 |
| LCDCS 0829 | 7.5 | 3.3 |
| MACS J1423.8+2404 | 6.0 | 3.0 |
| MACS J1621.4+3810 | 7.6 | 2.1 |
| MS 1621.5+2640 | 6.0 | 3.8 |
| RX J1716.4+6708 | 3.5 | 1.1 |
| MACS J2129.4-0741 | 3.7 | 1.6 |
We first present here the twelve clusters in which we detect an extended or elongated structure and/or filaments.
3.1.1 Cl 0016+1609 (z=0.5455)
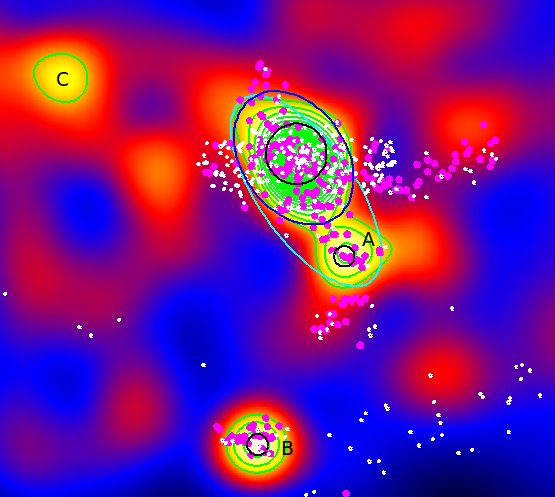
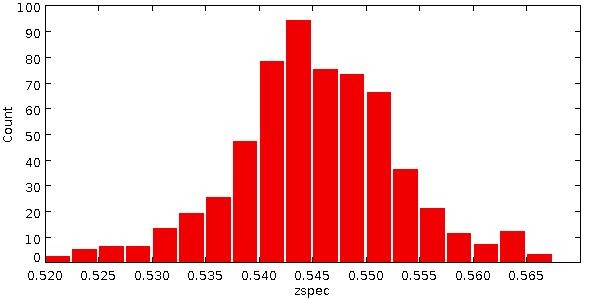
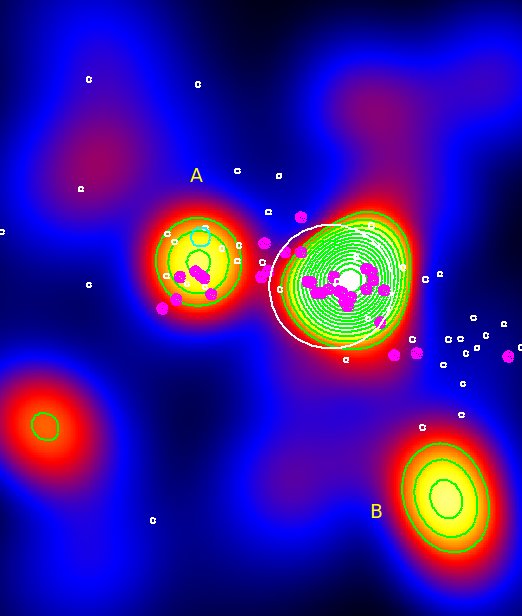
Cl0016+1609 has an elongated structure at least 4.8 Mpc in length (Fig. 3) and several possible companion clusters. The cluster RXJ0018.3+1618 (at ) found in NED and shown as a small black circle labelled A is detected at . It is probably a low-mass companion of Cl0016. It is located 9.8 arcmin (3.8 Mpc at the cluster redshift) south-west of Cl0016 and is also mentioned by Kartaltepe et al. (2008). The total extent of the system including Cl0016+1609 and cluster A is 7.4 Mpc (see Table 2). A source labelled B is detected at 25.3 arcmin (9.7 Mpc) south of Cl0016 and can be identified in NED with the cluster RX J0018.8+1602 at . Higuchi et al. (2015) calculated the virial masses for Cl0016+1609 and RX J0018.8+1602 and found respective values of M⊙ and M⊙. The source labelled C detected at north-north-east of Cl0016 has no identification in NED. There are 292 spectroscopic redshifts in the range; their distribution is roughly Gaussian.
3.1.2 MACS J0647.7+7015 (z=0.5907)
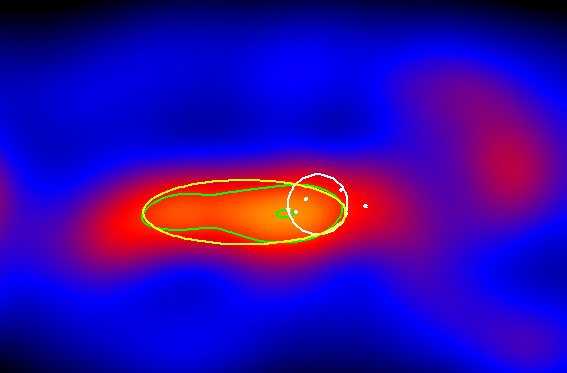
MACS J0647.7+7015 appears elongated (Fig. 4) but only at the level. We can note, however, that Kartaltepe et al. (2008) detected a rather large elongation for this object.
3.1.3 MACS J0717+3745 (z=0.5458)
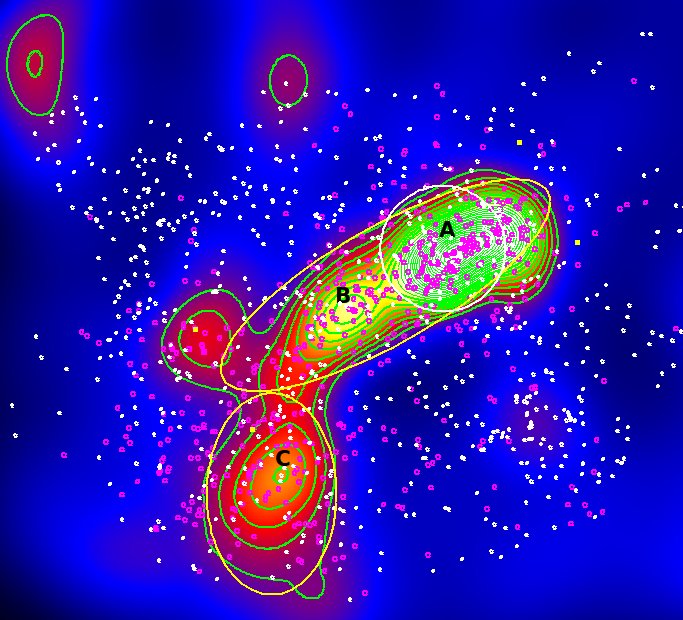
MACS J0717+3745 is a very massive cluster ( M⊙ according to M15) that is known to be an extreme merger in X-rays (Mann & Ebeling 2012). Figure 5 shows a first elongation of about Mpc that contains the main cluster labelled A (structure 1 in M15) and a second massive structure labelled B (structure 2 in M15) to the south-east. A second elongation of about Mpc (labelled C and coinciding with structure 3 in M15) is detected farther south. Figure 5 is similar to Fig. 2 of Kartaltepe et al. (2008). As discussed by M15, neither of these elongations is strongly detected in X-rays, which means that they are probably formed by one or two filaments and not only by clusters merging at large scales. We note that this filament was previously reported by Jauzac et al. (2012) and Medezinski et al. (2013) and is the longest and strongest filament detected in our sample of clusters. There are 577 spectroscopic redshifts in the range, the histogram of their distribution is shown in Fig. 32.
3.1.4 MACS J0744.9+3927 (z=0.6860)
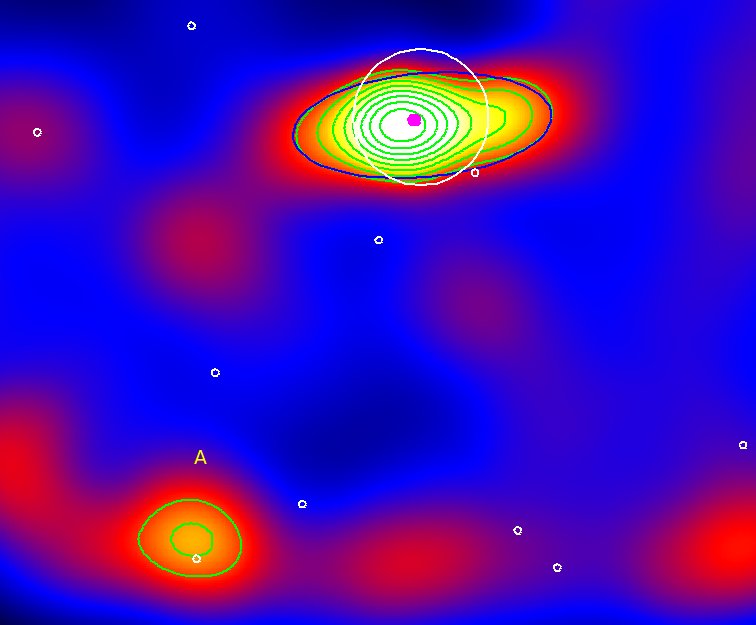
MACS J0744.9+3927 (z=0.6860) is detected at the level and shows an elongation reaching almost 4 Mpc in the east-west direction (Fig. 6). This cluster has a high mass, as derived both from X-rays ( M⊙ (G14)) and from weak lensing ( M⊙ (Applegate et al. 2014)). Only two spectroscopic redshifts are available in the range.
3.1.5 RXC J1206.2-0848 (z=0.4400)
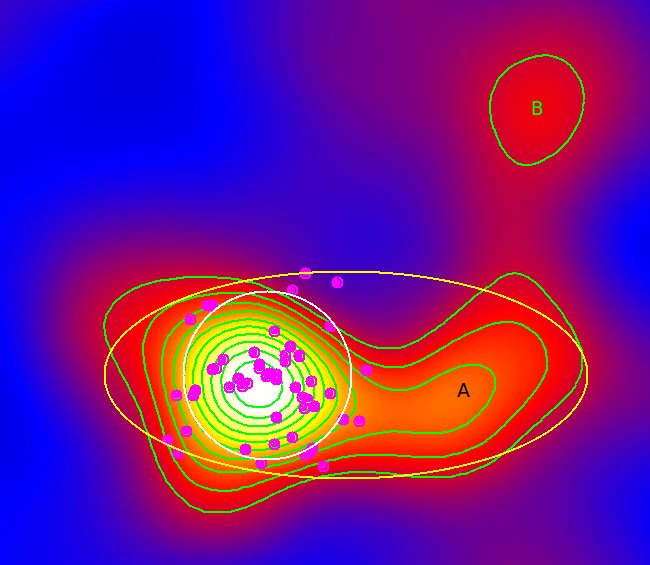
RXC J1206.2-0848 shows an elongation towards the west (labelled A) that may be a second less massive cluster (see Fig. 7). A fainter structure (labelled B) is detected at north of the second one and seems linked to it by a filament of galaxies, but the detection level of this possible filament is below . We were unable to identify these two structures with clusters in NED. Several other features are detected in the field, but barely at a level, therefore we only plot these structures in Fig. 7. Fifty-two spectroscopic redshifts are available in the interval, but none in the filament.
3.1.6 ZwCl 1332.8+5043 (z=0.6200)
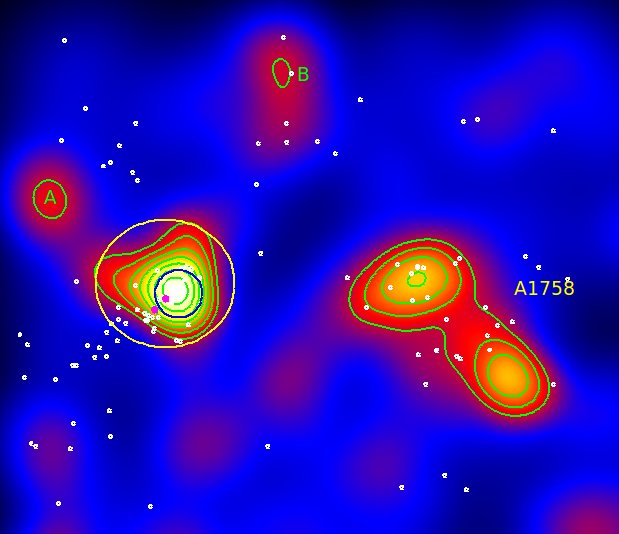
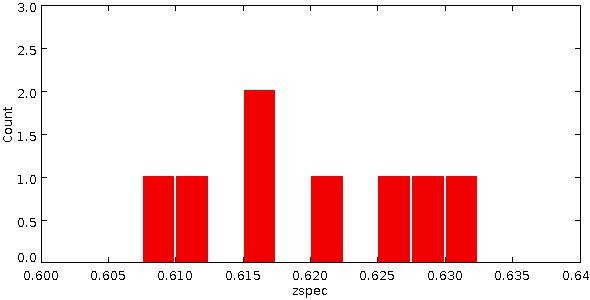
ZwCl 1332.8+5043 is detected at a level in the density map (Fig. 8). Matter may be present between the cluster and the structure labelled A detected at to the north-east, but its detection level is below and there is no identification in NED for this north-eastern structure. Neither is there a NED identification for the structure labelled B. The two features seen west of the cluster can be identified with the double cluster Abell 1758 North and South at . We give in Table 3 the new redshifts measured with the GTC and OSIRIS in this field and the redshift histogram obtained with these new redshifts and those found in NED in Fig. 33. Unfortunately, only a few discordant spectroscopic redshifts are available in this zone.
3.1.7 LCDCS 0829 (z=0.4510)
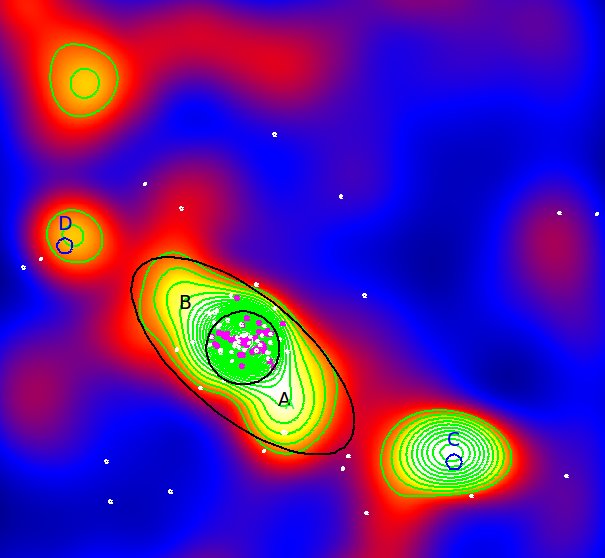
LCDCS 0829 (often known as RX J1347.5-1145) is a very hot and quite massive cluster ( M⊙ in M15) that shows two bright substructures north and south of the cluster in X-rays (G14). These structures more or less coincide with those labelled A and B within the black ellipse of Fig. 9. A third structure (labelled C and coinciding with structure 2 in M15), much brighter than B, is detected 18 arcmin to the south-west and can be identified with LCDCS 0825 at redshift . A fourth structure (labelled D) north-east of LCDCS0829 is detected at and can be identified with LCDCS 0833, at . The differences in redshift suggest no link between LCDCS 0829 and its neighbours in projection on the sky. The redshift histogram of the 43 galaxies with in LCDCS 0829 is roughly Gaussian and suggests that this cluster cannot be far from dynamical equilibrium.
3.1.8 MACS J1423.8+2404 (z=0.5450)
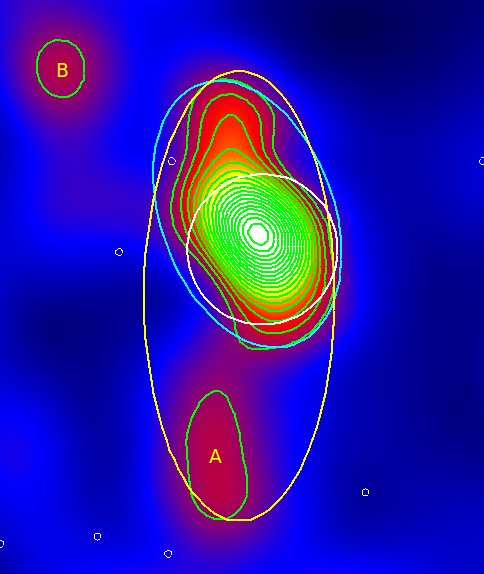
MACS J1423.8+2404 is a rather massive cluster ( M⊙ in M15) showing elongations to the north and south (the cyan ellipse on Fig. 10) that coincide with those detected in X-rays by G14. It also shows a large structure to the south labelled A within the yellow ellipse in Fig. 10 and a fainter one about 9 arcmin to the north-east, labelled B. Both are only detected at and are not detected by Kartaltepe et al. 2008). If the southern structure is indeed linked to the main cluster, the total elongation is about Mpc2 (the yellow ellipse), if this is not the case, it is only Mpc2 (the cyan ellipse). No redshift close to that of the cluster is available.
3.1.9 MACS J1621.4+3810 (z=0.4650)
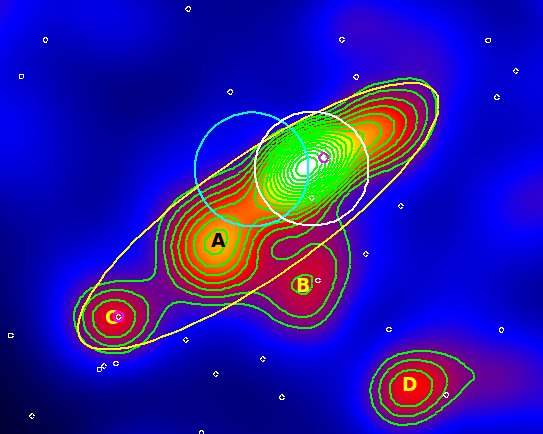
MACS J1621.4+3810 is a moderately massive cluster ( M⊙ in M15) that appears to be embedded in a multiple structure at least 7.6 Mpc long along a north-west – south-east direction (the yellow ellipse in Fig. 11), including structures A and C (C coincides with structure 3 in M15). MACS J1621.6+3810 is also part of this structure, but does not appear clearly, probably because it is not very massive. Two other structures are visible south (B) and south-west (D) of the main cluster. Although no identifications with clusters can be made from NED, this system could be a supercluster and deserves a detailed dynamical analysis. This would require new data, since no redshift close to that of the cluster is available at present. Only three spectroscopic redshifts are available.
3.1.10 MS 1621.5+2640 (z=0.4260)
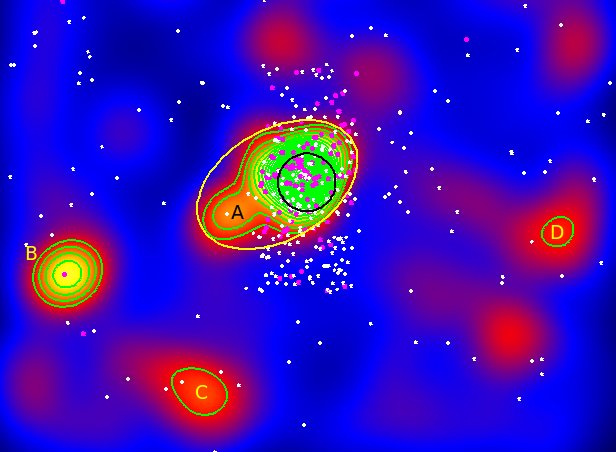
MS 1621.5+2640 is a rather massive cluster ( M⊙ in M15) with a much less massive companion structure located to the south-east (labelled A, within the yellow ellipse in Fig. 12), which is not detected in the weak-lensing map of M15. Several other structures are visible on the density map: a detection to the south-east (labelled B) that can be identified with FSVS_CL J162412+263008 at , and two detections to the south and west (labelled C and D) with no NED identifications. There are 132 spectroscopic redshifts in the interval, and the redshift histogram appears to be roughly Gaussian, but there is no spectroscopic information on object A (within the yellow ellipse of Fig. 12).
3.1.11 RX J1716.4+6708 (z=0.8130)
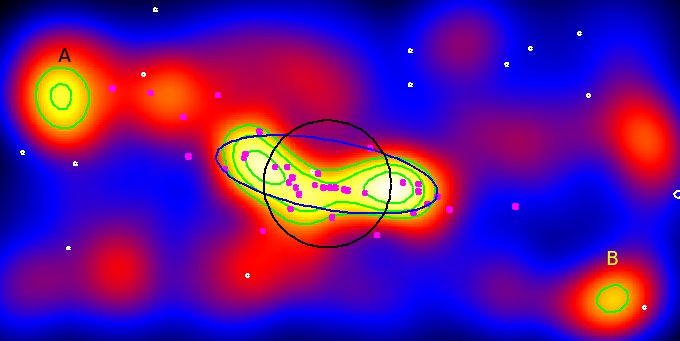
RX J1716.4+6708 is a very massive cluster ( M⊙ in M15) showing a double structure elongated roughly in the east–west direction (Fig. 13). A third structure labelled A is detected 9.7 arcmin (4.4 Mpc at the cluster redshift) towards east-north-east. Galaxies may be present between these structures, but their detection does not reach . A fourth structure, labelled B, is located 10.7 arcmin (4.9 Mpc at the cluster redshift) to the south-west. Thirty-seven spectroscopic redshifts are available in the cluster range (), and their histogram is shown in Fig. 34. The flat spectroscopic redshift histogram implies that there are at least two dynamical systems (or more), as confirmed by a Serna-Gerbal analysis (Serna & Gerbal 1996), which implies the existence of merging events occurring in a plane different from that of the sky (G14). It would be interesting to analyse this system in detail from a dynamical point of view with more spectroscopic redshifts, since we might be witnessing a protocluster still in the process of forming, as suggested by Henry et al. (1997).
3.1.12 MACS J2129.4-0741 (z=0.5889)
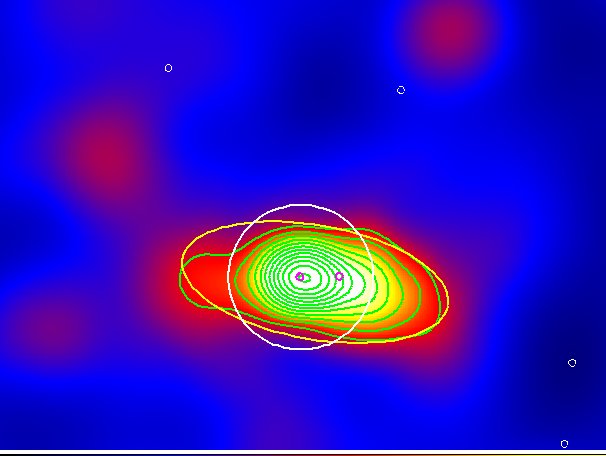
For MACS J2129.4-0741 the density map shows a strong detection, and its structure seen in Fig. 14 is quite similar to that found by Kartaltepe et al. (2008). The cluster is clearly asymmetric and elongated roughly along the east-west direction, possibly due to a merger.
This cluster must be of rather low mass, since Applegate et al. (2014) were unable to determine its mass through weak lensing. There is no other source detected at in the density map, and only two spectroscopic redshifts are available in the cluster range.
3.2 Eleven clusters with neighbouring structures, but without extensions or filaments detected at a level
We now present the eleven clusters that have neighbouring structures, but no filaments or large extensions detected at a level.
3.2.1 Cl J0152.7-1357 (z=0.831)
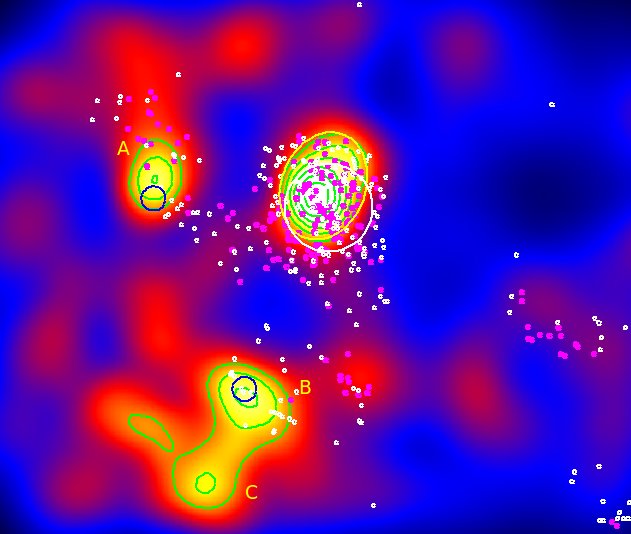
Cl J0152.7-1357 is a very massive cluster ( M⊙ in M15) known to include two structures that are in the process of merging (G14, and references therein), within the 1 Mpc radius circle of Fig. 15. North-north-west of this circle lies an elongation (the yellow ellipse) that suggests another possible merger at this scale. Several other structures are visible in Fig. 15. The structure (labelled A) 8.8 arcmin to the east can be identified in NED with the cluster [BGV2006] 008 at , while the structure (labelled B, and corresponding to structure 4 in M15) 10.0 arcmin to the south-east coincides in position with X-CLASS 0442 at . Since both are foreground clusters, there is no supercluster in the region of Cl J0152.7-1357. The structure labelled C has no counterpart in NED. There are 201 galaxies with spectroscopic redshifts in the range. The corresponding redshift histogram is roughly bimodal, with 81 galaxies in the interval and 120 galaxies in the range. The positions of these two systems appear superimposed on the sky, implying that the merger is taking place more or less in the plane of the sky (also see G14 and Girardi et al. 2005).
3.2.2 RCS J0224-0002 (z=0.7730)
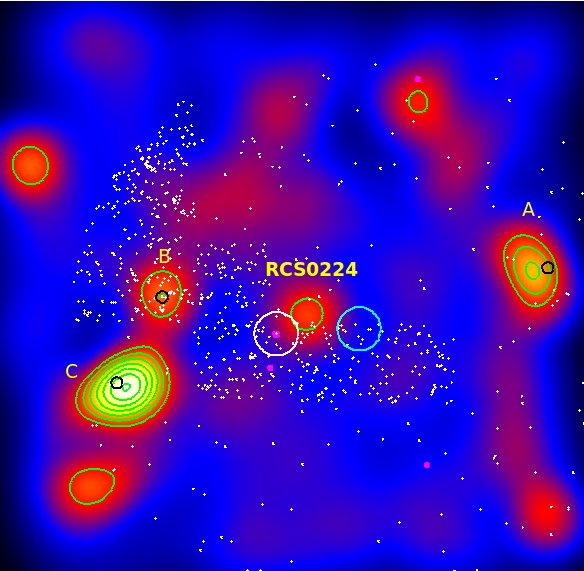
RCS J0224-0002 (z=0.7730) was discovered by Gladders et al. (2002) to be a massive cluster showing a system of gravitational arcs. We note that the position given by NED corresponds to the name given by Gladders et al. (2002) with truncated coordinates, 02 24, -00 02, while on the Megacam image the centre of the cluster is roughly located at RA=02h24mn34.368s, DEC=02’29.4”. We indicate the latter position in Table 1 and show both positions in Fig. 16. We only detect RCS J0224-0002 at the level (between the two cluster positions mentioned above), probably because it is quite distant and the exposure times of our images are rather short (1492 s in and 660 s in ). The structures labelled A, B, and C can be identified with clusters in NED that have photometric redshifts in the range 0.41-0.45 and therefore cannot be in the vicinity of RCS J0224-0002. There are only five spectroscopic redshifts in the range.
3.2.3 PDCS 018 (z=0.4000)
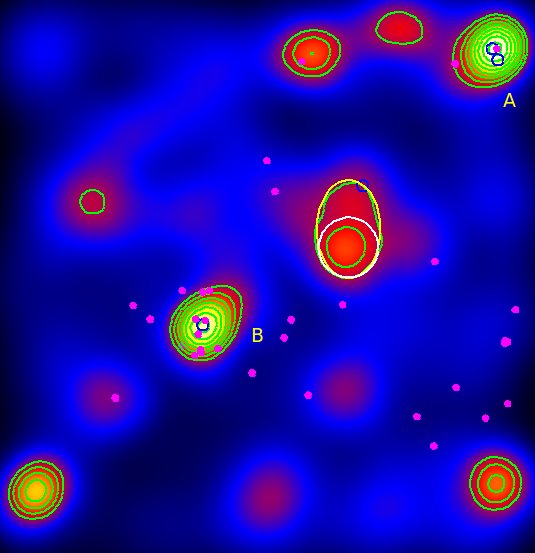
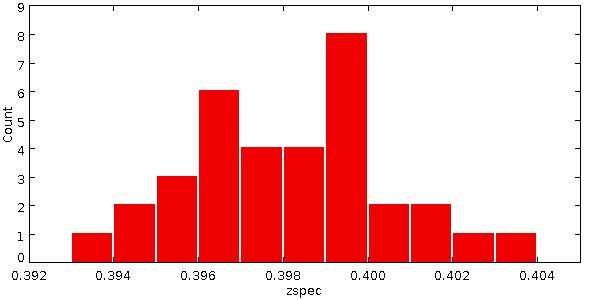
PDCS 018 is a cluster for which very little information is available: it has only three references in NED, all from the Palomar Distant Cluster Survey (Postman et al. 1996). In Fig. 17, PDCS 018 appears to be elongated in the north-south direction, possibly due to an ongoing merger, but in the absence of X-ray data it is difficult to make a definite statement. Two bright structures are seen in the density map 25.2 arcmin north-west (labelled A) and 17.1 arcmin south-east (labelled B) of the cluster. The north-western structure coincides with two clusters in NED: NSCS J022635+010002 at and VGCF 30 at . The latter structure would be located 8.1 Mpc from PDCS 018 since they are at the same redshift. The south-eastern structure can be identified with WHL J022825.9+003202 at photo. The other detected structures have no identification with groups or clusters in NED. Thirty-four spectroscopic redshifts are available in the [0.393,0.404] range in a 30 arcmin radius zone. None coincides with the cluster position (given by NED), but a number of redshifts in the cluster redshift range are visible throughout Fig. 17 (the pink points), suggesting that we are indeed seeing the large-scale structure in this region. The spectroscopic redshift histogram is shown in Fig. 31. We may therefore be observing a system of several clusters of which PDCS 018 is not the brightest.
3.2.4 XDCS cm J032903.1+025640 (z=0.4122)
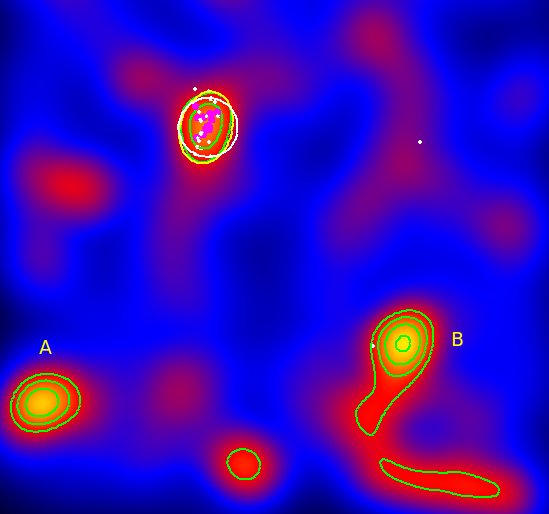
XDCS cm J032903.1+025640 is a low-mass cluster according to G14 (M M⊙). Figure 18 suggests that it could be embedded in a network of structures and/or filaments, with at least four other structures detected at a level and above. However, there is no identification in NED for the two bright structures south-east (A) and south-west (B) of the cluster, and the filaments are too faint to be characterised accurately. Only 13 spectroscopic redshifts are available in the range, all within the 1 Mpc radius circle.
3.2.5 Abell 851 (z=0.4069)
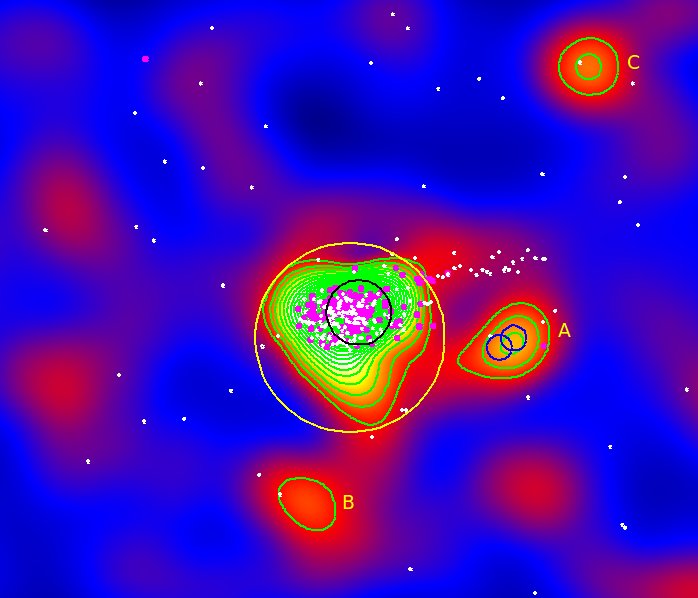
Abell 851 is a moderately massive ( M⊙ in M15) and highly substructured cluster (G14), and the mass distribution derived from weak lensing (M15) is quite similar to the galaxy density map shown in Fig. 19. The structure (labelled A) visible 15.0 arcmin (4.9 Mpc at the cluster redshift) west of the cluster roughly corresponds to structure 5 in M15 and is linked to Abell 851 by a filament that does not quite reach a detection. It could be identified with two objects in NED: either the galaxy group ABELL 0851:[KKN2011] West or the cluster WHL J094203.2+465603 at photo=0.4606. A weak structure (B) is detected 18.8 arcmin (6.1 Mpc) south of the cluster, possibly linked to the cluster, but the linking matter is not detected at . A third structure (C) is detected 32 arcmin (10.4 Mpc) north-west of the cluster. Neither B nor C have identifications in NED. There are 208 spectroscopic redshifts in the range, mostly concentrated in the cluster itself, and their histogram is quite perturbed, as expected from a merging cluster.
3.2.6 BMW-HRI J122657.3+333253 (z=0.8900)
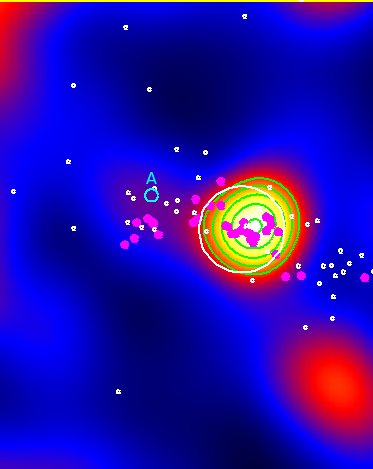
BMW-HRI J122657.3+333253 is the most distant cluster of the DAFT/FADA sample and gave us the opportunity to discuss our method for calculating significance contours, as described in Sect. 2.4. Our final choice was to cut the catalogue to eliminate the four sides of the image where edge effects were present, as well as the zone that was contaminated by NGC 4395. The result is shown in Fig. 20. Here, the cluster is detected at , but X-class 1808 is not detected (the cyan circle labelled A). In view of the differences in redshift, there is no physical link between this cluster and BMW-HRI J122657.3+333253.
Thirty-four spectroscopic redshifts are available in the interval, out of which 24 are in the range .
3.2.7 [MJM98] 034 (z=0.383)
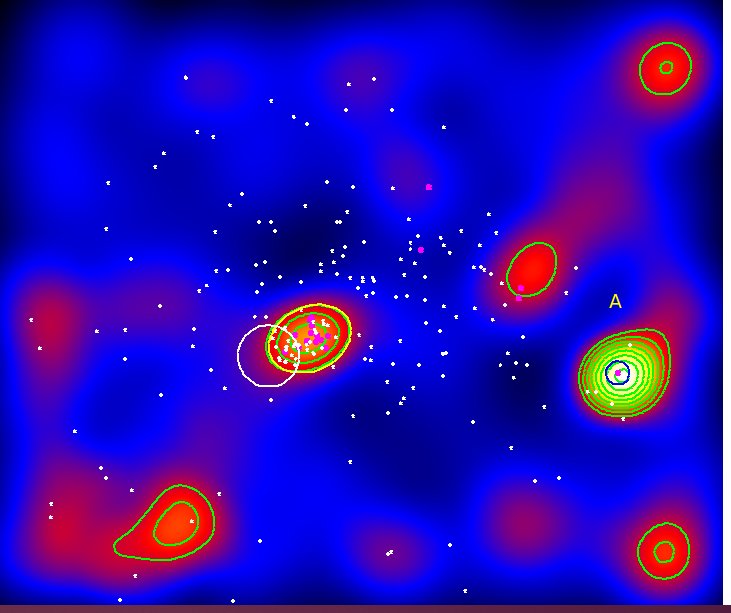
[MJM98] 034 was discovered by McHardy et al. (1998) in a ROSAT image. These authors considered its identification as certain, but gave an uncertain redshift , and due to the offset of 9.35 arcmin relatively to the centre of the ROSAT field, the coordinates of this cluster are probably not very accurate. The coordinates and redshift published by McHardy et al. (1998) are those currently available in NED. Based on XMM-Newton data, Mehrtens et al. (2012) did not give a different or more precise position, and the redshift in their Table 3 is . However, as briefly discussed by G14, the 16 galaxy redshifts that we extracted from NED around [MJM98] 034 give a mean value , therefore we chose to select cluster galaxies assuming this value. In the density map of Fig. 21 the cluster is detected at a level 4.5 arcmin north-west of its NED position. Of the 23 galaxies with spectroscopic redshifts in the range found in the entire deg2 field, about 10 coincide with the structure that we identify as [MJM98] 34 in the density map, suggesting that its identification with a cluster at is correct. Several other structures are visible in Fig. 21, but no filament is detected between the various structures at a 3 level. The bright feature (labelled A) 36.8 arcmin to the west can be identified with the cluster WHL J133249.0+374710 at photo=0.3821. If [MJM98] 034 is indeed at , these two clusters could form a pair. However, the projected distance of these two clusters on the sky would be rather large: about 11.5 Mpc.
We also tried to select cluster galaxies assuming to place the red sequence, but the detection level of the cluster is then below . This is another argument to assume that [MJM98] 34 is at .
3.2.8 3C 295 (z=0.4600)
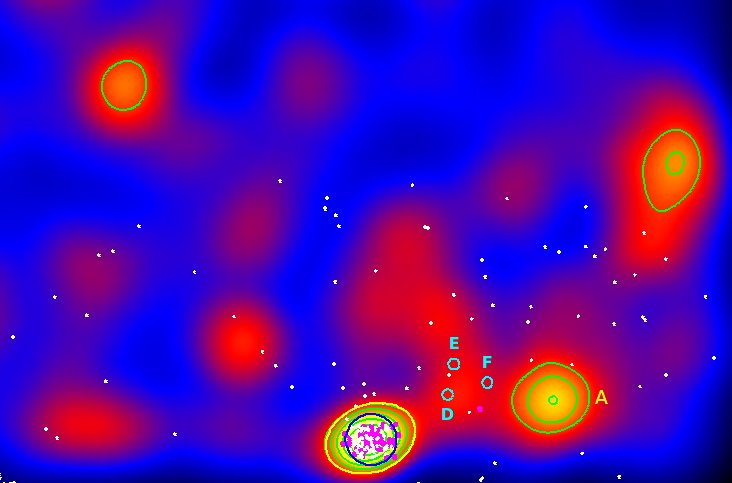
3C 295 shows a maximum extension of 3.6 Mpc. A second structure (labelled A) is detected at a level west of the cluster but has no identification in NED, and this is also the case for the two other structures (B and C) farther away in the field. The redshift was estimated by G14 and is different from the value given by NED.
Three clusters are found close to 3C 295 in NED (the small cyan circles (D, E, and F) in Fig. 22) but are not detected in our density map: W3-0995 of Durret et al. (2011b) at photo-=0.75, CFHT-W CL J141045.3+521737 at photo-=0.6854, and CFHT-W CL J141043.0+522038 at photo-=0.4502. There are 78 spectroscopic redshifts in the range, concentrated in a circle of 1 Mpc radius, but quite spread out in redshift.
3.2.9 RX J1524.6+0957 (z=0.5160)
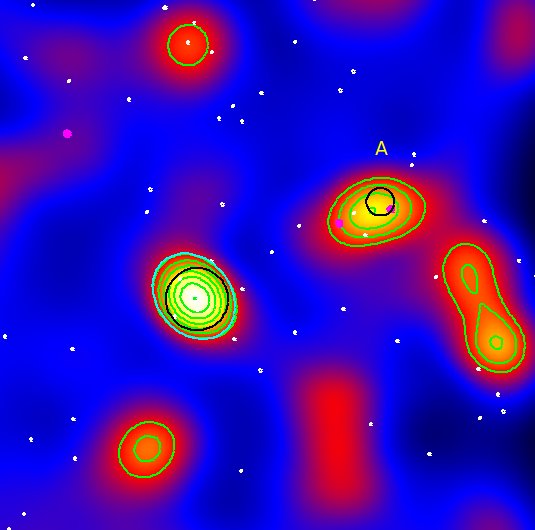
Figure 23 shows a quite massive cluster. A second rather bright structure (labelled A) is detected 17.9 arcmin north-west of RX J1524.6+0957 and can probably be identified with the cluster GMBCG J230.90400+10.10080 at photo, in which case the two clusters could form a pair at a projected distance of about 6.7 Mpc. However, we do not detect matter between these two clusters. Several other structures are detected in the field but have no NED identification, and only three spectroscopic redshifts are available in the range.
3.2.10 OC02 J1701+6412 (z=0.4530)
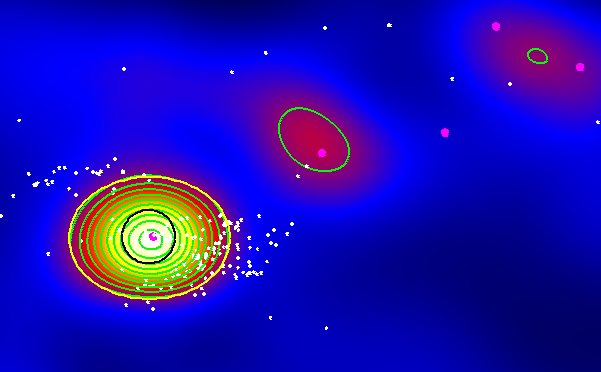
OC02 J1701+6412 is not a very massive cluster ( M⊙ in M15) and shows no obvious substructure in Fig. 24. M15 found a double structure along a roughly north–south direction, but their structure 3 is most probably not at the cluster redshift, since we do not detect it here. Neither do we detect the M15 structure 2, which is expected because it is identified with a lower redshift cluster that we did not expect to detect here. We detect at two small structures farther out to the north-west, but they have no identification in NED and our detections are not significant enough to conclude that OC02 belongs to a supercluster. Only five spectroscopic redshifts are available in the range .
3.2.11 RX J2328.8+1453 (z=0.4970)
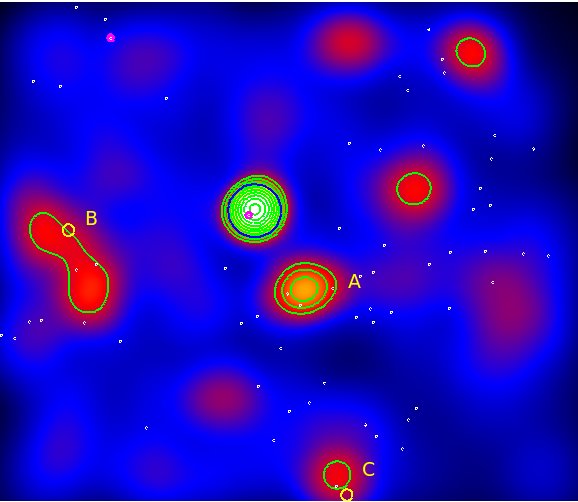
RX J2328.8+1453 appears to be very bright on the density map (Fig. 25) and is a moderately massive cluster ( M⊙ in M15). The structure labelled A corresponds to the Pegasus dwarf galaxy, which is at much lower redshift, but so bright that it still somewhat contaminates the density map. There are two other structures, one (labelled B) 19.4 arcmin east and one (C) 31.0 arcmin south of the cluster that can be identified in NED with the clusters GMBCG J352.53003+14.85291 at and GMBCG J352.04865+14.39520 at respectively. If we consider that RX J2328.8+1453 and GMBCG J352.53003+14.85291 form a pair, their projected distance would be about 7.1 Mpc. Two other weak structures are detected at in the density map, but no filament system is observed. Only two spectroscopic redshifts are available at and 0.49.
3.3 Three clusters without significantly detected neighbouring structures or filaments
The following clusters are clearly detected on the density maps, but show no significantly detected neighbouring structures or filaments.
3.3.1 MACS J0454.1-0300 (z=0.5377)
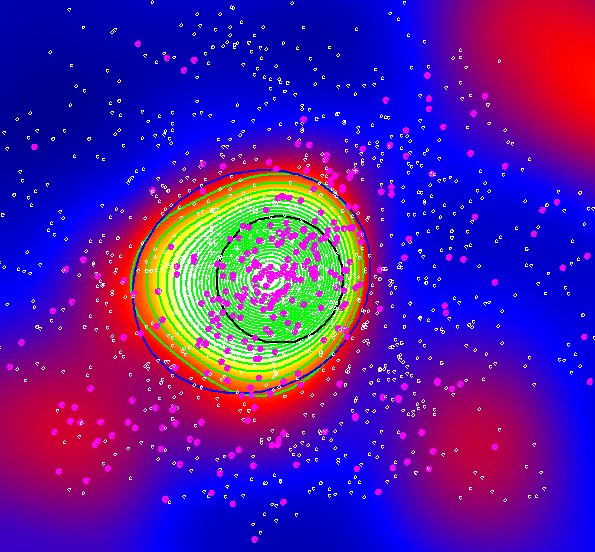
The galaxy density map (Fig. 26) shows no obvious elongation or deformation, although the weak-lensing analysis detects two peaks (M15). However, we can note that the peak of the density map (where the contours reach a maximum) does not coincide with the position of the cluster given by NED, the displacement being about 0.011 deg, corresponding to 0.25 Mpc at the cluster distance. According to the strong-lensing analysis made by Zitrin et al. (2011), MACS J0454.1-0300 is a rather low-mass cluster, with a M500 mass of the order of only M⊙. No other structure is detected in the density map, therefore we only show a zoom on the cluster. There are 343 spectroscopic redshifts in the range.
3.3.2 MS 2053.7-0449 (z=0.5830) and CXOSEXSI J205617.1-044155 (z=0.6002)
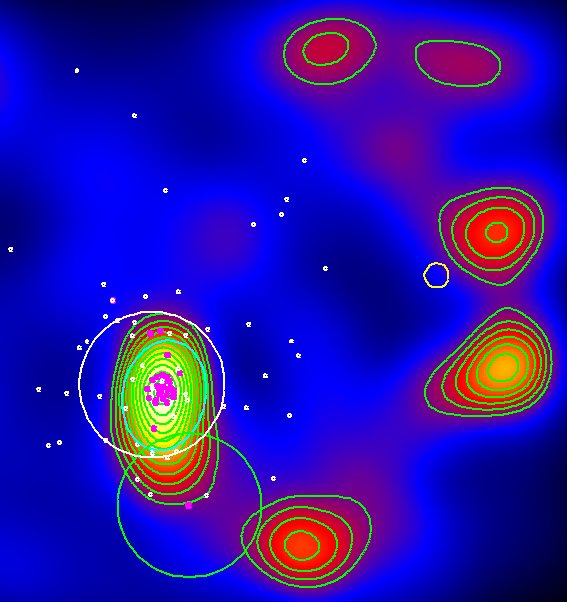
MS 2053.7-0449 is a massive cluster ( M⊙ in M15) detected at the level, but its companion cluster CXOSEXSI J205617.1-044155 is only visible as a faint extension to the south of MS 2053.7-0449 on the density map (see Fig. 27). Several other structures are detected, but the only galaxy cluster with a redshift available in NED is [BGV2006] 078 at z=0.277 (the yellow circle); it is not detected here, as expected in view of its redshift. None of the other structures are found in NED, so we have no unambiguous information on the environment of these two clusters. There are 28 spectroscopic redshifts in the range, mostly concentrated in MS 2053.7-0449.
3.4 Four clusters whose contrast is too low to be detected at on the density maps
Four clusters at redshifts between and are of too low contrast to be clearly visible on our density maps, at least at the positions given by NED. We briefly give a few indications on these clusters below.
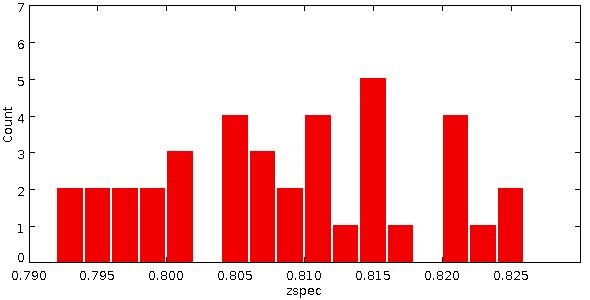
The two clusters SEXCLAS 12 and SEXCLAS 13 do not appear clearly on our density map. Since the exposure times of our and images are 2040 and 10800 seconds, respectively, we ought to detect them if they were at their NED redshifts and had masses higher than M⊙ (the minimum mass of the DAFT/FADA survey clusters, as derived from X-ray ROSAT data). This means that if these clusters are not detected on the density map, it is because they are more distant and/or less massive than expected. We checked if they could be at higher redshifts than the NED values. SEXCLAS 12 and 13 were discovered by Kolokotronis et al. (2006), who estimated their respective photometric redshifts to be and 0.58. Among the spectroscopic redshifts that we gathered from NED, we found two galaxies located very close to the centres of these two clusters and that are probably the BCGs. At 19 arcsec of the centre of SEXCLAS 12 a galaxy is located at RA=163.15542∘and DEC=57.51778∘ with , and at 42 arcsec of the centre of SEXCLAS 13 a galaxy is located at RA=163.21459∘and DEC=57.53361∘, with . Therefore we believe that the correct redshifts of SEXCLAS 12 and SEXCLAS 13 are and respectively. The histogram of the redshifts we were able to gather is quite flat , which makes it impossible to derive dynamical properties for this system. Since these redshifts are not extremely high, the fact that we do not detect SEXCLAS 12 and SEXCLAS 13 on the density map suggests that these are not massive clusters, in agreement with their non-detection by XMM-Newton (see G14, Appendix C.5.) and by their faintness that impeded deriving their galaxy luminosity function (Martinet et al. 2015a). These two clusters should probably not have been included in the DAFT/FADA cluster survey.
The cluster RCS J1620.2+2929 () is not detected on the density map either, probably because the exposure time in the filter is too short (516 s) to detect such a distant object. Only the cluster redshift given by NED is available in the range.
For NEP 200 (z=0.6909), the position given in Table 1 coincides with the BCG, but we detect the cluster on the density map only at the level. This is rather surprising since M15 give a high mass for this cluster, if with a large error bar ( M⊙). As for BMW-HRI J122657.3+333253, we tried to cut the density map and eliminate a very bright feature at the western edge of the image, but this only improves the detection level to . The new redshifts measured with GTC are given in Table 4, and the redshift histogram including these new redshifts and those found in NED is shown in Fig. 35.
We can therefore conclude that clusters with redshifts of the order of or higher will only be detected on density maps such as those that we computed if they are massive (with the obvious condition that the exposure times of the images are sufficient).
4 Discussion and conclusions
The DAFT/FADA survey, started several years ago (principal investigators C. Adami, D. Clowe, and M. Ulmer), comprises a sample of 90 massive clusters (mass higher than M⊙, derived from ROSAT X-ray data) in the medium-high redshift range and with HST data available. For a large part of them, we gathered deep ground-based images in several optical bands and in one infrared band. To analyse the large-scale environment of these clusters, we here selected the thirty clusters for which large field images obtained with CFHT/Megacam or Subaru/SuprimeCam were available (either from our own data or from the archives). We limited our analysis to the clusters with at least two bands obtained with the same instrument except for two clusters, and bracketing whenever possible the 4000 Å break. In this way, our sample included thirty clusters: nineteen with CFHT/Megacam data, nine with Subaru/SuprimeCam data, and two with mixed CFHT/Megacam and Subaru/SuprimeCam data.
For each cluster, we selected galaxies that had a high probability of belonging to the cluster based on colour-magnitude diagrams. The influence of the position of the red sequence in the colour-magnitude diagram and of the width of the galaxies selected on either side of the red sequence were discussed in Sect. 2.3. and are illustrated in Appendix A.
Based on these catalogues of cluster galaxies, we then computed galaxy density maps by applying an adaptive kernel method. This technique is well suited here, since it allows detecting weak structures, but at the same time gives more precise results in the dense zones where the signal is high (i.e. where there are many cluster galaxies). We then estimated for each density map the value of the background and drew contours at and higher above this value. We also computed a mean background for a given telescope and set of filters to minimize the effect of cosmic variance (the background is not exactly the same for all the clusters). In most cases, the clusters are detected at the same significance level as with the local background. However, the background in the density map of [MJM98] 34 is notably lower than for the other clusters, which means that if we compute significance levels above the average value, we no longer detect [MJM98] 34 at . We therefore kept our original analysis (with a local background), but we recall that computing the local background around each cluster can be a source of inhomogeneity among clusters.
We presented and discussed the results individually for each cluster in Sect. 3. We discuss the influence of bright sources on computing the significance levels of the features that we detect in Appendix B. We find clear elongations in twelve clusters out of thirty, with sizes that can reach up to 7.6 Mpc (see Sect. 3.1. and Table 2). The distinction between an elongation and a filament is not obvious. We tried to quantify here the maximum sizes of the detection contours, and in most cases we only detected asymmetries in the cluster shapes. In some cases such as ZwCl 1332.8+5043, there are only three small elongations and the detection contour is almost circular, but we included it among the twelve clusters with elongations because of its size of Mpc2, which is relatively large compared to a typical cluster size.
Of the twelve clusters that are clearly elongated, ten have redshifts , one is at (MACS J0744.9+3927), and only one is really distant (RX J1716.4+6708 at ). Therefore, we see that weak extensions or filamentary structures are easier to detect for relatively nearby clusters than for more distant ones, as expected. The masses of six of these twelve clusters were computed based on the weak-lensing analysis by M15, and they are all in the medium-high to high mass range, between M⊙ and M⊙. The fact that extensions are easier to detect at low redshifts is confirmed by the fact that the clusters whose contrast is too low to be unambiguously detected on our density maps and observed with long exposure times (see Sect. 3.4) are all at relatively high redshifts (in the range ).
Eleven other clusters have neighbouring structures, but the zones linking these structures to the cluster are not detected at the 3 level in the density maps, and three clusters show no extended structure and no neighbours. The characteristics of these fourteen clusters are less clear than those described above, since they span the entire ranges of redshifts and masses of our sample.
We are aware that separating clusters between Sects. 3.1 and 3.2 may be somewhat arbitrary. Since the red sequences are computed with various colours, slightly different galaxy populations are selected depending on the available data, and since different galaxy populations are clustered in different way, our analysis is not fully homogeneous. Unfortunately, we have no cluster for which both Megacam and Subaru data are available in all the bands, so we cannot test how the red sequence changes with all the colour selections. Our classification gives indications on what is detected around the clusters of our sample, however.
The number of redshifts available in the cluster range varies strongly from one cluster to another (between one and several hundred). We detect filaments or extensions in clusters both with many and few available spectroscopic redshifts, which tends to confirm that our selection of cluster galaxies based on colour-magnitude diagrams is reliable. This was also shown to be the case by Kartaltepe et al. (2008). One important consequence of the fact that we did not detect strong filaments (except for MACS J0717+3745) is that the clusters that we analysed between redshifts and have already formed, and even if some of them show evidence that they are undergoing a merger, they are probably in the final stages of their formation process and do no longer accrete a large quantity of matter through filaments.
We can note that most of the clusters that were only weakly detected or even undetected by our method have very few spectroscopic redshifts, which clearly shows that redshifts help to define the cluster red sequence more accurately and thus to obtain a better selection of the cluster galaxies. For the clusters of our sample with several hundred available spectroscopic redshifts in the cluster redshift range, we are beginning a detailed dynamical analysis to determine whether the cluster properties seen on the density maps (such as their relaxed or perturbed aspect) correlate with their dynamical properties. This will also allow a mass estimate independent of that obtained either from X-rays (G14) or weak lensing (M15).
The search for extensions and filaments around clusters is of cosmological importance since they allow tracing the directions along which clusters are still accreting galaxies, groups, or small clusters, and in this way allows better understanding the formation and evolution of clusters. The exact definition of filaments is still under debate, as was discussed for example by Pimbblet (2005). It is obviously linked both to the geometry and to the density of the structures, and detecting more filaments should allow a more accurate definition of what filaments are. With this question in mind, we are in the process of searching for filaments around the thousands of candidate clusters detected in the CFHTLS (Durret et al. 2011b and references therein) and SDSS Stripe 82 (Durret et al. 2015) surveys, with the aim to be able to assemble statistics on filaments around clusters (Sarron et al. in preparation). This large search will be possible once the procedure is made 100% automatic.
Although we did not address this question here, it would be interesting to conduct a total census of the mass contained in filaments, that is, the total baryonic mass, which consists of an intergalactic medium plus galaxies, combined with the non-baryonic cold dark matter mass. Eckert et al. (2015) have recently detected filaments both in the optical and X-rays around the Pandora cluster Abell 2744 and concluded that the properties of these filaments “supported the picture in which a large fraction of the Universe’s baryons are located in the filaments of the cosmic web”. Future satellite missions that will use weak lensing such as EUCLID, W-First, together with a relatively wide field of view and high sensitivity X-ray mission such as Athena, will be able to provide the necessary data to be compared with ongoing CDM-based simulations of the cosmic web (e.g Haider et al, 2015).
Acknowledgements.
We thank the referee for the interesting comments. We are grateful to Emmanuel Bertin for many enlightening discussions. FD acknowledges long-term support from CNES. IM acknowledges financial support from the Spanish Ministry of Economy and Competitiveness through the grant AYA2013-42227P.References
- (1) Adami C., Le Brun V., Biviano A. et al. 2009, A&A 507, 1225
- (2) Applegate D.E., von der Linden A., Kelly P.L. et al. 2014, MNRAS 439, 48
- (3) Bertin E., Arnouts S. 1996, A&AS 117, 393
- (4) Biviano A., Durret F., Gerbal D. et al. 1996, A&A, 311, 95
- (5) Dantas C.C., de Carvalho R.R., Capelato H.V., Mazure A. 1997, ApJ, 485, 447
- (6) De Lucia G., Poggianti B.M., Aragón-Salamanca A. et al. 2007, MNRAS 374, 809
- (7) Dietrich J.P., Werner N., Clowe D. et al. 2012, Nature 487, 202
- (8) Doroshkevich A., Tucker D.L., Allam S., Way M.J. 2004, A&A 418, 7
- (9) Durret F., Lima Neto G.B., Forman W., Churazov E. 2003, A&A 403, L29
- (10) Durret F., Lima Neto G.B., Forman W. 2005, A&A 432, 809
- (11) Durret F., Laganá T., Haider M. 2011a, A&A 529, 38
- (12) Durret F., Adami C., Cappi A. et al. 2011b, A&A 535, 65
- (13) Durret F., Adami C., Bertin E. et al. 2015, A&A 578, 79
- (14) Eckert D., Jauzac M., Shan H.-Y. et al. 2015, Nature 528, 105
- (15) Edwards L.O.V., Fadda D., Frayer D.T., Lima Neto G.B., Durret F. 2010, AJ 140, 1891
- (16) Fukugita M., Shimasaku K., Ichikawa, T. 1995, PASP 107, 945
- (17) Garilli B., Fumana M., Franzetti P, et al., 2010, PASP 122, 827
- (18) Girardi M., Demarco R., Rosati P., Borgani S. 2005, A&A 442, 29
- (19) Gladders M.D., Yee H.K.C., Ellingson E. 2002, AJ 123, 1
- (20) Guennou L., Adami C., Ulmer M.P. et al. 2010, A&A 523, 21
- (21) Guennou L., Adami C., Durret F. et al. 2014, A&A 561, 112 (G14)
- (22) Haider M., Steinhauser D., Vogelsberger M. et al. 2015, arXiv:1508.01525
- (23) Henry J.P., Gioia I.M., Mullis C.R. et al. 1997, AJ 114, 1293
- (24) Higuchi Y., Oguri M., Tanaka M., Sakurai J. 2015, arXiv:1503.06373
- (25) Jauzac M., Jullo E., Kneib J.-P. et al. 2012, MNRAS 426, 3369
- (26) Jones D.H., Read M.A., Saunders W. et al. 2009, MNRAS 399, 683
- (27) Kartaltepe J.S., Ebeling H., Ma C.J., Donovan D. 2008, MNRAS 389, 1240
- (28) Koch E.W. & Rosolowsky E.W. 2015, MNRAS 452, 3435
- (29) Kolokotronis V., Georgakakis A., Basilakos S. et al. 2006, MNRAS 366, 163
- (30) Laganá T.F., Dupke R. A., Sodré Jr. L., Lima Neto G. B., Durret F. 2009, MNRAS 394, 357
- (31) de Lapparent V., Geller M.J., Huchra J.P. 1986, ApJ 302, L1
- (32) Le Fèvre O., Vettolani G., Garilli B. et al. 2005, A&A 439, 845
- (33) Mann A.W. & Ebeling H. 2012, MNRAS 420, 2120
- (34) Martinet N., Durret F., Guennou L. et al. 2015a, A&A 575, 116
- (35) Martinet N., Clowe D., Durret F. et al. 2015b, A&A in revision (M15)
- (36) Mazure A., Adami C., Pierre M. et al. 2007, A&A 467, 49
- (37) McHardy I.M., Jones L.R., Merrifield M.R. et al. 1998, MNRAS 295, 641
- (38) Medezinski E., Umetsu K., Nonino M. et al. 2013, ApJ 777, 43
- (39) Mehrtens N., Romer A.K., Hilton M. et al. 2012, MNRAS 423, 1024
- (40) Pimbblet K.A. 2005, PASA 22, 136
- (41) Postman M., Lubin L.M., Gunn J.E. et al. 1996, AJ 111, 615
- (42) Press W.H. & Schechter P. 1974, ApJ 187, 425
- (43) Schlegel D.J., Finkbeiner D.P., Davis M., 1998, ApJ 500, 525
- (44) Serna A. & Gerbal D. 1996, A&A 309, 65
- (45) Shivashankar N., Pranav P., Natarajan V. et al. 2015, arXiv:1508, 00737
- (46) Silverman, B. W. 1986, ”Density Estimation for Statistics and Data Analysis” (London : Chapman & Hall)
- (47) Stoica R.S., Gregory P., Mateu J. 2005, Stoch. Process. Appl. 115, 1860
- (48) Tempel E., Stoica R.S., Martínez V.J. et al. 2014a, MNRAS 438, 3465
- (49) Tempel E., Kipper R., Saar E. et al. 2014b, A&A 572, 8
- (50) Tempel E., Guo Q., Kipper R., Liebeskind N.I. 2015, MNRAS 450, 2727
- (51) Tempel E. & Tamm A. 2015, A&A 576, L5
- (52) Teyssier R., Pires S., Prunet S. et al. 2009, A&A 497, 335
- (53) Zitrin A., Broadhurst T., Barkana R. et al. 2011, MNRAS 410, 1939
Appendix A Testing the chosen parameters of the red sequence that were used to build density maps
We illustrate here the influence that the selection of the galaxies along the red sequence has on the density maps. Figure 28 shows the influence of the height of the red sequence, and Fig. 29 shows how the density maps change if the width around the red sequence is modified. Details are given in Sect. 2.3.
Appendix B Testing the determination of the cluster detection levels
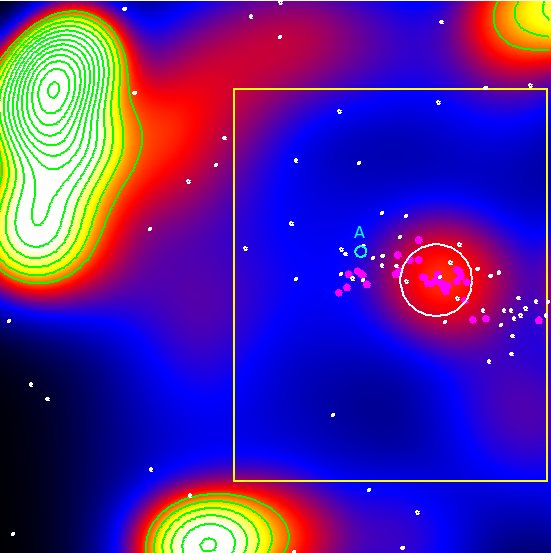
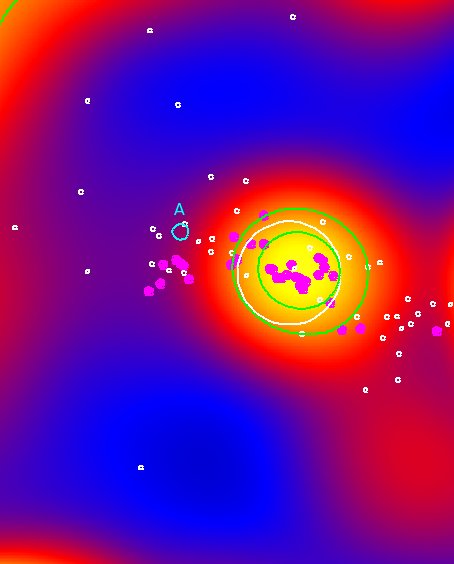
We illustrate here the influence of bright structures on the determination of the background level of the density maps that has important consequences on the significance levels of the detections, based on the extreme example of BMW-HRI J122657.3+333253. See Sect. 2.4 for details.
Appendix C New spectroscopic redshifts obtained with the GTC and various redshift histograms
| Running | RA | DEC | z | flag | band |
|---|---|---|---|---|---|
| number | (J2000.0) | (J2000.0) | magnitude | ||
| 1 | 203.54648 | 50.54227 | 0.2972 | 3 | 20.455 |
| 2 | 203.56148 | 50.55794 | 0.5505 | 3 | 21.135 |
| 3 | 203.56590 | 50.46159 | 0.4047 | 2 | 21.261 |
| 4 | 203.57019 | 50.56184 | 0.2964 | 3 | 22.256 |
| 5 | 203.57242 | 50.53869 | 0.6155 | 3 | 22.302 |
| 6 | 203.57759 | 50.55912 | 0.6316 | 3 | 21.407 |
| 7 | 203.57977 | 50.43289 | 0.3317 | 2 | 21.375 |
| 8 | 203.58572 | 50.51764 | 0.5854 | 9 | 20.470 |
| 9 | 203.58656 | 50.43459 | 0.2673 | 2 | 22.384 |
| 10 | 203.58722 | 50.52655 | 0.6277 | 4 | 21.594 |
| 11 | 203.59153 | 50.51581 | 0.6097 | 3 | 21.878 |
| 12 | 203.59155 | 50.51013 | 0.1486 | 9 | 20.067 |
| 13 | 203.59267 | 50.50076 | 0.2690 | 2 | 21.384 |
| 14 | 203.59357 | 50.51333 | 0.6100 | 4 | 20.749 |
| 15 | 203.59570 | 50.50032 | 0.2617 | 2 | 20.315 |
| 16 | 203.60213 | 50.53054 | 0.6208 | 3 | 22.258 |
| 17 | 203.60523 | 50.50613 | 0.4438 | 2 | 19.105 |
| 18 | 203.61669 | 50.50579 | 0.6162 | 4 | 21.184 |
| 19 | 203.61814 | 50.47468 | 0.2623 | 3 | 19.115 |
| 20 | 203.62027 | 50.55429 | 0.2770 | 3 | 19.227 |
| 21 | 203.62365 | 50.48701 | 0.4425 | 3 | 20.830 |
| 22 | 203.62508 | 50.45514 | 0.0831 | 2 | 15.874 |
| 23 | 203.62663 | 50.44983 | 0.0842 | 2 | 17.348 |
| 24 | 203.62823 | 50.47422 | 0.2662 | 4 | 20.156 |
| 25 | 203.63465 | 50.47806 | 0.0838 | 3 | 20.040 |
| 26 | 203.63623 | 50.46817 | 0.0882 | 2 | 19.239 |
| 27 | 203.63952 | 50.46948 | 0.0844 | 3 | 20.192 |
| 28 | 203.64069 | 50.48123 | 0.2661 | 2 | 19.640 |
| 29 | 203.65446 | 50.48689 | 0.0845 | 3 | 17.292 |
| 30 | 203.65843 | 50.52982 | 0.3342 | 3 | 21.391 |
| Running | RA | DEC | z | flag | band |
|---|---|---|---|---|---|
| number | (J2000.0) | (J2000.0) | magnitude | ||
| 1 | 269.26295 | 66.49133 | 0.0000 | 4 | 20.46 |
| 2 | 269.26708 | 66.47758 | 0.6105 | 2 | 20.87 |
| 3 | 269.27117 | 66.54886 | 0.4156 | 3 | 21.28 |
| 4 | 269.27431 | 66.52642 | 0.1749 | 4 | 23.50 |
| 5 | 269.27518 | 66.55717 | 0.0000 | 2 | 21.48 |
| 6 | 269.30138 | 66.46396 | 0.2624 | 3 | 18.10 |
| 7 | 269.30734 | 66.48506 | 0.0000 | 2 | 18.86 |
| 8 | 269.30746 | 66.45269 | 0.7771 | 9 | 21.98 |
| 9 | 269.31076 | 66.46900 | 0.5625 | 2 | 21.38 |
| 10 | 269.31186 | 66.49042 | 0.6110 | 2 | 21.35 |
| 11 | 269.31965 | 66.44800 | 0.2597 | 2 | 19.99 |
| 12 | 269.32835 | 66.52599 | 0.5434 | 3 | 21.17 |
| 13 | 269.33149 | 66.52576 | 0.6936 | 4 | 19.97 |
| 14 | 269.33663 | 66.51119 | 0.4632 | 4 | 21.84 |
| 15 | 269.34054 | 66.48596 | 0.5916 | 2 | 21.04 |
| 16 | 269.34938 | 66.57275 | 0.0560 | 4 | 18.47 |
| 17 | 269.35608 | 66.54448 | 0.6938 | 2 | 20.80 |
| 18 | 269.35675 | 66.49611 | 0.4240 | 2 | 20.72 |
| 19 | 269.35737 | 66.51684 | 0.0000 | 3 | 21.62 |
| 20 | 269.37533 | 66.50135 | 0.3077 | 4 | 20.12 |
| 21 | 269.38035 | 66.56889 | 0.6102 | 2 | 21.33 |
| 22 | 269.38913 | 66.57149 | 0.7490 | 2 | 21.74 |
| 23 | 269.39112 | 66.51077 | 0.0000 | 4 | 21.32 |
| 24 | 269.41683 | 66.54119 | 0.0000 | 4 | 20.82 |
A number of spectroscopic redshifts were obtained through multi-slit spectroscopic data obtained with OSIRIS/MOS on the Gran Telescopio Canarias (GTC) on May 22, 2014, for the clusters ZwCl 1332.8+5043 and NEP 200. Images previously obtained with OSIRIS/GTC in the imaging mode were used to make the masks. Two masks were made for each cluster, allowing slit spectroscopy of about 25 objects per mask. The grism R300R was used, which provides a dispersion of 7.74 Å/pixel in the wavelength range from 4800 to 10000 Å. A total of 3000 seconds were exposed for each mask. Arc-lamp exposures were taken for wavelength calibration. The seeing FWHM was measured in the acquisition images and reached from 0.9 to 1.2 arcsec. The observing conditions were mostly photometric. The standard star GD153 was observed for flux calibration.
For the data reduction we applied the IRAF-based GTCMOS pipeline (http://www.inaoep.mx/ ydm/gtcmos/gtcmos.html). We applied the usual steps for bias subtraction and illumination correction, wavelength calibration with a combination of Xe, Ne and HgAr lamp exposures, sky subtraction, and 1D spectrum extraction.
The spectroscopic redshifts were measured by cross-correlating them with templates with the EZ code (Garilli et al. 2010). A flag between 1 (worst) and 4 (best) was given to each measurement. Flag 1 means that we have a 50 chance to have the correct redshift estimate, flag 2 indicates a 75 chance, flag 3 a chance of 95, and flag 4 a chance higher than 99. Redshift measurements with flag=1 were discarded.
We list in Tables 3 and 4 the values of the new redshifts measured with GTC, together with the band magnitudes measured in our Megacam images.
We show below the galaxy spectroscopic redshift histograms zoomed on the cluster redshift range for these two clusters, as well as for three other clusters for which redshift histograms were not previously given in our data paper (G14). These histograms include all the NED data and also the GTC data for Zw 1332 and NEP 200.
