Dilute magnetism and vibrational entropy in Fe2Al5
Abstract
Fe2Al5 contains a Fe-Al matrix through which are threaded disordered one-dimensional chains of overlapping Al sites. We report magnetic, NMR, and specific heat measurements addressing its magnetic and vibrational properties. The Curie-type susceptibility is found to be due to dilute moments, likely due to wrong-site Fe atoms. 27Al NMR shift and spin-lattice relaxation measurements confirm these to be indirectly coupled through an RKKY-type interaction. Specific heat results indicate a large density of low-energy vibrational modes. These excitations generate a linear- contribution to the specific heat, which however freezes out below about 10 K. These results are attributed to the presence of anharmonic vibrational modes associated with the disordered structural chains.
I INTRODUCTION
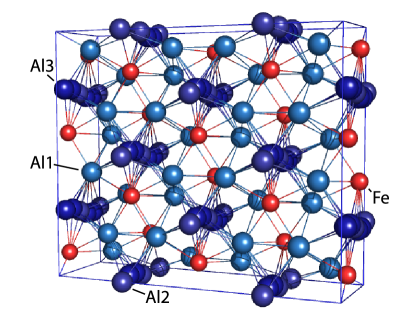
Al-rich Fe aluminides, along with other transition metal aluminides, form complex atomic structures, for example the triclinic structure of FeAl2,Corby and Black (1973) and monoclinic structure of Fe4Al13, the latter a decagonal quasicrystal approximant.Grin et al. (1994) In addition such compounds show a variety of magnetic behavior, from non-magnetic ordered FeAl and dilute-Fe alloys, Guenzburger and Ellis (1991); Gonzales et al. (1998); Watson and Weinert (1998) to concentrated-moment behavior in FeAl2.Lue et al. (2001); Chi et al. (2005) Fe2Al5 is a quasicrystal approximant with pentagonal channels (Fig. 1), through which are threaded one-dimensional arrays of partially-occupied aluminum sites spaced very closely and exhibiting anomalous vibrational properties.Burkhardt et al. (1994) In this paper we explore the magnetic and thermodynamic behavior of this material, showing that it is an intrinsic dilute magnetic material with an anomalous contribution to the entropy at low temperatures.
In some ways, these transition-metal aluminides may be viewed as dilute alloys of -rank ions in a metallic aluminum matrix. However, the complex structures also include regularly-spaced vacancies and partially-occupied sites, stabilized in part by a combination of strong - hybridization and the Hume-Rothery mechanism.de Laissardière et al. (2005) In many cases this leads to the appearance of a pseudogap in the density of electronic states at the Fermi level [], and associated unusual electronic behavior. Furthermore, it is believed that the structures of quasicrystals and approximants may lead to particularly narrow structures in the DOS near ,Fujiwara and Yokokawa (1991); Delahaye et al. (2003); Widmer et al. (2009) which can dominate the electronic behavior. The possible presence of phason-type coherent vibrational excitationsCoddens (2006); Widom (2008) is also of interest, and there is experimental evidence for an enhanced density of vibrational modes in this class of materials.Abe et al. (2003); Brand et al. (2009) Fe2Al5 also includes closely-spaced Al sites in the channels, and hopping between these sites may have a large effect on the vibrational behavior.
The orthorhombic structureBurkhardt et al. (1994) (Cmcm, s.g. #63) of Fe2Al5 is shown in Fig. 1. Its framework includes channels in the form of stacked pentagonal antiprisms. The single inequivalent Fe site (4/cell) has two somewhat distant (3.06 Å) Fe near neighbors, as well as eight Al(1) neighbors and a series of neighboring channel-centered Al sites. Al(1) sites (8/cell) are fully occupied, while the overlapping sites Al(2) (4/cell) and Al(3) (8/cell) channel sites make up disordered chains, with site occupation factors 0.36 and 0.23, respectively, found in the study of Burkhardt et al.Burkhardt et al. (1994) These occupation factors gives a nominal composition of Fe4Al10. Reported composition rangesChen et al. (1990); Köster et al. (2001) include variations as large as Fe4Al9 to Fe4Al11, presumably through adjustment of Al(2) and Al(3) occupations. The close spacing (0.67 and 0.75 Å) of partially-occupied channel sites and highly anisotropic thermal parameters deduced from crystallographic measurements also point to atomic hopping between sites along the chains. A sizable Curie-type susceptibility was previously reported for Fe2Al5,Müller et al. (1991) with = 0.73. Here we report magnetization, specific heat and nuclear magnetic resonance (NMR) studies addressing the magnetic and vibrational properties of this material.
II EXPERIMENTAL METHODS
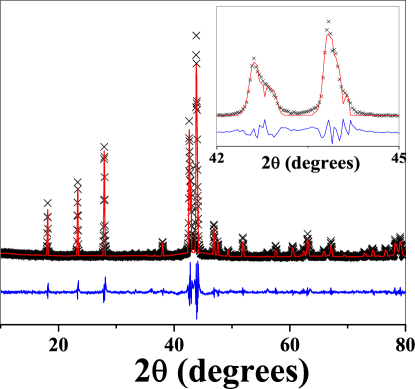
Samples were synthesized by arc melting appropriate amounts of the elemental metals. The resulting polycrystalline ingots were annealed in vacuum-sealed quartz tubes at 600∘ C for one week. Samples were characterized by powder x-ray diffraction (Bruker D8 Advance) using Cu radiation, and also by wavelength dispersive x-ray spectrometry (WDS) using a Cameca SX50 equipped with four wavelength-dispersive x-ray spectrometers. Structural refinement of x-ray data was carried out using the GSAS software package.Toby (2001); Larson and von Dreele (2000)
We prepared samples with several starting compositions, including Fe4Al10, Fe4Al11.2 and Fe4Al11.8. WDS measurements showed 2 phases, FeAl2 and Fe2Al5, in the samples with Fe4Al10 and Fe4Al11.2 starting compositions. However, for the starting composition Fe4Al11.8 no second phase was found. Also in the NMR measurements to be described below, a separate peak due to the concentrated magnetic phaseChi et al. (2005) FeAl2 was obtained for the Fe4Al10 and Fe4Al11.2 samples, while a single peak was found in Fe4Al11.8. WDS showed the final composition of the Fe4Al11.8 sample to be Fe4Al9.8 after loss of Al. X-ray diffraction results for this sample are shown in Fig. 2. Atomic parameters obtained from the refinement are in reasonable agreement with those reported earlier.Burkhardt et al. (1994) Unless otherwise noted, results reported here are for this sample. Where necessary, samples are designated according to the aluminum starting composition, for example sample Al11.8.
Specific heat measurements were performed using a Quantum Design Physical Property Measurement System from room temperature to 1.8 K. DC-susceptibility measurements were carried out using a Quantum Design MPMS SQUID magnetometer. 27Al NMR experiments were performed from 4.2 K to 450 K at two fixed fields using a wide-line pulse spectrometer. For these measurements the powdered sample was mixed with granular quartz, and aqueous AlCl3 was used as shift reference except as noted. MAS-NMR measurements were also performed at room temperature using an Advance 400 spectrometer.
III RESULTS AND ANALYSIS
III.1 Magnetic measurements
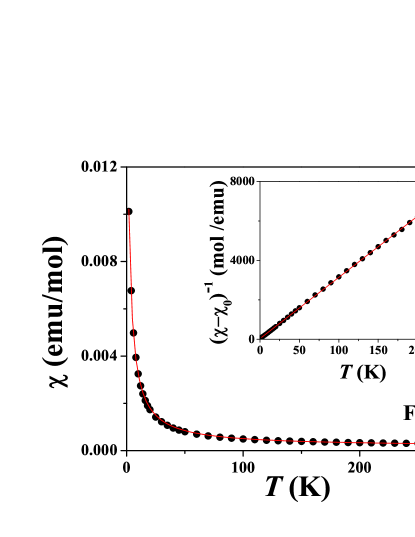
The dc-susceptibility, , is shown in Fig. 3, for fixed field of 1000 Oe. We fit the data to a Curie-Weiss function according to the standard relationship, , with = + 1.7 emu/mol a small extrinsic contribution. The Curie constant is
| (1) |
where is Avogadro’s number, the concentration of magnetic ions per iron atom, and the effective moment. From least-squares fits we obtained = 1.1 K, and = 0.51, somewhat smaller than the previous report,Müller et al. (1991) the difference likely due to sample-dependent variations in atomic occupation parameters.
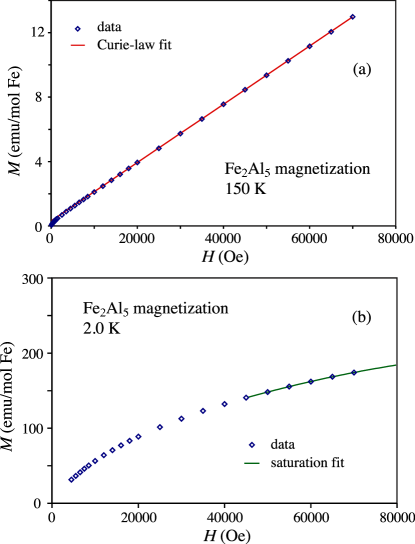
Magnetization measurements vs. field at 150 K show linear behavior [Fig. 4(a)]. The small vertical offset corresponds to the extrinsic contribution described previously. The straight-line fit shown in Fig. 4(a) yields = 0.47. At 2.0 K [Fig. 4(b)] the magnetization is nonlinear, but with incomplete saturation at the highest field of 70 kOe. This curve could not be fitted to a Brillouin function representing the magnetizing behavior of independent local moments, presumably due to spin interactions corresponding to the small fitted obtained from the susceptibility. However, the saturation could be fitted to a functionChikazumi and Graham (1997) [solid curve in Fig. 4(b)], yielding = 281 emu/mol Fe. Since for local moments while the saturation moment corresponds per ion, and can be determined separately from the curves, with known. Assuming that = 2 (a reasonable assumption for transition ions), this procedure yields = 1.2 (hence = 3.2), and = 0.021 per Fe atom.
III.2 NMR measurements
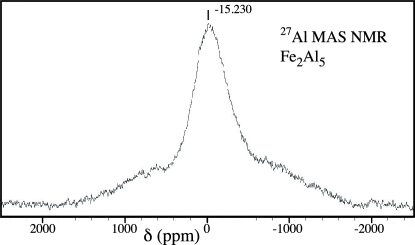
The 27Al NMR spectrum at room temperature has a two-peaked structure [Fig. 5(a)], while at lower temperatures the linewidth becomes progressively larger due to the presence of paramagnetic moments [Fig. 5(b)]. The pulse-length behaviorKanert and Mehring (1971) confirms the central portions of these lines to be central transitions for 27Al ( = 5/2) connecting 1/2 +1/2 states. A room-temperature MAS-NMR spectrum is shown in Fig. 6. The observation of a single peak in this graph indicates that the structure in the static line is dominated by orientation dependence of a single site, rather than a splitting due to inequivalent sites, even though the random paramagnetic contribution is too large to be effectively narrowed by spinning in this case. Since 8 of the nominal 10 Al atoms per cell belong to Al(1), we can deduce that the main features of the line correspond this site, with resonances due to the other sites either overlapping this line or excessively broadened due to channel disorder.
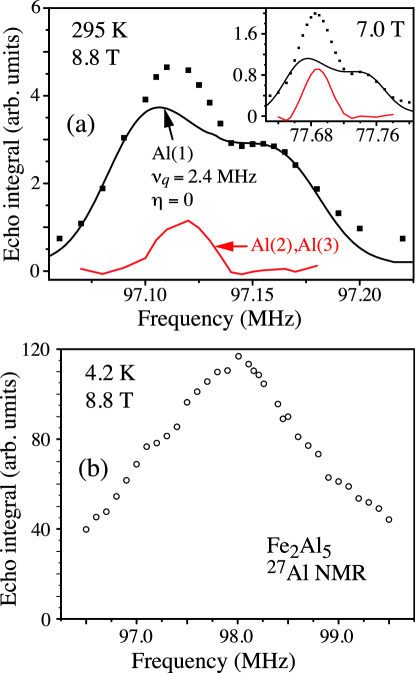
The field-dependence enables magnetic and quadrupole contributions to be separated,Stauss (1964); Carter et al. (1977) since the magnetic shift is proportional to and the second-order quadrupole shift () is proportional to . Fitting the 295 K spectral center of mass obtained at fixed fields of 7.00 and 8.75 T, we extracted a mean magnetic shift, = +0.020(1)%, and a corresponding mean quadrupole contribution = 0.085 MHz T. The latter corresponds to the shift for a second-order powder pattern having quadrupole parametersStauss (1964) = 1.9 MHz and = 0 (or as small as 1.6 MHz with increased to 1). However, in numerical calculations starting with these values we found that the main features of the spectra could be fitted consistently vs. field only by using a larger , with 0 and = +0.025%. Fig. 5(a) shows the superposition of such a single-site quadrupole spectrum with = 2.39 MHz for two different fields. The results are relatively insensitive to the parameter , however we found that computed curves for 0.3 agreed poorly with the data. With this plot superposed, we find in addition a second peak, as shown from the difference curves plotted in Fig. 5(a). This additional peak makes up 12–22% of the total spectral weight. The difference in magnitude may be an artifact of the fitting. According to the measured site occupations, 20% the Al reside on the two channel sites, so it is reasonable to conclude that the additional peak corresponds to these sites, while the fitted = 2.39 MHz resonance is attributed to Al(1).
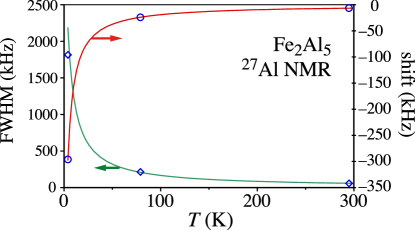
The low-temperature behavior of the NMR lines was measured in 8.8 T at 79 K and 4.2 K; the extracted shifts and linewidths are plotted in Fig. 7. Widths are full widths at half maximum (FWHM) obtained through line fitting, with the quadrupole contribution removed, and shifts are those of the spectral centers of mass. These data could be fit to Curie-Weiss functions, as plotted in the figure. The fitted Weiss temperatures are 3.8 and 2.6 K, respectively, comparable to the small obtained from the susceptibility. Therefore the local fields at these temperatures are dominated by these paramagnetic moments. The nonzero average shift indicates RKKY-type rather than simple dipolar nuclear coupling to the dilute paramagnetic moments, since the dipolar coupling has zero spatial average.
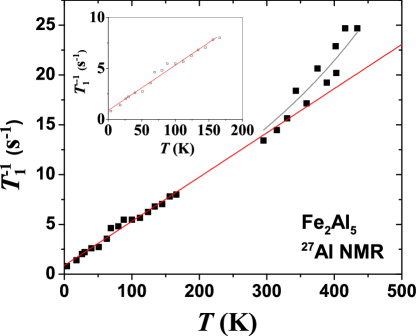
27Al NMR spin-lattice relaxation times (’s) were measured using the inversion recovery method, recording the signal strength by integrating the spin echo FFT. For the central transitions, the ’s were extracted by fitting to multiexponential curves Narath (1967) for magnetic relaxation of the = 5/2 27Al central line. In Fig. 8 we show the temperature dependence between 4 and 450 K. These data were measured in 8.8 T; measurements at selected temperatures also indicated no field-dependence to the . The straight line in Fig. 8 represents a fit to the data below 200 K of the form
| (2) |
with = 4.44 10-2 K-1s-1, and = 0.87 s-1. The first term in Eq. 2 follows the expected Korringa behavior for metals. Subtracting the small negative Curie-type shift (obtained from the fit shown in Fig. 7, and amounting to 0.007% at room temperature) from for the main Al(1) site as described above, we obtain a baseline room-temperature metallic shift, = 0.032%. Multiplying by the fitted slope from Eq. 2 yields the Korringa productCarter et al. (1977) sK. Compared to the standard 27Al Korringa value, sK, the smaller value obtained here likely indicates the presence of a negative cross-polarization term, and contributions to that will tend to reduce , and thereby the Korringa product.
The additive term in Eq. 2 can result from the presence of paramagnetic moments interacting through a constant RKKY-type coupling field. We can estimate such a contribution by calculating the nuclear transfer hyperfine coupling as follows: the fitted paramagnetic contribution to the shift in Fig. 7 at 79 K is 24 kHz, which corresponds to a 22 G effective field for 27Al. Also at this temperature the paramagnetic response will be linear; the parameters used for Fig. 4(a) yield = 0.27 per paramagnetic ion at this temperature and field, so the transfer field is 81 G/, where is the effective coordination number for paramagnetic ions interacting with each nuclear spin. Dividing by the nuclear gyromagnetic ratio we obtain the transfer coupling parameter, = 89 kHz/. The contribution of the paramagnetic moments with spin to the can be expressedNarath (1967)
| (3) |
In this case is the average RKKY exchange frequency, which may be expressed, , where is the interaction strength. In the paramagnetic regime Ashcroft and Mermin (1976), is related to the Curie temperature through . Combining, and using the fitted = 1.1 K and = 1.2, we obtain = 2.1 s. Assuming the dilute moments to be randomly positioned, the value for is unclear, however it should be a small number on order of unity. Thus this estimate is in quite good agreement with the fitted = 0.87 s-1, providing additional evidence supporting the picture of a nonmagnetic matrix containing weakly coupled dilute moments.
Above 300 K, there is an increase in beyond the linear Korringa fit. Similar behavior has been observed in a number of quasicrystaline alloysDolinšek et al. (2001); Jeglič and Dolinšek (2005), and attributed in some cases to a pseudogap near the Fermi energy, whereby an increase in temperature leads to an increase in the number of carriers available for Korringa relaxation. However we see no evidence for a corresponding increase in the Knight shift. While we have not mapped out the detailed field-dependence of the lineshapes above 295 K, we measured lineshapes at 7.0 T at several temperatures up to 403 K. We found no change in the center-of-mass central line position between 295 and 403 K within experimental error. Thus a more likely explanation for the increase in is vibrational. Indeed, there are a number of reports of enhanced density of localized vibrational modes at high temperatures in quasicrystals as well as in quasicrystal approximants,Dolinšek et al. (2002); Widom (2008); Brand et al. (2009) and in glassy systems,Szeftel and Alloul (1975); Mammadov et al. (2010) due to thermal excitation of localized vibrational modes. For comparison, the 27Al contribution (quadratic at high temperatures) due to ordinary phonons in AlSb is roughly 10 times smaller.Mieher (1962)
III.3 Specific heat
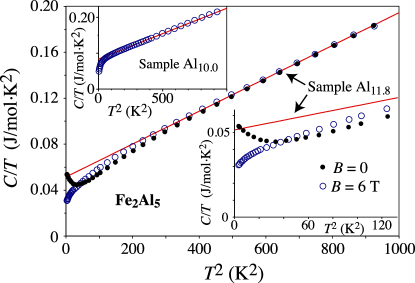
The specific heat () was measured in the temperature range 1.8–300 K. vs. plots below 30 K are shown in Fig. 9, for the Al11.8 and the Al10.0 sample, the latter including a small FeAl2 minority phase. In both cases the straight-line behavior is equivalent to that of typical metals, however with a downturn at low temperatures. A fit to for Al11.8 yielded = 48 mJ/mol K2 and = 0.147 mJ/mol K4 with zero applied field (solid line in Fig. 9). Data with 6 T applied field are also shown; a similar fit yields = 52 mJ/mol K2 and = 0.143 mJ/mol K4. For sample Al10.0 the results are = 83 mJ/mol K2 and = 0.141 mJ/mol K4 (shown in inset plot). The essentially identical values correspond to a Debye temperature = 460 K, however in both cases the fitted is quite large for a nonmagnetic metal. The low-temperature downturn is anomalous, and appears in both samples. Henceforth, we will focus on sample Al11.8, on which the previously-described magnetic and NMR measurements were also performed.
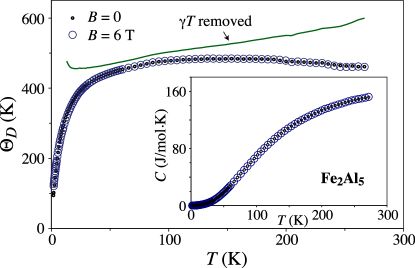
The inset in Fig. 10 shows the specific heat for the entire temperature range. On this scale the 6 T and 0 T data appear superposed. One can solve for the Debye temperature by solving the standard integral equation, , with as a parameter.Cezairliyan (1988) Assuming to be entirely vibrational, we obtain the lower curves displayed in the main plot of Fig. 10. The large drop in below 50 K signals the presence of additional low-energy excitations in this temperature range, which can be associated with the large -linear term fitted as . Subtracting this term from the measured specific heat before solving for yields the upper curve in Fig. 10, which brings back into agreement with the value, 460 K, corresponding to the measured . However, the continued rise of this curve as room temperature is approached is unphysical and indicates that the large contribution does not extend to high temperatures as would the electronic contribution in an ordinary metal. Instead, these additional excitations are apparently confined to a plateau in .
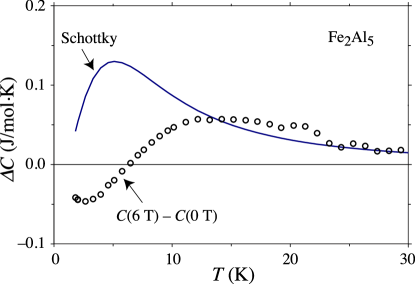
The small low temperature difference between specific heat curves for 6 T and 0 T is consistent with a Schottky anomaly for paramagnetic spins. The difference between the two measurements is plotted in Fig. 11, allowing other contributions to be removed in a model-independent way. Also plotted is a multilevel Schottky curveCezairliyan (1988) for = 6 T corresponding to paramagnetic defects with = 2 and = 0.021 as obtained from the magnetic measurements, and using = 3/2 to approximate the fitted = 1.19. Above 10 K where the = 0 contribution has apparently died out, the magnitudes are in agreement. The negative peak near 2 K corresponds to the zero-field upturn in at low , and is consistent with spin freezing due to a distribution of local fields. The contribution of the measured dilute moments to the specific heat is described entirely by these low-temperature effects, and thus the low-energy excitations corresponding to the plateau in must be attributed to nonmagnetic features.
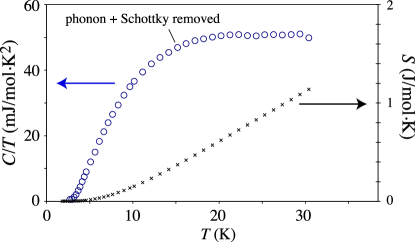
With both the fitted and Schottky terms removed, the remaining low-temperature contribution is plotted in Fig. 12. In typical metals this would yield a constant equal to the electronic , however in this case the curve trends toward zero as approaches zero. The Schottky term is likely overestimated, as = 3/2 was used as an approximation for the fitted = 1.2. Thus the remaining metallic is likely nonzero, but it is clearly significantly smaller than the apparent of the plateau above 20 K. The integrated entropy [] is also shown, obtained from the reduced . This curve is still rising at 30 K (above which temperature additional terms in the ordinary phonon expansion must be included), however the change in over these temperatures provides an estimate of the magnitude of the excess vibrational contribution.
IV DISCUSSION
From the NMR and magnetic measurements it is clear that this is an ordinary metal containing relatively dilute paramagnetic defects. The size of these moments is comparable in size to that found for thermally-generated Fe antisite defectsLue et al. (1999) in Fe2VAl. In the present case a likely scenario may be that Fe atoms randomly substituting on chain sites Burkhardt et al. (1994) may be magnetic due to the more closely connected Fe neighbors of these sites. It is also possible that built-in chain-site disorder induces moments on a small fraction of the otherwise nonmagnetic Fe sites; generally for dilute Al-Fe alloys the presence of a local moment is a sensitive function of the coordinating atom positions.Gonzales et al. (1998); Mantina et al. (2009) Furthermore, as has been proposed for Mn-aluminide quasicrystalsde Laissardière et al. (2005) complex overlapping RKKY interactions in these aluminides can reinforce dilute magnetic moments on certain sites within the otherwise nonmagnetic material.
, the baseline metallic shift as extracted here for the metallic matrix, is about 20% of the value for Al metal. This is likely associated with a broad minimum in the Al partial near as is typical of hybridization gap systems.Watson and Weinert (1998) However we found no evidence for a temperature dependence to , as has been found in some systemsLue and Ross (1998); Tang et al. (1997) for which narrow pseudogap features dominate near . Thus from this standpoint Fe2Al5 behaves as an ordinary metal. Additional excitations identified in this material take the form of localized modes excited at high temperatures, evidenced by an enhancement in , and low-energy features that dominate the specific heat, shown to be nonmagnetic in origin.
Low-energy Einstein oscillator-type vibrational modes have been observed previously in metallic systems,Caplin et al. (1973); Zhou et al. (2006) however the low-temperature specific heat observed here is not consistent with a single oscillator with a well-defined frequency. On the other hand the alternative explanation of a narrow electronic pseudogap, which could produce the low-temperature reduction in specific heat as observed here, seems unlikely since an extremely narrow gap would be required. In addition the observed field-independence would rule out magnetic Kondo behavior as a source of such a feature. Thus we conclude that the enhanced low-energy excitations are due to an extended spectrum of localized anharmonic vibrations. We attribute these to atomic motion along the unusual partially-occupied chains found in this material.
An enhanced specific heat nearly linear in the temperature is observed in insulating glassesPhillips (1987) as well as orientational glasses,Talón et al. (2002) and these are modeled as localized atomic hopping sites producing a broad spectrum of two-level systems. For this model to work in the present case, a low-energy cutoff must be present in the excitation spectrum, with an energy close to 1 meV corresponding to the observed loss of excitation strength near 10 K. This cutoff could plausibly be attributed to the energy required for hopping between neighboring partially-occupied chain sites. The large linear coefficient of specific heat in both measured samples implies a high density of these vibrational modes. For example the integrated entropy shown in Fig. 8 reaches 0.14 at 30 K; if attributed to two-level localized anharmonic states this implies approximately 0.14/ln2 = 0.2 such modes per formula unit becoming activated below 30 K, or a significant fraction of the chain sites, assuming that each localized vibrational state corresponds to a single chain atom. We assume that the breadth of the vibrational spectrum is be due to the disordered arrangement on these sites.
V CONCLUSIONS
Magnetic measurements of Fe2Al5 show it to be a nonmagnetic metal with a large density of paramagnetic moments, likely connected to wrong-site Fe atoms on the disordered chains. 27Al NMR results confirm that these are indirectly coupled through an RKKY-type interaction via the nonmagnetic matrix. We identified Korringa behavior in NMR shifts and relaxation rates; an additional contribution to the latter was identified as due to localized vibrational excitations. Specific heat measurements and analysis demonstrate in addition a large density of low-energy modes contributing to a significant linear- enhancement in the specific heat. An anomalous freeze-out of these modes is observed at low temperatures. We showed these to be nonmagnetic, and likely attributable to atomic motion on the partially-occupied chains threading the structure of this material.
Acknowledgements.
This work was supported by the Robert A. Welch Foundation, Grant No. A-1526, by the National Science Foundation (DMR-0315476), and by Texas A&M University through the Telecommunications and Informatics Task Force.References
- Corby and Black (1973) R. N. Corby and P. J. Black, Acta Crystallogr., Sect B: Struct. Crystallogr. Cryst. Chem. 29, 2669 (1973).
- Grin et al. (1994) J. Grin, U. Burkhardt, and M. Ellner, Z. Kristallogr. 209, 479 (1994).
- Guenzburger and Ellis (1991) D. Guenzburger and D. E. Ellis, Phys. Rev. Lett. 67, 3832 (1991).
- Gonzales et al. (1998) P. G. Gonzales, L. A. Terrazos, H. M. Petrilli, and S. Frota-Pessôa, Phys. Rev. B 57, 7004 (1998).
- Watson and Weinert (1998) R. E. Watson and M. Weinert, Phys. Rev. B 58, 5981 (1998).
- Lue et al. (2001) C. S. Lue, Y. Öner, D. G. Naugle, and J. H. Ross, Jr., Phys. Rev. B 63, 184405 (2001).
- Chi et al. (2005) J. Chi, Y. Li, F. G. Vagizov, V. Goruganti, and J. H. Ross, Jr, Phys. Rev. B 71, 24431 (2005).
- Burkhardt et al. (1994) U. Burkhardt, Y. Grin, and M. Ellner, Acta. Cryst. B 50, 313 (1994).
- de Laissardière et al. (2005) G. T. de Laissardière, D. Nguyen-Manh, and D. Mayou, Prog. Mater. Sci. 50, 679 (2005).
- Fujiwara and Yokokawa (1991) T. Fujiwara and T. Yokokawa, Phys. Rev. Lett. 66, 333 (1991).
- Delahaye et al. (2003) J. Delahaye, T. Schaub, C. Berger, and Y. Calvayrac, Phys. Rev. B 67, 214201 (2003).
- Widmer et al. (2009) R. Widmer, P. Gröning, M. Feuerbacher, and O. Gröning, Phys. Rev. B 79, 104202 (2009).
- Coddens (2006) G. Coddens, Eur. Phys. J. B 54, 37 (2006).
- Widom (2008) M. Widom, Phil. Mag. 88, 2239 (2008).
- Abe et al. (2003) E. Abe, S. J. Pennycook, and A. P. Tsai, Nature 421, 347 (2003).
- Brand et al. (2009) R. A. Brand, F. Hippert, and B. Frick, J. Phys.: Condens. Matter 21, 045405 (2009).
- Chen et al. (1990) Z. W. Chen, R. M. Sharp, and J. T. Gregory, Mater. Sci. Technol. 6, 1173 (1990).
- Köster et al. (2001) M. Köster, B. Schuhmacher, and D. Sommer, Steel Res. 72, 371 (2001).
- Müller et al. (1991) F. Müller, M. Rosenberg, W. Liu, and U. Köster, Materials Science and Engineering A134, 900 (1991).
- Toby (2001) B. H. Toby, J. Appl. Cryst. 34, 210 (2001).
- Larson and von Dreele (2000) A. C. Larson and R. B. von Dreele, Tech. Rep. LAUR 86-748, Los Alamos National Laboratory (2000).
- Chikazumi and Graham (1997) S. Chikazumi and C. D. Graham, Physics of Ferromagnetism (Oxford University Press, 1997).
- Kanert and Mehring (1971) O. Kanert and M. Mehring, in NMR: Basic Principles and Progress, edited by E. Fluck and R. Kosfeld (Springer-Verlag, New York, 1971), vol. 3, p. 1.
- Stauss (1964) G. Stauss, J. Chem. Phys. 40, 1988 (1964).
- Carter et al. (1977) G. C. Carter, L. H. Bennett, and D. J. Kahan, Metallic Shifts in NMR (Pergamon, 1977).
- Narath (1967) A. Narath, in Hyperfine Interactions, edited by A. J. Freeman and R. B. Frankel (Academic Press, New York, 1967), p. 287.
- Ashcroft and Mermin (1976) N. W. Ashcroft and N. D. Mermin, Solid State Physics (Saunders, 1976).
- Dolinšek et al. (2001) J. Dolinšek, M. Klanjšek, and T. Apih, Ferroelectrics 250, 195 (2001).
- Jeglič and Dolinšek (2005) P. Jeglič and J. Dolinšek, Phys. Rev. B 71, 014204 (2005).
- Dolinšek et al. (2002) J. Dolinšek, T. Apih, P. Jeglič, M. Feuerbacher, M. Calvo-Dahlborg, U. Dahlborg, and J. M. Dubois, Phys. Rev. B 65, 212203 (2002).
- Szeftel and Alloul (1975) J. Szeftel and H. Alloul, Phys. Rev. Lett. 34, 657 (1975).
- Mammadov et al. (2010) E. Mammadov, P. C. Taylor, A. Reyes, S. Mehdiyeva, and P. Kuhns, Phys. Status Solidi A 207, 635 (2010).
- Mieher (1962) R. L. Mieher, Phys. Rev. 125, 1537 (1962).
- Cezairliyan (1988) A. Cezairliyan, Specific Heats of Solids (Hemisphere Publishing Corporation, New York, 1988).
- Lue et al. (1999) C. S. Lue, J. H. Ross, Jr., C. F. Chang, and H. D. Yang, Phys. Rev. B 60, R13941 (1999).
- Mantina et al. (2009) M. Mantina, S. L. Shang, Y. Wang, L. Q. Chen, and Z. K. Liu, Phys. Rev. B 80, 184111 (2009).
- Lue and Ross (1998) C.-S. Lue and J. H. Ross, Jr., Phys. Rev. B 58, 9763 (1998).
- Tang et al. (1997) X.-P. Tang, E. A. Hill, S. K. Wonnell, S. J. Poon, and Y. Wu, Phys. Rev. Lett. 79, 1070 (1997).
- Caplin et al. (1973) A. D. Caplin, G. Grüner, and J. B. Dunlop, Phys. Rev. Lett. 30, 1138 (1973).
- Zhou et al. (2006) Z. Zhou, C. Uher, D. Xu, W. L. Johnson, W. Gannon, and M. C. Aronson, Appl. Phys. Lett. 89, 031924 (2006).
- Phillips (1987) W. A. Phillips, Rep. Prog. Phys. 50, 1657 (1987).
- Talón et al. (2002) C. Talón, M. A. Ramos, and S. Vieira, Phys. Rev. B 66, 012201 (2002).