Measurements of the ion velocity distribution in an ultracold neutral plasma derived from a cold, dense Rydberg gas
Abstract
We report measurements of the ion velocity distribution in an ultracold neutral plasma derived from a dense, cold Rydberg gas in a MOT. The Rydberg atoms are excited using a resonant two-step excitation pathway with lasers of 4 ns duration. The plasma forms spontaneously and rapidly. The rms width of the ion velocity distribution is determined by measuring laser-induced fluorescence (LIF) of the ions. The measured excitation efficiency is compared with a Monte-Carlo wavefunction calculation, and significant differences are observed. We discuss the conditions for blockaded Rydberg excitation and the subsequent spatial ordering of Rydberg atom domains. While the blockade interaction is greater than the Rabi frequency in portions of the atomic sample, no evidence for spatial ordering is observed.
Submitted to J. Phys. B Special issue on Rydberg atom physics
I Introduction
The Rydberg blockade PhysRevLett.85.2208 ; PhysRevLett.87.037901 ; Comparat:10 ; 0953-4075-45-11-113001 ; RevModPhys.82.2313 occurs when a laser excites one atom to a Rydberg state in the presence of several ground-state atoms. Under certain conditions, the subsequent interactions between the Rydberg atom and neighboring ground-state atoms shifts the energy levels in such a way that none of the surrounding atoms can be excited by the laser. This blockade effect occurs over a characteristic distance scale given by the details of the atom-atom interaction.
In an atomic sample where the nearest-neighbor distance between atoms is much smaller than the blockade radius, the excitation blockade can lead to spatial ordering of the Rydberg atoms in the gas Schauss27032015 ; PhysRevA.78.040704 ; PhysRevLett.98.023002 ; PhysRevLett.104.013001 ; PhysRevLett.109.053002 ; PhysRevLett.110.253003 ; PhysRevA.88.061406 ; PhysRevLett.114.203002 . A spatially-ordered atomic system has many potential applications, not only in massively parallel quantum logic, but also in probing the behavior of many-body systems, engineering synthetic gauge fields, enhancing fusion in high-energy-density plasmas, and generating high brightness charged particle beam sources Comparat:10 ; 0953-4075-45-11-113001 ; RevModPhys.82.2313 ; salpeter69 ; ichimaru93 ; PhysRevLett.115.214802 .
The connection between dense Rydberg systems and plasma physics is very close. A number of experiments have reported that dense Rydberg systems spontaneously convert into plasmas vitrant82 ; bergeson98b ; gallagher03 ; walz04 ; vincent13 ; mcquillen13 ; lyon13 ; sadeghi14 . Although the initial atom temperature can be a few mK, the subsequent ion temperature is typically hundreds of times higher because of unbalanced forces between the ions PhysRevLett.110.253003 ; lyon11 ; chen04 ; lyon13 . This process is called disorder-induced heating (DIH), and it can severely limit the degree of strong coupling in the plasma. A plasma generated from an initially ordered system would circumvent disorder-induced heating, which is the largest source of heating in ultracold plasmas. The resulting ultracold system could become a robust platform for transport and kinetic studies near the plasma/solid interface strickler15 , with interesting applications for warm dense matter experiments murillo07 . It may be possible to generate an ordered plasma system from a cold Rydberg gas that is excited in the Rydberg blockade regime bijnen11 ; bannasch13 ; mcquillen13 .
Achieving spatial order in the laboratory for mm-sized atomic samples requires careful manipulation of the many-body wavefunction. The ground state of the ordered Rydberg crystal has one excited atom surrounded by several atoms in the ground electronic state. As discussed, for example, in Ref. 0953-4075-45-11-113001 , the many-body wavefunction for blockaded atoms has the form . The adiabatic transition to this low-energy and highly-ordered state from one in which all atoms are initially in the electronic ground state requires a shaped chirped pulse Schauss27032015 ; bannasch13 . However, even when the excitation pulse is not specifically tailored, blockading still occurs tong04 and this changes the spatial distribution of excited-state atoms Schauss27032015 .
Modifications in the initial nearest-neighbor distribution in an ultracold neutral plasma can lead to a significant reduction in the resulting disorder-induced heating sadeghi14 . This suggests that straight-forward excitation to Rydberg states using ns-duration pulsed lasers tong04 , followed by rapid ionization, could lead to an ultracold neutral plasma in which the ion temperature is lower than in a plasma created by direct excitation to the continuum.
In this paper, we explore the possibility of creating an ultracold neutral plasma with reduced temperature by exciting laser-cooled calcium atoms in a MOT to Rydberg states. The conditions under which blockading is expected to occur are presented. The Rydberg atom interactions lead to rapid ionization, as in Ref. PhysRevLett.100.043002 ; PhysRevA.90.022712 , as well as ion heating. We report measurements of the ion velocity distribution in the plasma derived from these interacting Rydberg atoms. While the blockade interaction is greater than the Rabi frequency in portions of the atomic sample, no evidence for blockaded excitation is observed.
II Blockade discussion
Excellent treatments of the Rydberg blockade have been reported in the literature Comparat:10 ; 0953-4075-45-11-113001 ; RevModPhys.82.2313 . The blockade energy is
| (1) |
where is the distance between ground-state atoms. The coefficients have been calculated for the Rydberg series in calcium 0953-4075-45-13-135004 . In atomic units, the coefficients are calculated using the expression
| (2) |
where is the principal quantum number of the Rydberg state and , , and . This expression is valid for . Conversion from atomic units is accomplished using the expression . For an atom separation of 2 m, excitation to gives an interaction energy of 33 MHz. This energy is a strong function of , so exciting to increases the interaction energy by an order of magnitude. This energy also scales with density-squared.
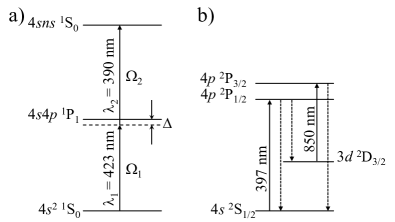
The time-scale for Rydberg excitation depends on laser intensity, principle quantum number, and density. Similar to most other current Rydberg experiments mcquillen13 ; PhysRevA.88.043430 ; PhysRevA.91.062702 , we use a two-step process to excite Rydberg levels. Our experiment uses laser pulses at 423 and 390 nm (see Fig. 1). The Rabi frequency for the 390 nm excitation, the second step in our experiment, can be calculated if the transition matrix element is known. In calcium it is probably similar to the rubidium value RevModPhys.82.2313 , . The Rabi frequency is calculated as
| (3) |
where is the electron charge and is the electric field from the 390 nm laser. For excitation to and a laser intensity of mW/cm2, the Rabi frequency is . As discussed in Ref. 0953-4075-45-11-113001 , when there are atoms in a blockade sphere, then the Rabi frequency is increased by a factor of and also by a coordination number that includes the influence of neighbors beyond the nearest one.
The Rabi frequency can also be written in terms of the laser intensity,
| (4) |
where is the natural linewidth, is the excited state lifetime, is the laser intensity, and is the saturation intensity. A large Rabi frequency power-broadens the atomic transition so that the full-width at half-maximum (FWHM) is,
| (5) |
This power-broadened linewidth sets the time-scale for the blockade. The assumption in all Rydberg blockade work is that the interaction energy is much greater than the Rabi frequency, or .
As discussed previously, the interaction energy depends on the nearest-neighbor distance. In our thermal sample, these distances have a distribution. Consequently, depending on the excitation parameters, portions of the atomic sample may be in the blockade regime, as discussed below.
III Nearest-neighbor distribution in a MOT
For a thermal gas at constant density, the nearest-neighbor distribution is given by the Erlang distribution,
| (6) |
where is the Wigner-Seitz radius and is the density. In a MOT, where the density is Gaussian of the form , the nearest neighbor distribution changes. At small values of , it has nearly the same form as . However, the distribution falls off much more slowly when because the density falls off gradually and the average nearest-neighbor distance increases.
In ultracold neutral plasmas, most of the disorder-induced heating (DIH) comes from ions that are much closer to each other than the average distance. If the nearest-neighbor distribution could be suppressed at short distances, the DIH temperature would be reduced sadeghi14 . If the initial order matched the close-packed configuration of a strongly-coupled plasma, DIH would be eliminated lyon15b .
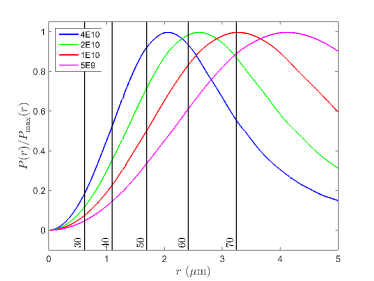
Depending on the experimental conditions, portions of the atomic cloud are found to be in a regime in which blockaded excitation is expected to occur. We derive the nearest-neighbor distribution in the MOT by generating a three-dimensional random-normal distribution and computing the distance from each atom to its first nearest neighbor. In Fig. 2 we plot this distribution for a few different peak MOT densities. Also shown in Fig. 2 are vertical lines that indicate the radius at which the interaction energy is equal to 300 MHz for a range of principle quantum numbers. This value is chosen because it matches the measured frequency width (FWHM) of our laser pulses. Because the interaction energy scales as the nearest-neighbor distance to the sixth power, atoms to the left of the vertical lines should be strongly within the blockaded excitation regime. We therefore expect the leading edge of the nearest-neighbor distribution to be suppressed in these systems sadeghi14 .
IV Experimental details
Calcium atoms in a thermal beam (T = 750 K) are slowed and captured into a MOT (T 0.001 K). The Rydberg atoms are excited using a two-step process, as shown in Fig. 1. The first step is nearly-resonant with the 423 nm laser-cooling transition, with . A cw laser beam at 423 nm is pulse-amplified in a single transverse-pumped dye cell. An AOM is used to turn the cw laser beam on 100 ns before the pump laser arrives at the dye cell. The pump laser pulse width is 4 ns FWHM. The pulse-amplified 423 nm laser beam is expanded, apertured to a few mm diameter, attenuated, and imaged into the MOT. The resulting intensity profile is relatively flat, with so that the power-broadened linewidth is 350 MHz, approximately equal to the bandwidth of the laser. The corresponding Rabi frequency for this transition is .
The transition is driven using a pulse-amplified frequency-doubled ti:sapphire laser near 390 nm. An AOM is also used in this laser beam to turn the cw laser on 100 ns before the pump laser arrives at the dye cell. As with the 423 nm laser, this laser is also apertured and imaged into the MOT so that the intensity is in the range of mW/cm2. The two lasers counterpropagate each other in the MOT and arrive simultaneously. The intensity of this laser is adjusted so that the Rabi frequency ranges from 1 to 300 MHz, similar to other ns-pulsed experiments PhysRevLett.107.243001 ; kubler10 .
Laser pulses with durations in the s range are typically used in blockade experiments. Unfortunately for us, the atoms in our MOT move on the s time scale. At a typical density of and a temperature of 1 mK, the average time between nearest-neighbor collisions is only 2 s. This motion results in collisions, placing s-duration pulsed laser experiments in Ca outside of the “frozen gas” assumption used in all blockade experiments (see Fig. 1). Unless the atoms are much colder or the atoms tightly confined to short distances, ns-duration laser pulses are required.
Rydberg excitation efficiency is measured using MOT loss measurements. A weak, resonant cw 423 nm laser beam passes through the MOT. When the MOT is loaded, the transmission of this laser beam is typically 1%. When the MOT atoms are excited to Rydberg states, they no longer interact with this laser beam and the transmission increases. Using Beer’s law we are able to convert this transmission into atomic density. In a typical measurement, we measure the changes in transmission of this probe laser beam as the 390 nm laser frequency is scanned across the Rydberg excitation resonance. To avoid EIT effects, the probe laser is turned off while the excitation lasers are on.
The atomic spectroscopy is performed by offset-locking the lasers to a partially-stabilized frequency comb lyon2014 . This provides long-term stability, accurate determinations of the absolute frequencies, and convenient frequency scanning of the lasers. The comb uses a passively mode-locked ti:sapphire laser with a repetition rate, . Its spectrum is nominally Gaussian, 35 nm FWHM, and centered at 815 nm. Without broadening, the spectrum gives strong beat notes with all of the cw lasers used in this experiment ( dB above the technical noise, 30 kHz measurement bandwidth). One mode of the comb is offset-locked to a 780 nm diode laser that is itself locked to the cross-over transition. The offset lock feeds back to the ti:sapphire laser cavity length. The absolute frequency of one comb mode is therefore known with a precision of a few kHz. The repetition rate of the laser is not controlled. However repeated measurements of the repetition rate in a 1-second measurement duration show drifts of approximately 1 Hz/s. Therefore, counting the repetition rate during our experiments allows us to determine laser frequencies with sub-MHz precision.
V Pulsed excitation measurements
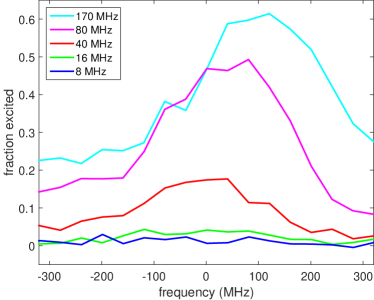
In Fig. 3 we show the fraction of MOT atoms excited to the state as a function of the 390 nm laser frequency. The data shows increasing excitation as increases. For excitation to this level, we expect no blockading to occur. The peak density in the MOT is . As the increases, the excitation fraction grows, and the line center is Stark shifted and broadened. The signal-to-noise ratios in these data are compromised by shot-to-shot fluctuations in the excitation lasers, density fluctuations in the MOT, and by technical noise in the strongly-attenuated probe laser beam.
We have collected data like this for and . As the excitation proceeds to greater values of , the lines are significantly broadened even at low excitation fractions. At , for example, the line is broadened beyond 800 MHz.
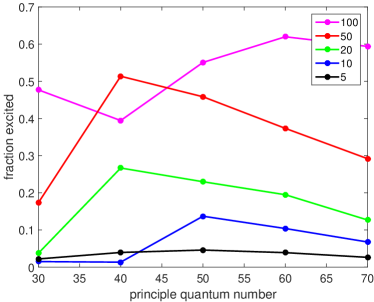
In Fig. 4 we plot the peak excitation fraction as a function of principle quantum number for a range of different 390 nm laser powers. For the highest laser powers, the excitation fraction never varies far from 0.5. This indicates that there is relatively little ionization or other loss on the time scale of the Rydberg excitation pulse. The highest laser power probably power-broadens the Rydberg transition so that it exceeds the energy. At higher values of , the and states are only a few hundred MHz apart, and the transitions are not well separated.
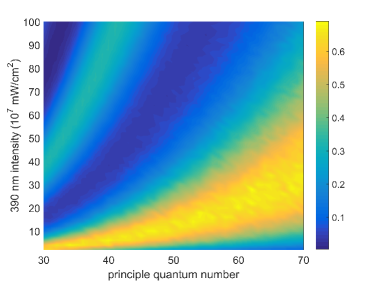
Two features stand out in this figure. We will consider the red trace for a laser intensity of . The excitation fraction increases with increasing from 30 to 40. At higher values of the principle quantum number, the excitation fraction falls slowly. This behavior is also observed for most of the other intensities, although the value of above which the excitation fraction falls appears to be greater at lower intensities.
VI Monte-Carlo wavefunction calculation
To understand the excitation process, as well as the possible influence of blockading on the excitation dynamics, we have constructed a three-level model based on the Monte-Carlo wave function (MCWF) method PhysRevLett.68.580 ; Molmer:93 . This method is appropriate for calculating excitation amplitudes in the presence of radiative decay. We begin with a single-atom wavefunction where and represent the , , and levels and and are their time-dependent amplitudes. The Schrödinger equation is used with a rotating-wave approximation to find the time-evolution of the eigenstate amplitudes. In the time interval , these amplitudes change according to
| (7) |
where PhysRevA.64.012508 ; PhysRevA.67.043408 . This is equivalent to treating both transitions in a rotating frame, with each frame rotating independently of the other. The Rydberg state is assumed to be stable.
Decay of the intermediate state is calculated probabilistically. In the standard MCWF manner, we calculate a probability and compare it to a random number generated with uniform probability between 0 and 1. If , then the state has decayed and we set the amplitudes and to and and proceed with the calculation. To ensure proper normalization, we calculate at every time step and divide this into the amplitudes. Because , this amplitude correction is small and is equivalent to the normalization method used in Refs. PhysRevLett.68.580 ; Molmer:93 .
The calculated value of is plotted in Fig. 5. This corresponds to the probability of finding an atom in the Rydberg state after the laser pulses are over As expected, the simulation shows the population in the Rydberg state oscillating at the frequency during the laser pulse. The greatest excitation occurs when a the pulse intensity and dipole moment produce a single -rotation.
The simulation in Fig. 5 qualitatively reproduces some features observed in the experiment. For example, it captures the low-amplitude excitation for lower values of the principle quantum number, and increasing excitation with at a given laser intensity. However, the profiles in Fig. 4, which correspond to horizontal cuts across the data in Fig. 5, depend differently on laser intensity. The experimental data of Fig. 4 shows that excitation decreases with lower laser power. The simulation data of Fig. 5 shows that excitation increases with decreasing laser intensity. In the simulation, this happens because the higher intensities produce multiple Rabi oscillations, resulting in lower overall excitation after the laser pulses are over.
These differences may be partly due to collective excitation and interactions of the Rydberg levels, effects that are omitted from the simulation. However, other factors may also be important. In the experiment, we observe significant shot-to-shot variation in the laser power. The pulsed laser amplifiers use a multi-longitudinal-mode Nd:YAG laser. The fast temporal structure in these pulses can produce broad wings in the spectral profile, whereas the simulation is performed on resonance for a single frequency. Finally, interactions between the Rydberg atoms beyond collective excitation could be important.
VII Ion velocity distribution measurements
After the Rydberg atoms are created, they spontaneously ionize. A recent study in Ref. PhysRevLett.100.043002 proposed a many-atom ionization mechanism. In a dense Rydberg gas, the configuration with all individual atoms in the well-defined Rydberg state is not necessarily an eigenstate of the many-body system. The authors of Ref. PhysRevLett.100.043002 suggest that the excited Rydberg atoms make a series of transitions to nearby excited states and that some of these atoms eventually end up in the continuum. This state diffusion is predicted to be the major ionization mechanism when at a density of . If the Rydberg atoms transition from the initial Rydberg state to nearby states that are dipole-coupled, the mechanical force on the atoms can collisionally ionize the atoms in the 100 ns time scale noted in their experiment. A recent simulation of the experiment could not reproduce the prompt ionization of the experiment PhysRevA.90.022712 . However, electron collisions and collisions with fast atoms were not included in the simulation. Those effects may boost the ionization signal at early times.
A calculation in Ref. 0953-4075-44-18-184015 suggests that the avalanche ionization rate per atom at a density of and a principle quantum number of 50 is only . This is far too slow to explain ionization. Direct collisional ionization of the Rydberg atoms due to thermal motion occurs on the time scale 0953-4075-38-2-024 .
The mechanical forces between Rydberg atoms has been documented in a number of publications. This happens when some mechanism transfers atoms from the initial Rydberg state to some other state. This can occur through collisions PhysRevLett.94.173001 , interactions at Förster resonances or collisional resonances PhysRevA.78.040704 ; Comparat:10 ; PhysRevLett.109.053002 ; PhysRevLett.94.173001 , through blackbody radiation PhysRevLett.98.023004 , or transitions induced using microwaves 0953-4075-44-18-184020 ; PhysRevLett.115.013001 ; PhysRevA.84.052708 . When present, these mechanical forces will accelerate Rydberg atoms towards (or away from) one another. If this Rydberg gas is converted into an ultracold plasma, the ions will inherit the velocity distribution of the Rydberg atoms.
In our experiment, similar to Ref. PhysRevLett.100.043002 , we observe a rapid rise in the ion signal following excitation to Rydberg states. However, complete conversion of the Rydberg system into a plasma seems to occur over a few microseconds.
Using laser spectroscopy, we probe the Rydberg system after it has been excited. We use a cw laser at 397 nm to drive the transition, as in our previous ultracold neutral plasma experiments lyon15 . When the Rydberg atoms are in states with low angular momentum, this “inner core” excitation leads to extremely fast ionization. A recent study on similar states in Sr showed that the width of this auto-ionizing resonance is measured in THz 0953-4075-44-18-184001 , suggesting that autoionization occurs in less than one ps. The Rydberg atom is instantly converted into an ion when the inner electron is excited. That ion initially has the same velocity as the Rydberg atom. The combined motion of the Rydberg atoms before ionization and also the motion of the ions after ionization both contribute to the width of the laser-induced fluorescence signal at 397 nm.
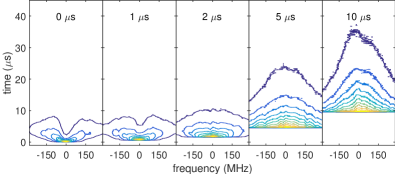
In Fig. 6 we present contour plots of the ion fluorescence signal as a function of frequency and time. In these measurements we introduce a delay between the time when the Rydberg states are initially populated and when the 397 nm probe laser turns on. This provides insight into the time-scale for transferring atoms out of the initial Rydberg state by collisions or other mechanisms. For each of the measurements, a repump laser at 850 nm is used to prevent population from accumulating in the metastable -state (see Fig. 1).
For time delays of 0 and 1 s, the fluorescence is depleted when the 397 nm laser is on resonance. In addition, the entire fluorescence signal vanishes in less than 10 s. For these measurements, autoionization of Rydberg atoms is the dominant loss mechanism when the laser is on resonance. At later delay times, the fluorescence signal is less strongly perturbed by the 397 nm laser. At these times, the Rydberg atoms have been converted into ions or diffused into high angular momentum states in which the 397 nm probe laser beam does not significantly perturb the velocity distribution.
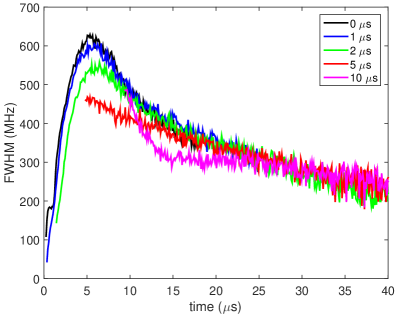
In Fig. 7 we measure the FWHM as a function of time for all of the data in Fig. 6. While it could be argued that the 0 and 1 s data are strongly perturbed by the 397 nm laser, it appears that the longer delay data are not. The width of the fluorescence signal rises to several hundred MHz, corresponding to velocities on the order of 200 m/s. This occurs with and without the presence of the 397 nm laser. The nearly linear rise in the fluorescence width indicates that the ion acceleration is approximately m/s2.
The central question in this investigation is whether or not the excitation of the Rydberg atoms is blockaded by the Rydberg-Rydberg interaction, and if that blockaded excitation would lead to a spatial ordered Rydberg system. The primary manifestation of that blockading and ordering should be the slow expansion of the plasma. Data previously published by us on the expansion of ultracold neutral plasmas shows characteristic post-DIH broadening of the velocity distribution of roughly m/s2 lyon13 , depending on electron temperature. This value is same order of magnitude as the value derived from Fig. 7. We therefore must conclude that the Rydberg blockade is likely not significant in these data.
It is possible that blockading and ordering is present but that it is masked by some other effect. The plasma expansion is driven by the electrons. Anything that heats the electrons will contribute to faster plasma expansion. Energy-pooling collisions between free electrons and excited-state ions and auto-ionization from the excited inner-shell electron, for example, could contribute significantly to electron heating.
VIII Conclusion
We have explored evidences of blockaded Rydberg excitation of laser-cooled Ca atoms in a MOT using ns-duration laser pulses. The energy scales set by the Rabi frequency and the interaction seem to be appropriate for blockaded excitation and spatial ordering in portions of the atom sample. However, our velocity measurements provide no indication that this effect is present.
The presence of charged particles in our MOT would prevent realization of the blockade. It is possible that the transition from a Rydberg atom to an ion occurs on time scales shorter than the 4 ns laser pulse. Under certain conditions, we measure ions emitted from our MOT. We have minimized these in the present work by applying a constant electric field until 100 ns before the laser pulse arrives, effectively sweeping all charged particles from the MOT when the Rydberg excitation occurs.
It is also possible that blockaded excitation occurs, but that the initial Rydberg state is rapidly scrambled by interactions with other particles. This would lead to large mechanical forces, as mentioned previously, that could produce ions rapidly.
It would be better to excite these Rydberg atoms using a longer laser pulse, perhaps 50 ns in duration with a smooth temporal profile. Such an excitation pulse would place less stringent constraints on the Rabi frequency. One could even imagine tailoring the frequency and intensity of such a laser pulse. However, all laser issues aside, the uncontrolled nearest-neighbor distribution in a MOT would undoubtedly complicate the blockade mechanism, producing an uncontrolled number of Rabi cycles and resulting in low excitation probability (see Fig. 5) and weak blockading.
IX Acknowledgements
This research is supported in part by the Air Force Office of Scientific Research (Grant No. FA9950-12-0308) and by the National Science Foundation (Grant No. PHY-1404488).
References
- (1) Jaksch D, Cirac J I, Zoller P, Rolston S L, Côté R and Lukin M D 2000 Phys. Rev. Lett. 85(10) 2208–2211
- (2) Lukin M D, Fleischhauer M, Cote R, Duan L M, Jaksch D, Cirac J I and Zoller P 2001 Phys. Rev. Lett. 87(3) 037901
- (3) Comparat D and Pillet P 2010 J. Opt. Soc. Am. B 27 A208–A232
- (4) Löw R, Weimer H, Nipper J, Balewski J B, Butscher B, Büchler H P and Pfau T 2012 Journal of Physics B: Atomic, Molecular and Optical Physics 45 113001
- (5) Saffman M, Walker T G and Mølmer K 2010 Rev. Mod. Phys. 82(3) 2313–2363
- (6) Schauss P, Zeiher J, Fukuhara T, Hild S, Cheneau M, Macr T, Pohl T, Bloch I and Gross C 2015 Science 347 1455–1458
- (7) Viteau M, Chotia A, Comparat D, Tate D A, Gallagher T F and Pillet P 2008 Phys. Rev. A 78(4) 040704
- (8) Ates C, Pohl T, Pattard T and Rost J M 2007 Phys. Rev. Lett. 98(2) 023002
- (9) Amthor T, Giese C, Hofmann C S and Weidemüller M 2010 Phys. Rev. Lett. 104(1) 013001
- (10) Viteau M, Huillery P, Bason M G, Malossi N, Ciampini D, Morsch O, Arimondo E, Comparat D and Pillet P 2012 Phys. Rev. Lett. 109(5) 053002
- (11) Bannasch G, Killian T C and Pohl T 2013 Phys. Rev. Lett. 110(25) 253003
- (12) Schwarzkopf A, Anderson D A, Thaicharoen N and Raithel G 2013 Phys. Rev. A 88(6) 061406
- (13) Urvoy A, Ripka F, Lesanovsky I, Booth D, Shaffer J P, Pfau T and Löw R 2015 Phys. Rev. Lett. 114(20) 203002
- (14) Salpeter E E and van Horn H M 1969 Ap. J. 155 183
- (15) Ichimaru S 1993 Rev. Mod. Phys. 65(2) 255–299
- (16) Murphy D, Scholten R E and Sparkes B M 2015 Phys. Rev. Lett. 115(21) 214802
- (17) Vitrant G, Raimond J M, Gross M and Haroche S 1982 Journal of Physics B: Atomic and Molecular Physics 15 L49
- (18) Rolston S L, Bergeson S D, Kulin S and Orzel C 1998 Bull. Am. Phys. Soc. 43
- (19) Gallagher T F, Pillet P, Robinson M P, Laburthe-Tolra B and Noel M W 2003 J. Opt. Soc. Am. B 20 1091–1097
- (20) Walz-Flannigan A, Guest J R, Choi J H and Raithel G 2004 Phys. Rev. A 69(6) 063405
- (21) Robert-de Saint-Vincent M, Hofmann C S, Schempp H, Günter G, Whitlock S and Weidemüller M 2013 Phys. Rev. Lett. 110(4) 045004
- (22) McQuillen P, Zhang X, Strickler T, Dunning F B and Killian T C 2013 Phys. Rev. A 87(1) 013407
- (23) Lyon M, Bergeson S D and Murillo M S 2013 Phys. Rev. E 87(3) 033101
- (24) Sadeghi H, Kruyen A, Hung J, Gurian J H, Morrison J P, Schulz-Weiling M, Saquet N, Rennick C J and Grant E R 2014 Phys. Rev. Lett. 112(7) 075001
- (25) Lyon M and Bergeson S D 2011 Journal of Physics B: Atomic, Molecular and Optical Physics 44 184014
- (26) Chen Y C, Simien C E, Laha S, Gupta P, Martinez Y N, Mickelson P G, Nagel S B and Killian T C 2004 Phys. Rev. Lett. 93 265003
- (27) Strickler T S, Langin T K, McQuillen P, Daligault J and Killian T C 2015 (Preprint eprint 1512.02288)
- (28) Murillo M S 2007 Physics of Plasmas 14 055702 (pages 7)
- (29) van Bijnen R M W, Smit S, van Leeuwen K A H, Vredenbregt E J D and Kokkelmans S J J M F 2011 Journal of Physics B: Atomic, Molecular and Optical Physics 44 184008
- (30) Bannasch G, Killian T C and Pohl T 2013 Phys. Rev. Lett. 110(25) 253003
- (31) Tong D, Farooqi S M, Stanojevic J, Krishnan S, Zhang Y P, Côté R, Eyler E E and Gould P L 2004 Phys. Rev. Lett. 93(6) 063001
- (32) Tanner P J, Han J, Shuman E S and Gallagher T F 2008 Phys. Rev. Lett. 100(4) 043002
- (33) Robicheaux F, Goforth M M and Phillips M A 2014 Phys. Rev. A 90(2) 022712
- (34) Vaillant C L, Jones M P A and Potvliege R M 2012 Journal of Physics B: Atomic, Molecular and Optical Physics 45 135004
- (35) Ye S, Zhang X, Killian T C, Dunning F B, Hiller M, Yoshida S, Nagele S and Burgdörfer J 2013 Phys. Rev. A 88(4) 043430
- (36) Fahey D P, Carroll T J and Noel M W 2015 Phys. Rev. A 91(6) 062702
- (37) Lyon M, Bergeson S D, Hart G and Murillo M S 2015 Scientific Reports 5 15693
- (38) Huber B, Baluktsian T, Schlagmüller M, Kölle A, Kübler H, Löw R and Pfau T 2011 Phys. Rev. Lett. 107(24) 243001
- (39) Kübler H, Shaffer J P, Baluktsian T, Löw R and Pfau T 2010 Nat. Phot. 112–116
- (40) Lyon M and Bergeson S D 2014 Appl. Opt. 53 5163–5168
- (41) Dalibard J, Castin Y and Mølmer K 1992 Phys. Rev. Lett. 68(5) 580–583
- (42) Mølmer K, Castin Y and Dalibard J 1993 J. Opt. Soc. Am. B 10 524–538
- (43) Porsev S G, Kozlov M G, Rakhlina Y G and Derevianko A 2001 Phys. Rev. A 64(1) 012508
- (44) Degenhardt C, Binnewies T, Wilpers G, Sterr U, Riehle F, Lisdat C and Tiemann E 2003 Phys. Rev. A 67(4) 043408
- (45) Saquet N, Morrison J P, Schulz-Weiling M, Sadeghi H, Yiu J, Rennick C J and Grant E R 2011 Journal of Physics B: Atomic, Molecular and Optical Physics 44 184015
- (46) Robicheaux F 2005 Journal of Physics B: Atomic, Molecular and Optical Physics 38 S333
- (47) Li W, Tanner P J and Gallagher T F 2005 Phys. Rev. Lett. 94(17) 173001
- (48) Amthor T, Reetz-Lamour M, Westermann S, Denskat J and Weidemüller M 2007 Phys. Rev. Lett. 98(2) 023004
- (49) Tanasittikosol M, Pritchard J D, Maxwell D, Gauguet A, Weatherill K J, Potvliege R M and Adams C S 2011 Journal of Physics B: Atomic, Molecular and Optical Physics 44 184020
- (50) Teixeira R C, Hermann-Avigliano C, Nguyen T L, Cantat-Moltrecht T, Raimond J M, Haroche S, Gleyzes S and Brune M 2015 Phys. Rev. Lett. 115(1) 013001
- (51) Park H, Shuman E S and Gallagher T F 2011 Phys. Rev. A 84(5) 052708
- (52) Lyon M, Bergeson S D, Diaw A and Murillo M S 2015 Phys. Rev. E 91(3) 033101
- (53) Millen J, Lochead G, Corbett G R, Potvliege R M and Jones M P A 2011 Journal of Physics B: Atomic, Molecular and Optical Physics 44 184001