Robust Image Watermarking Using Non-Regular Wavelets
Abstract
An approach to watermarking digital images using non-regular wavelets is advanced. Non-regular transforms spread the energy in the transform domain. The proposed method leads at the same time to increased image quality and increased robustness with respect to lossy compression. The approach provides robust watermarking by suitably creating watermarked messages that have energy compaction and frequency spreading. Our experimental results show that the application of non-regular wavelets, instead of regular ones, can furnish a superior robust watermarking scheme. The generated watermarked data is more immune against non-intentional JPEG and JPEG2000 attacks.
Keywords
Robust watermarking, non-regular wavelets, JPEG compression
1 Introduction
Digital watermarking of images has been an active area of research for over a decade. The main objectives of watermarking are to protect the ownerships of the host images and to preserve their authenticities. Watermarking techniques have also been applied in areas as diverse as data hiding [1], biomedical signal processing [2, 3], image indexing [4], image hashing [5], and broadcast monitoring [6]. The two main requirements are that watermarks be imperceptible and robust against lossy signal processing. Watermarking methods that are not robust against lossy signal processing are called fragile [7]. In principle, robust watermarking is performed by inserting a hidden message — the watermark — into a host image, such that the hidden message can survive different types of attacks such as compression, resizing, filtering, re-scanning, or printing. Detection algorithms are used to retrieve the watermark from watermarked messages [8]. The robustness of a watermarking algorithm is measured by the ability to detect successfully the watermark after an attack.
Early watermarking algorithms used spatial domain techniques which insert watermarked messages into the spatial domain of the host images [9]. Generally, inserted messages were pseudorandom sequences similar to the sequences found in spread spectrum techniques used in wireless communications systems [10]. Pseudorandom messages could be obtained by first creating an 1-D random message with length equal to the number of columns. Then this random message was circularly shifted with random phase shift for each row. Mainly, the watermark could be detected using correlation techniques. Block-based 2-D signal processing could also be used [11]. Because spread-spectrum pseudo-noise contains high frequency components, the robustness of spatial techniques are sensitive to compression and lowpass filters. Nevertheless, it continues to find recent applications [12].
Another possible venue is the insertion of the watermark into the spectral domain of the subject data. There are approaches that embed the watermark in the low-frequency subbands to improve the robustness against a variety of attacks, e.g. lowpass filtering and compression. Several transform techniques have been employed to fulfill this purpose. Among them, the discrete Fourier transform, the discrete cosine transform, and a number of wavelet transforms deserve mention. However, current investigations in this area significantly embrace the application of wavelets. Publications [13, 14, 15, 16] describe several wavelet domain watermarking methods and include comparisons.
In this paper, we propose a new watermarking technique that is based on non-regular wavelet transforms. The application of non-regular transforms to image processing is novel. Our experimental results show that non-regular transforms are superior to regular transforms for robust watermarking purposes. The reason that non-regular wavelet filters are more robust is that they offer energy spreading, while regular wavelet filters offer energy concentration.
The paper is organized as follows. Section 2 presents non-regular discrete wavelet transforms (DWT) and a watermarking method using non-regular wavelets is proposed in Section 3. In Section 4, a statistical method for watermarking detection is elaborated. Computational experiments and discussions are presented in Section 5. Finally, Section 6 summarizes the obtained results.
2 Non-regular Discrete Wavelet Transforms
Frequently, wavelet generation is based on filter bank methods. Filter banks that perform DWT have always been designed so that in addition to perfect reconstruction the filters have in some sense good frequency responses, e.g. in two-channel transforms has always been required to be a good lowpass filter and — to be a good highpass filter. Good lowpass and highpass filters have the energy compaction property. Provided that is regular, iterative algorithms for wavelet generation converge and smooth functions can be obtained [17]. If is non-regular, then iterative processes fail to converge [18]. For example, complementary or Golay-Rudin-Shapiro (GRS) polynomials, which have coefficients equal to or [19], can be utilized to design non-regular wavelet filters. Two polynomials, and , each with coefficients, are complementary if
| (1) |
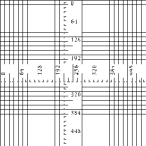
Then the filter pair , and defines an orthogonal wavelet transform. In particular, the non-regular filters and , called here GRS4 filters, have frequency responses as shown in Figure 1. For instance, this pair of filters induce the generation of the GRS4 wavelets. It is worth to note that these filters do not offer energy compaction, but offer energy spreading. Starting from a kernel with four coefficients, other wavelet filters can be obtained recursively. These non-regular filters have been used in other communications applications [20], where energy spreading is desirable.

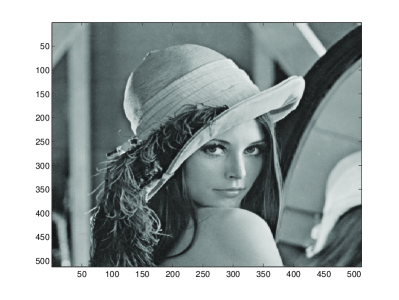
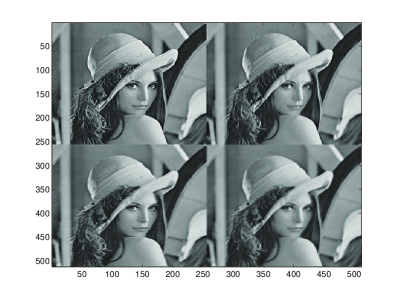
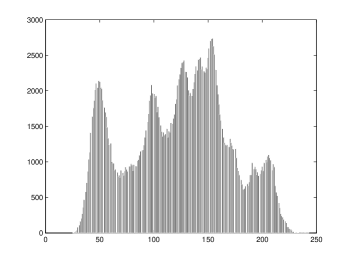
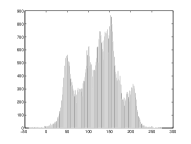
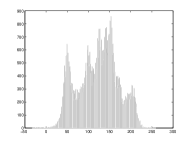
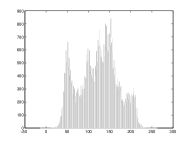
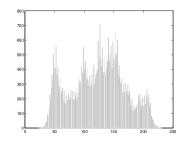
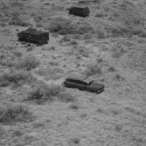
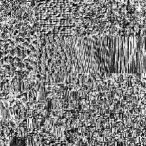
Unlike regular filters, when non-regular filters are used, a given signal and its DWT share similar statistical properties. To illustrate this, Figure 2(a) shows the Lena image in the spatial domain, as well as in the transform domain furnished by the GRS4 wavelet (Figure 2(b)). Clearly, the non-regular transform spreads the energy in all subbands. In Figure 2(c) and (d), histograms of the original image and the GRS4 DWT subbands are depicted, exhibiting noticeable visual similarity. In order to quantify this behavior, techniques for measuring the statistical proximity between two probability distributions were considered. A useful tool for this purpose is the Jensen-Shannon divergence [21]. This particular divergence is based on the Kullback-Leibler divergence [22].
 |
 |
 |
 |
Extensive computer simulations have been performed with 20 different test images from the USC-SIPI image database [23]. Then the Jensen-Shannon divergence among each image and its GRS4 DWT subbands was calculated. Table 1 shows the average of the obtained values for the Jensen-Shannon divergence. Note that the distances are extremely small, clearly indicating a high statistical proximity among the examined images and their GRS4 DWT subbands. Other GRS wavelets also offer comparable results.
The energy spreading property of the non-regular filter banks explains the obtained statistical similarities. In fact, this information theoretical proximity between spatial and transform domains is explored to propose a new robust watermarking scheme.
| JSD () | Original | LL | LH | HL | HH |
|---|---|---|---|---|---|
| Original | 0 | - | - | - | - |
| LL | 3.2014 | 0 | - | - | - |
| LH | 2.5290 | 0.7972 | 0 | - | - |
| HL | 2.3966 | 0.9731 | 0.2843 | 0 | - |
| HH | 2.6530 | 2.5759 | 0.8467 | 0.6518 | 0 |
3 Image Watermarking Using Non-regular DWT
The block diagram of the proposed watermarking algorithm is shown in Figure 3. The scheme includes three generic steps: watermark insertion, attack, and detection. The watermark insertion begins by computing the DWT of the input image to obtain the low-low (LL), low-high (LH), high-low (HL), and high-high (HH) subbands. The watermark message is inserted in the wavelet domain by
| (2) |
where is the watermarked data in transform domain, is the wavelet transform of the original image , is the watermark message, and is a scalar value associated to the watermark strength. Usually, the watermark can be embedded in all subbands except LL, or — as discussed here — when non-regular filters are used, in all subbands, including LL. The size of the watermarking message is equal to the size of the image when the watermark is embedded in all subbands. When the watermark is inserted in the LH, HL, and HH subbands, the size of the watermarking message is equal to the combined size of these subbands. The watermark strength should be chosen to satisfy the two requirements of image quality and robustness.
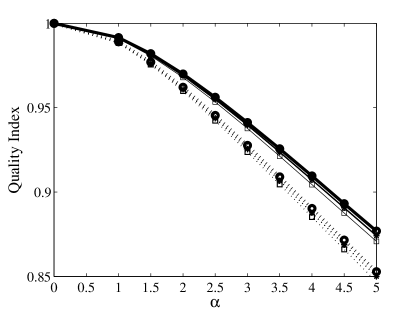
The first requirement is that the watermarked image be indistinguishable from the original image. While this can be verified subjectively using just-noticeable-difference [24], the quality of the watermarked image can be calculated using the universal quality index (UQI) proposed in [25]. Although the UQI is not based on any HVS model, it outperforms, for example the mean squared error and the peak signal-to-noise ratio, as a measure of quality. It is accepted that a UQI value of or greater generally indicates an imperceptibly distorted image. Based on a set of twelve standard images available at the USC-SIPI image database [23], the average UQI of the images as a function of the watermark strength , for several wavelets with and without using the subband LL, was calculated and shown in Figure 4. Therefore, a reliable range for the selection of the watermark strength is . Judiciously, was set to three in all instances of this work. Figure 4 also clearly indicates that non-regular filters lead to higher values of the universal quality index. Additionally, when regular filters are used and the watermark is inserted in the LL subband, the image quality is lower, as the watermark becomes noticeable. Posterior to the insertion of the watermark according to Equation 2, the computation of the inverse DWT of furnished the watermarked image .
In the next step, the watermarked image is submitted to non-intentional attacks, modeled by lossy signal processing. Specifically, both JPEG and JPEG2000 compression schemes are employed. Unlike JPEG coding, JPEG2000 is a wavelet based scheme. The compression attack can be recognized as an additive noise signal , which produces a corrupted image .
The final step consists of a statistical analysis aiming the estimation and detection of the watermark message. The estimated watermark is obtained using a non-blind approach, in which the original image is required. After a forward DWT application on , the quantity is returned and the watermark message is estimated by the following expression:
| (3) |
Once the watermark message is estimated, it is necessary to establish whether it matches the authentic watermark . The detection phase is based on the correlation coefficient between and . This quantity is evaluated as follows
| (4) |
where denotes the usual inner product and is the norm.
In this study, the watermarks were generated by random binary sequences of and with equal probabilities. A same random message is added to each subband. Observe that, for a fixed image, each step of the watermarking procedure is deterministic. Then, a suggested approach to investigate the behavior of is to perform the watermarking procedure employing different random watermarks. Therefore, the resulting becomes a random variable to be analyzed.
4 Detection Method
According to an observed value of , a binary hypothesis test was taken in consideration attempting to decide between the following two hypothesis: (i) the null hypothesis (), corresponding to the absence of a correct watermark, and (ii) the alternative hypothesis (), implying the existence of a matching watermark. It is worth to note that the complete absence of the watermark, i.e. , is categorized as a mismatch.
Using a conservative approach, a detector based on the Neyman-Pearson (NP) lemma was devised [26]. The NP lemma establishes a threshold based test that maximizes the probability of detection subject to a prescribed probability of false alarm . In symbols, for a given correlation coefficient , the decision rule is to decide if
| (5) |
otherwise, decide . The function is the likelihood ratio, and are the probability density functions (pdfs) of for each hypothesis, respectively, and the threshold is given by [26]
| (6) |
Unfortunately, the NP detector assumes that the pdfs of , for each hypothesis, are known. However, no analytical expressions for the above mentioned pdfs are available. Consequently, exhaustive numerical simulations were performed to obtain the empirical pdfs of , and , as approximations for and , respectively [27].
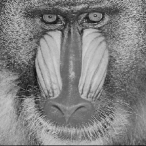
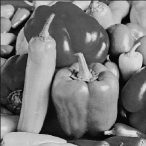

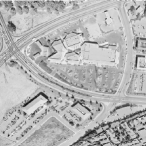
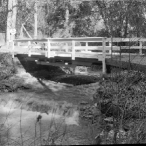


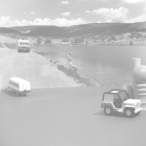
To compute the empirical pdfs of , an initial set of twelve standard images available at the USC SIPI database [23] was selected, as shown in Figure 5. Each image was submitted to the discussed watermarking procedure. All the factors that contribute to the quantification of the response variable were considered and, in a sense, a factorial experiment was designed [28]. Several wavelets were employed, namely Daubechies-4, Daubechies-8, Coiflet-6, biorthogonal 6/2, and GRS4, where the numbering indicates the size of the respective filters. Also various degrees of attack were utilized. For the standard JPEG compression, the attack strength can be measured by the JPEG quality factor , which is inversely proportional to the compression. The selected quality factors were . Similarly, for the JPEG2000 attack, a range of different bit rates consisting of 0.25, 0.5, 1, and 2 bits per pixels (bpp) was monitored. After 300 trials for every image, every wavelet, every type of attack, and every strength of attack, the obtained values of constituted a statistical sample used to derive the sought empirical pdfs.
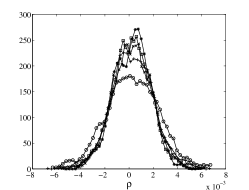
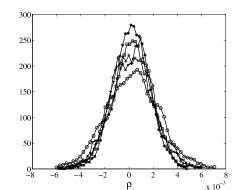
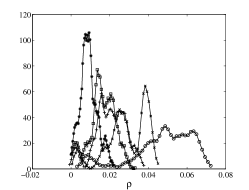
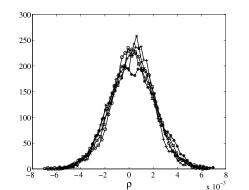
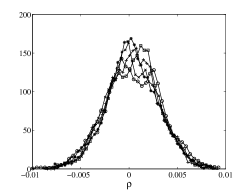
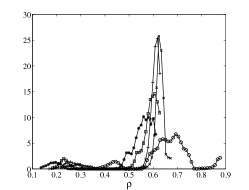
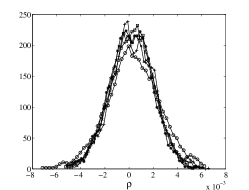
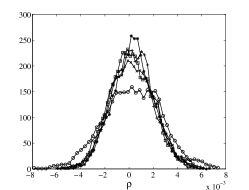
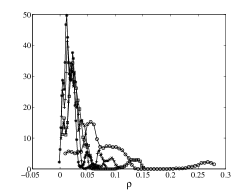
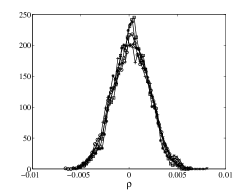
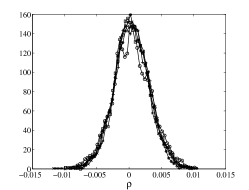
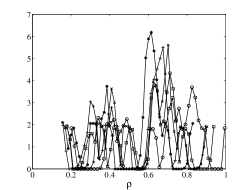
The empirical pdfs for the JPEG attack at and are respectively displayed in Figures 6 and 7. Analogously, Figures 8 and 9 show the empirical pdfs for the JPEG2000 attack at 0.25 bpp and 2 bpp. For conciseness, only the empirical pdfs associated to the extremes cases were depicted. Computational simulations reveal that the empirical pdfs for the intermediate degrees of attack are, in qualitative terms, proportionally situated in between the discussed extreme cases. Observe that, when an watermark mismatch occurred (Figures 6(a)-(b) and 7(a)-(b); and Figures 8(a)-(b) and 9(a)-(b)), the empirical pdfs possess a Gaussian-like shape, indicating a manifestation of the Central Limit Theorem. The Lilliefors test for normality was applied and Gaussianity hypothesis could not be rejected in all cases, except in the following few situations: (i) Daubechies-4 and biorthogonal 6/2 wavelets under JPEG attack at ; (ii) Coiflet-6 wavelet under JPEG attack at , and (iii) Daubechies-2 and GRS4 wavelets under JPEG2000 attack at 2 bpp. Nevertheless, even for these cases, the empirical pdfs resemble Gaussian pdfs, indicating an eventual convergence to normality, if sufficiently many trials were performed.
| Quality Factor | |||||
|---|---|---|---|---|---|
| Wavelet | 10 | 30 | 50 | 70 | 90 |
| Daubechies-4 | 0.02760.0108 | 0.09520.0272 | 0.16040.0503 | 0.25290.0666 | 0.59010.0956 |
| Daubechies-8 | 0.01930.0082 | 0.07460.0233 | 0.13220.0393 | 0.23420.0556 | 0.57140.0997 |
| Coiflet-6 | 0.00870.0045 | 0.03810.0155 | 0.07630.0271 | 0.14910.0432 | 0.52030.1095 |
| Biorthogonal 6/2 | 0.01540.0066 | 0.05880.0210 | 0.10950.0345 | 0.19930.0533 | 0.55310.1037 |
| GRS4 | 0.04580.0161 | 0.13950.0460 | 0.22890.0775 | 0.33790.1036 | 0.65370.0994 |
| Bit Rate (bpp) | ||||
|---|---|---|---|---|
| Wavelet | 0.25 | 0.5 | 1.0 | 2.0 |
| Daubechies-4 | 0.02750.0210 | 0.08170.0682 | 0.22120.1328 | 0.55590.2004 |
| Daubechies-8 | 0.02070.0168 | 0.06370.0473 | 0.19200.1263 | 0.52610.2145 |
| Coiflet-6 | 0.01670.0124 | 0.05370.0370 | 0.16490.0940 | 0.48700.2002 |
| Biorthogonal 6/2 | 0.03110.0321 | 0.09020.0785 | 0.23840.1470 | 0.55740.2159 |
| GRS4 | 0.07460.0618 | 0.15970.1240 | 0.32590.1918 | 0.64170.2251 |
Tables 2 and 3 show — for the JPEG and JPEG2000 attack, respectively — the average and the standard deviation of correlation coefficients. Regardless the conditions, the empirical pdfs related to the non-regular wavelet GRS4 are in the rightmost locations as they exhibit greater averages.
The GRS4 filter offers the highest correlation coefficients in all scenarios, being followed by the Daubechies-4 wavelet in the JPEG case and by the biorthogonal 6/2 in the JPEG2000. The GRS4 filter leads to the highest correlation coefficients because watermarked messages using the GRS4 wavelet domain are more immune to compression due the energy spreading property in the transform domain. Effectively, the watermark is inserted simultaneously in low and high frequency subbands. Therefore, having in mind the most severe attacks discussed above, it is accepted that under less severe attacks the detection performance would be enhanced. Then further analysis focuses mainly the worst case scenario.
Subsequently, the NP criterion was suitably adjusted to handle empirical pdfs instead of analytically expressed pdfs. Moreover, numerical integration techniques were employed to solve Equation 6 for the threshold [29]. Selecting a probability of false alarm , the Neyman-Pearson approach furnished the values of shown in Table 4.
| JPEG @ | JPEG2000 @ 0.25 bpp | |
|---|---|---|
| 0.340374 | 1.191534 |
5 Results and Discussion
To assess the detection performance of the watermarking scheme based on the GRS4 wavelet, the probability of detection and the probability of false alarm needed to be calculated. By simulating the algorithm a number of times, the relative frequency of detection and false alarm can be used as estimators for the sought probabilities.
For simulation purposes, only the worst case scenario were taken in consideration, namely JPEG compression for and JPEG2000 compression at 0.25 bpp. Additionally, we considered an entirely new set of eight images from the USC SIPI database. Otherwise, the use of previously examined images would introduce bias to the results. This set of images were submitted to the proposed watermarking scheme with the GRS4 wavelet for 8000 trials. Table 5 shows the obtained relative frequencies.
| Attack | ||
|---|---|---|
| JPEG @ | 0.9580 | 0.0089 |
| JPEG2000 @ 0.25 bpp | 1.0000 | 0.0020 |
We argue that the high frequency subbands of regular filters are less resistant to compression because compression algorithms such as JPEG and JPEG2000 behave as lowpass filters. As a result, watermark messages that are added to the high frequency subbands are likely be filtered out by compression. On the other hand, the subbands of non-regular transforms contain all frequency components.
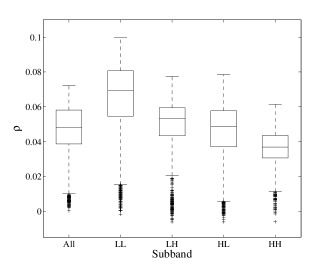
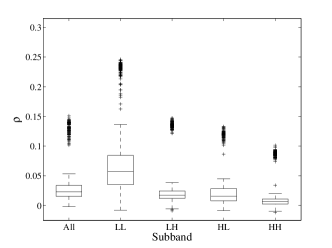
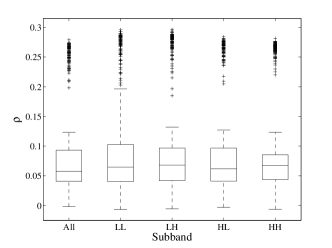
To emphasize this point, the correlation coefficient was computed separately for each subband, considering regular and non-regular wavelets. Again examining the worst case scenario, we compared, in the JPEG attack at , the results derived from the Daubechies-4 and the GRS4 wavelets. Analogously, for the JPEG2000 attack at 0.25 bpp, the biorthogonal wavelet was set against the GRS4 wavelet. These particular wavelets were elected because they granted the largest values of average in their respective empirical pdfs, as shown in Tables 2 and 3.
As a result, Figures 10 and 11 depict box and whisker plots of categorized by subband. Note that in all subbands the average value of for the non-regular wavelets is greater than the quantities offered by the regular wavelets. The correlation coefficients of the LL subbands are generally superior when compared with other subbands. This result is not surprising as most of the energy is concentrated in the LL subband. More than that, when non-regular wavelets are utilized, the variance of the average throughout the subbands are considerably lower when compared with the regular wavelets. This indicates that the information stored in the higher subbands is significant for watermarking detection when non-regular wavelet are employed. Computational evidence also demonstrates that the above discussed behavior remains valid for the other values of quality factor and bit rate considered in this work.

6 Conclusions
In this paper non-regular wavelet filters are shown to have useful properties for image watermarking. These filters provide energy spreading. As a result, at the same time image quality is high and the watermark is very robust to lossy operations furnished by the JPEG and JPEG2000 compression schemes.
References
- [1] Z. Ni, Y.-Q. Shi, N. Ansari, and W. Su, “Reversible data hiding,” IEEE Transactions on Circuits and Systems for Video Technology, vol. 16, no. 3, pp. 354–362, March 2006.
- [2] M. Engin, O. Çidam, and E. Z. Engin, “Wavelet transformation based watermarking technique for human electrocardiogram (ECG),” Journal of Medical Systems, vol. 29, no. 6, pp. 589–594, Dec. 2005.
- [3] G. Coatrieux, L. Lecornu, B. Sankur, and C. Roux, “A review of image watermarking applications in healthcare,” in Proceedings of the 28th Annual International Conference of the IEEE Engineering in Medicine and Biology Society, 2006, pp. 4691–4694.
- [4] J. Jiang and A. Armstrong, “Data hiding approach for efficient image indexing,” Electronics Letters, vol. 38, pp. 1424–1425, Nov. 2002.
- [5] J. Cannons and P. Moulin, “Design and statistical analysis of a hash-aided image watermarking system,” IEEE Transactions on Image Processing, vol. 13, no. 10, pp. 1393–1408, Oct. 2004.
- [6] L. Ming, L. Yun, Z. Xiang, L. Jian, and Y. Yonghong, “Authentication and quality monitoring based on audio watermark for analog AM shortwave broadcasting,” in Proceedings Third International Conference on Intelligent Information Hiding and Multimedia Signal Processing, vol. 2, Nov. 2007, pp. 263–266.
- [7] H. Lu, R. Shen, and F.-L. Chung, “Fragile watermarking scheme for image authentication,” Electronics Letters, vol. 39, no. 12, pp. 898–900, Jun. 2003.
- [8] C. Rey and J.-L. Dugelay, “A survey of watermarking algorithms for image authentication,” EURASIP Journal on Applied Signal Processing, vol. 6, pp. 613–621, 2002.
- [9] R. Schyndel, A. Tirkel, N. Mee, and C. Osborne, “A digital watermark,” in Proceedings of the IEEE International Conference on Image Processing, vol. 2, Austin, TX, Nov. 1994, pp. 86–90.
- [10] U. Fiebig and M. Schnell, “Correlation properties of -sequences,” Electronics Letters, vol. 29, no. 20, pp. 1753–1755, Sep. 1993.
- [11] S.-C. Pei and J.-M. Guo, “Hybrid pixel-based data hiding and block-based watermarking for error-diffused halftone images,” IEEE Transactions on Circuits and Systems for Video Technology, vol. 13, no. 8, pp. 867–884, Aug. 2003.
- [12] D. P. Mukherjee, S. Maitra, and S. T. Acton, “Spatial domain digital watermarking of multimedia objects for buyer authentication,” IEEE Transactions on Multimedia, vol. 6, no. 1, pp. 1–15, Feb. 2004.
- [13] B. Furht and D. Kirovski, Eds., Multimedia Watermarking Techniques and Applications. CRC Press, 2006.
- [14] V. M. Potdar, S. Han, and E. Chang, “A survey of digital image watermarking techniques,” Proceedings of the 3rd IEEE International Conference on Industrial Informatics, pp. 709–716, Aug. 2005.
- [15] P. Meerwald and A. Uhl, “A survey of wavelet-domain watermarking algorithms,” in Proceedings of the SPIE, Electronic Imaging, Security and Watermarking of Multimedia Contents III, vol. 4314, San Jose, CA, Jan. 2001, pp. 518–526.
- [16] G. C. Langelaar, I. Setyawan, and R. L. Lagendijk, “Watermarking digital image and video data: State-of-the-art overview,” IEEE Signal Processing Magazine, vol. 17, no. 5, pp. 20–46, Sep. 2000.
- [17] G. Strang and T. Nguyen, Wavelets and Filter Banks. Wellesley-Cambridge Press, 1996.
- [18] I. Daubechies, Ten Lectures on Wavelets (CBMS - NSF Regional Conference Series in Applied Mathematics). SIAM, Dec. 1992.
- [19] M. Golay, “Complementary series,” IEEE Transactions on Information Theory, vol. 7, no. 2, pp. 82–87, 1961.
- [20] G. W. Wornell, “Emerging applications of multirate signal processing and wavelets in digital communications,” Proceedings of the IEEE, vol. 84, no. 4, pp. 586–603, Apr. 1996.
- [21] J. Lin, “Divergence measures based on the Shannon entropy,” IEEE Transactions on Information Theory, vol. 37, no. 1, pp. 145–151, Jan. 1991.
- [22] S. Eguchi and J. Copas, “Interpreting Kullback-Leibler divergence with the Neyman-Pearson lemma,” Journal of Multivariate Analysis, vol. 97, no. 9, pp. 2034–2040, Oct. 2006.
- [23] S. . I. P. Institute, “The USC-SIPI image database,” http://sipi.usc.edu/database/, Feb. 2008.
- [24] N. Jayant, J. Johnston, and R. Safranek, “Signal compression based on models of human perception,” Proceedings of the IEEE, vol. 81, no. 10, pp. 1385–1422, Oct. 1993.
- [25] Z. Wang and A. Bovik, “A universal image quality index,” IEEE Signal Processing Letters, vol. 9, no. 3, pp. 81–84, 2002.
- [26] S. M. Kay, Fundamentals of Statistical Signal Processing: Detection Theory, ser. Signal Processing Series, A. V. Oppenheim, Ed. Prentice Hall, 1998.
- [27] R. O. Duda, P. E. Hart, and D. G. Stork, Pattern Classification. Wiley-Interscience, 2001.
- [28] K. Hinkelmann and O. Kempthorne, Design and Analysis of Experiments, Introduction to Experimental Design. Wiley-Interscience, 2007.
- [29] R. W. Hamming, Numerical Methods for Scientists and Engineers. Dover, 1986.