An Ordered Bipolar Outflow from a Massive Early-Stage Core
Abstract
We present ALMA follow-up observations of two massive, early-stage core candidates, C1-N & C1-S, in Infrared Dark Cloud (IRDC) G028.37+00.07, which were previously identified by their (3-2) emission and show high levels of deuteration of this species. The cores are also dark at far infrared wavelengths up to . We detect 12CO(2-1) from a narrow, highly-collimated bipolar outflow that is being launched from near the center of the C1-S core, which is also the location of the peak mm dust continuum emission. This protostar, C1-Sa, has associated dense gas traced by (2-1) and DCN(3-2), from which we estimate it has a radial velocity that is near the center of the range exhibited by the C1-S massive core. A second outflow-driving source is also detected within the projected boundary of C1-S, but appears to be at a different radial velocity. After considering properties of the outflows, we conclude C1-Sa is a promising candidate for an early-stage massive protostar and as such it shows that these early phases of massive star formation can involve highly ordered outflow, and thus accretion, processes, similar to models developed to explain low-mass protostars.
Subject headings:
stars: formation – ISM: clouds; jets and outflows1. Introduction
Understanding how massive stars form is an important goal, since their radiative, mechanical and chemical feedback play leading roles in regulating the interstellar medium, star formation activity and overall evolution of galaxies. Core Accretion (e.g., McKee & Tan 2003, hereafter MT03) is one class of models for massive star formation, which involve initial conditions of a high-mass, self-gravitating starless core, followed by relatively ordered collapse to a central disk and protostar (see Tan et al. 2014 for a review). These models are scaled-up from those developed for low-mass star formation (e.g., Shu et al. 1987), but, in the case of the MT03 Turbulent Core Model, involve nonthermal forms of pressure support, i.e., turbulence and magnetic fields, for the initial core to be in approximate pressure and virial equilibrium.
Alternatively, Competitive Accretion models (e.g., Bonnell et al. 2001; Wang et al. 2010) involve a massive star gaining most of its mass by competitive, chaotic Bondi-Hoyle accretion in the center of a crowded protocluster of mostly low-mass stars. In these models, the initial conditions of massive star formation, i.e., the gas immediately surrounding the protostar that is destined to become a high-mass star, do not involve massive starless, self-gravitating cores, but rather low-mass cores, with most of the mass reservoir joining later from the protocluster clump.
To try and distinguish between these theories we have developed a method for searching for massive starless and early-stage core candidates. We first identify target regions in IRDCs using mid-infrared, i.e., Spitzer-IRAC, extinction (MIREX) mapping (Butler & Tan 2009; 2012). We select regions that are peaks in the resulting mass surface density, , map. We further check that these regions are dark in (Spitzer-MIPS) and (Herschel-PACS) images. We then search for (3-2) emission with ALMA, since the abundance of this species, i.e., the deuteration fraction is known to rise in cold (K), dense () conditions, especially when CO molecules are largely frozen-out onto dust grain ice mantles and the ortho-to-para ratio of drops to low values (e.g., Kong et al. 2015a). is known to be a good tracer of low-mass starless cores that are on the verge of collapse, i.e., pre-stellar cores (Caselli & Ceccarelli 2012), as well as early stage low-mass Class 0 sources (Emprechtinger et al. 2009).
We carried out a pilot search of 4 IRDC regions () with ALMA in Cycle 0 (compact configuration, 2.3″ resolution), identifying (3-2) cores (Tan et al. 2013, hereafter T13) by projection of their space (3-2) contours. The two most massive cores were in IRDC G028.37+00.07 (hereafter Cloud C) C1 region: we refer to these as C1 North and South (C1-N, C1-S). We estimated masses in two ways: (1) from the MIREX map, finding C1-N has and C1-S has with 50% systematic uncertainty due to distance (kpc) and dust opacity () uncertainties; (2) from mm dust continuum emission, finding C1-N has and C1-S has , with uncertainties mostly due to the adopted dust temperature of K, together with distance and dust emissivity uncertainties.
These ALMA observations resolve the cores with about three beam diameters. C1-S appears quite round, centrally-concentrated and monolithic, while C1-N shows evidence of multiple fragments. Given their high level of deuteration (Kong et al. 2016) and their dark appearance in Herschel-PACS images, even at wavelengths as long as , C1-S, and perhaps also C1-N, are amongst the best known candidates of massive starless or early-stage cores.
However, we note Wang et al. (2006) reported a water maser detection in this area (just outside C1-S’s lowest (3-2) contour), though at a different velocity () and in single channel (wide). This water maser was not detected in the more sensitive observations of Chambers et al. (2009) and Wang et al. (2012). We also note that Pon et al. (2015) have detected CO(8-7) and (9-8) emission towards C1-N & S with Herschel-HIFI ( resolution) and argue that this emission results from turbulence dissipating in low velocity shocks, which could be either driven by large-scale turbulent motions from the surrounding cloud or from protostellar outflow activity.
2. Observations
We use data from our ALMA Cycle 2 project (2013.1.00248.S, PI:Tan), which observed the C1 region in a compact configuration on 05-Apr-2015, yielding sensitivity to scales from to ). The position of the field center was R.A.=18:42:46.5856, Dec.=-04:04:12.361 (FK5 J2000 system) (). It was chosen to be between C1-N and C1-S, slightly closer to C1-S. Thus both cores are within the 27″ field of view.
The spectral set-up included a continuum band centered at GHz with width GHz, i.e., from GHz to GHz. The achieved sensitivity was mJy per beam. In this continuum band, each channel has width MHz, i.e., velocity resolution . The 12CO(2-1) line frequency is GHz. C1-S’s radial velocity from its (3-2) emission is with 1D dispersion of (i.e., FWHM), so the sky frequency of 12CO(2-1) from this source is GHz. Thus we are sensitive to the presence of 12CO(2-1) emission with moderate velocity resolution. Note, ambient CO molecules in the core and even the wider scale IRDC are expected to be largely frozen-out onto dust grain ice mantles (Hernandez et al. 2011). However, 12CO(2-1) emission near ambient velocities is still likely to be very optically thick from this region. In our data the 9 channels closest to the expected ambient velocity of C1-S have velocities centered at: .
The other basebands were tuned to observe (3-2), (2-1), DCN(3-2), DCO+(3-2), SiO(v=1)(5-4) and . These data will be presented and analyzed in full in a future paper, while in this Letter we focus mostly on the results of the broad continuum band and its 12CO(2-1) line, along with some results from (2-1) and DCN(3-2) that help probe denser gas of protostellar cores.
3. Results
| Name | (∘) | (∘) | (mJy) | () | P.A.(∘) |
|---|---|---|---|---|---|
| C1-N | 28.32503 | 0.06724 | aa of C1-N and C1-S estimated from (3-2) (T13). of protostars estimated from strongest (2-1) peak, but see also notes below for individual sources. | … | |
| C1-S | 28.32190 | 0.06745 | aa of C1-N and C1-S estimated from (3-2) (T13). of protostars estimated from strongest (2-1) peak, but see also notes below for individual sources. | … | |
| C1-Sa | 28.322093 | 0.067698664 | bb C1-Sa: estimated from strongest (2-1) peak. Secondary peaks at , , while DCN(3-2) has single peak at . | 155 | |
| C1-Sb | 28.321752 | 0.066847223 | cc C1-Sb: estimated from strongest (2-1) peak. Secondary peak at . DCN(3-2) is too weak to measure . | 113 | |
| C1a | 28.324765 | 0.069543149 | ddC1a: tentatively estimated from weak (3-2) emission (T13). | 150 | |
| C1b | 28.323272 | 0.069987301 | … | 150 |
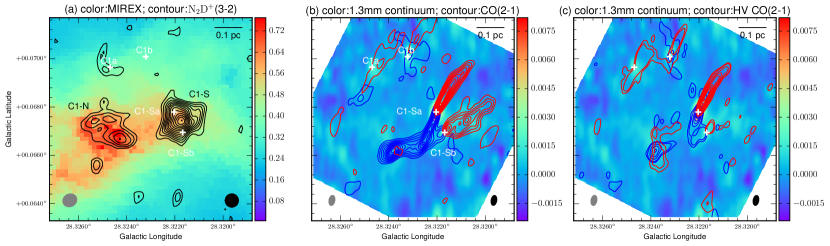
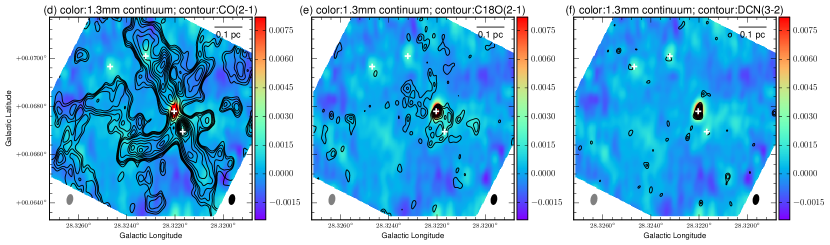
Figure 1a presents the MIREX map (Butler et al. 2014) of the C1 region, together with contours of (3-2) integrated intensity (T13), which define C1-S and C1-N. Also shown are locations of potential protostars defined by mm dust continuum peaks detected in the ALMA Cycle 2 image (Fig.b), which has been cleaned with natural weighting and had a primary beam correction applied. Figure 1b also shows integrated intensities of (continuum subtracted) 12CO(2-1) with red contours tracing , i.e., redshifted velocities up to with respect to C1-S’s central velocity, and blue contours tracing from , i.e., blueshifted velocities up to from C1-S. Figure 1c shows just high velocity outflow gas that is away from C1-S’s ambient velocity. Figure 1d shows the integrated intensity of “ambient” 12CO(2-1), i.e., from . Figures 1e and 1f show integrated intensities of (2-1) and DCN(3-2), respectively, both potentially helpful to identify dense gas associated with protostellar cores (e.g., Parise et al. 2009), and thus their radial velocities.
From these images we clearly identify two protostellar sources that are spatially overlapped with the C1-S core (Table 1). We refer to the more central source as C1-Sa and define its spatial position as the location of the mm continuum peak. This peak, with flux density mJy/beam, is 1.31″ from C1-S’s center as defined by (3-2) (T13). Recall that for an estimated (kinematic) source distance of kpc, 1″ corresponds to AU, i.e., pc, with 20% uncertainties. So the spatial location of C1-Sa is quite close to center of the C1-S core, which has a radius of 3.61″ (i.e., pc;AU).
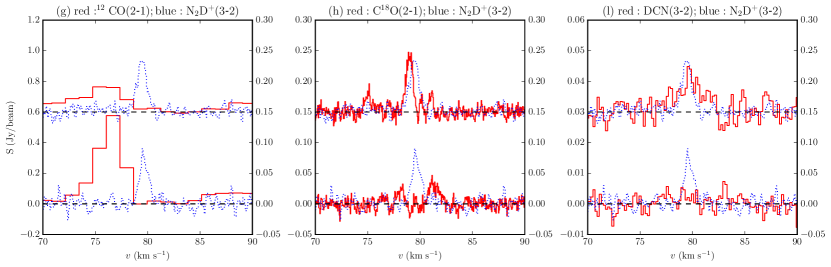
Figures 1g, 1h and 1i show the spectra of 12CO(2-1), (2-1) and DCN(3-2), also in comparison with the T13 observation of (3-2), towards the protostars. We estimate the radial velocity of the C1-Sa protostar from the (2-1) and DCN(3-2) spectra towards the continuum peak. The (2-1) spectrum shows a main peak at , while DCN(3-2) shows a single peak at . Thus it seems very likely that C1-Sa is forming inside the C1-S (3-2) core, which has mean velocity of and FWHM of .
The Galactic coordinate frame position angle of C1-Sa’s 12CO(2-1) outflow axis, which we define to the blueshifted axis, is . The outflow is highly-collimated and is seen to extend (AU,pc), and is quite symmetric, i.e., P.A. of the redshifted lobe is almost 180∘ greater than that of the blueshifted lobe. Also the observed extent of the outflow is similar in each direction, although the highest velocity flow is more extended on the redshifted side. The outflow can be traced down to 3 above the noise level, without bunching of the contours, so we expect the observed extent is simply due to observational sensitivity and the actual extent could be much larger.
We re-checked our ALMA Cycle 0 data, which included a requested bandpass set to an intermediate frequency between DCN(3-2) and SiO(0)(5-4). However, this frequency was later mistakenly shifted to be closer to DCN(3-2) causing the SiO line center to be unobserved: only the potential blue wing up to was observed. For this reason, T13 did not report detection of any SiO emission towards C1-S. However, now we do see indications of the blue wing of SiO(0)(5-4) overlapping with the central part of the blue lobe of the 12CO(2-1) outflow and extending to . We conclude it is likely that the outflow from C1-Sa also emits strongly in SiO(0)(5-4) across its full velocity range.
The second source, C1-Sb, has a much weaker mm continuum flux of mJy/beam and is located 2.0″ from the center of the C1-S (3-2) core and 3.3″ from C1-Sa. The (2-1) spectrum towards C1-Sb shows a main peak at and a secondary peak (with about half the equivalent width) at . The DCN(3-2) spectrum shows no particularly strong features, although a 3 peak is seen in the integrated intensity map (Fig. 1f). We tentatively assign C1-Sb’s radial velocity to be that of the main (2-1) spectral feature. We discuss below that this assignment is potentially supported by examination of the channel maps of the 12CO(2-1) “ambient” gas. If this radial velocity is correct, then it would suggest that C1-Sb is not physically associated with the C1-S (3-2) core, and in fact may be part of a gas structure that is linked to the C1-N core. However, we cannot exclude the possibility that C1-Sb is also forming from the C1-S core.
The outflow from C1-Sb has a similar extent as that from C1-Sa and appears to have a wider opening angle. It has a P.A.=113∘, and on its blueshifted side the outflow spatially overlaps with that from C1-Sa. Analysis of lower intensity contours (down to ) indicates a bunching close to the higher intensity contours. This may indicate that, unlike for C1-Sa, we are seeing the full extent of C1-Sb’s outflow.
In Figure 1b we identify two more candidate protostars that are away from the C1-S and C1-N cores. C1a is located in a region with faint (3-2) emission with radial velocity of . There is relatively faint 12CO(2-1) emission, which may be driven from this source with P.A.. There is no significant (2-1) emission associated with this source, and only a weak feature in the DCN(3-2) integrated intensity map. C1b is close to C1a and has a similar P.A. of its 12CO(2-1) emission of about . There is no significant (2-1) or (3-2) emission at C1b, and only a very weak feature in DCN(3-2). Note, the protostellar nature of C1a and C1b is uncertain, especially since some of the observed 12CO(2-1) features may be affected by side-lobe contamination from C1-Sa and C1-Sb.
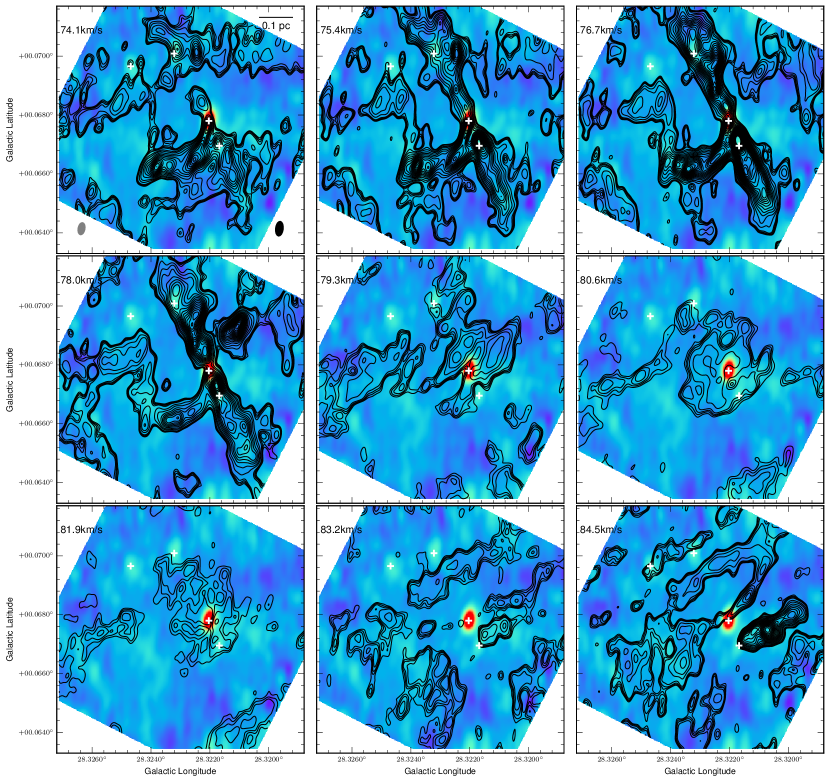
Figure 2 shows nine channel maps of “ambient” 12CO(2-1) emission from the C1 region, with high and low velocity ends connecting with the “outflow” velocities plotted in Fig. 1b. The C1-Sa outflow lobes are visible in the low and high velocity channels. Fig. 2 also suggests the C1-Sb outflow has a driving source with a , since the blueshifted lobe is already apparent in the channel, while the redshifted lobe appears to vanish by the channel.
There are several other striking features seen in Fig. 2. First, there is a very elongated “filament” that peaks in the 76.7 and channels, but is visible from . The filament overlaps with the C1-Sa, C1-Sb and C1b protostars and its orientation is almost perpendicular to their outflows. The interpretation of this filament as an ambient gas feature, rather than as a collimated bipolar outflow, is discussed below considering its position-velocity diagram. Second, there is a relatively weak, but still highly significant, quasi-spherical “core” of gas seen in the 80.6 and channels. Third, there is 12CO(2-1) emission in the vicinity of the C1-N (3-2) core. Fourth, there are additional emission features on the periphery of the image.
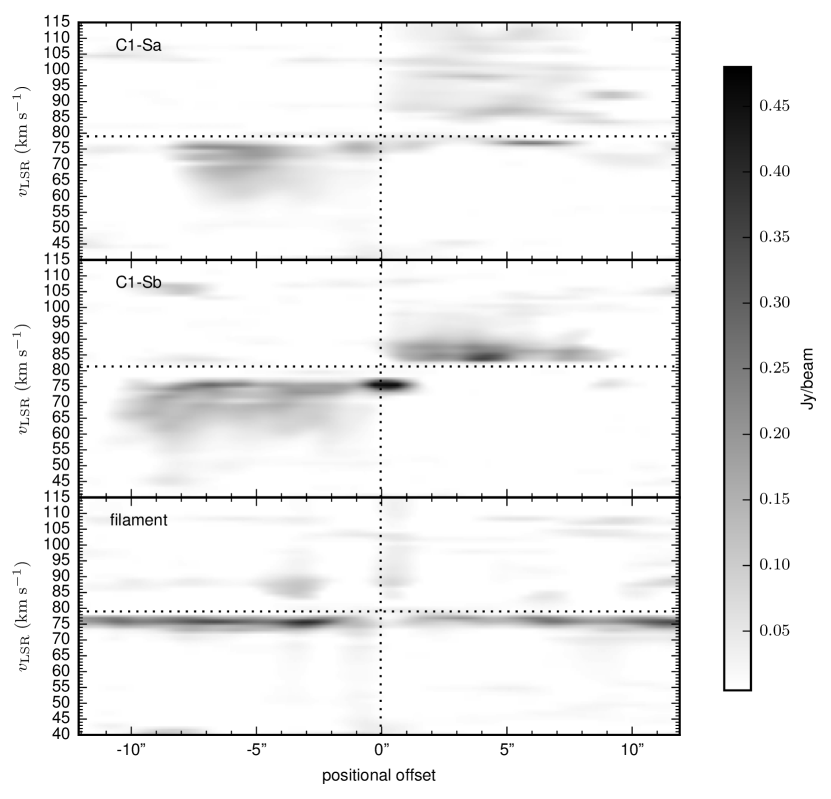
Figure 3 shows position-velocity diagrams of 12CO(2-1) emission along the outflow axes of C1-Sa and C1-Sb and along the axis of the “ambient filament.” These are defined by rectangular regions 3″ wide running length-wise along the P.A. of each outflow or the filament.
The ambient nature of the filament is readily apparent in these figures. It has a very narrow velocity dispersion, which is comparable to other ambient gas tracers, like (2-1) and (3-2), and does not show a significant gradient in radial velocity. The lack of such a gradient could be explained by an outflow that was precisely aligned in the plane of the sky, but this would still be expected to have a relatively broad velocity dispersion, which the filament feature does not exhibit.
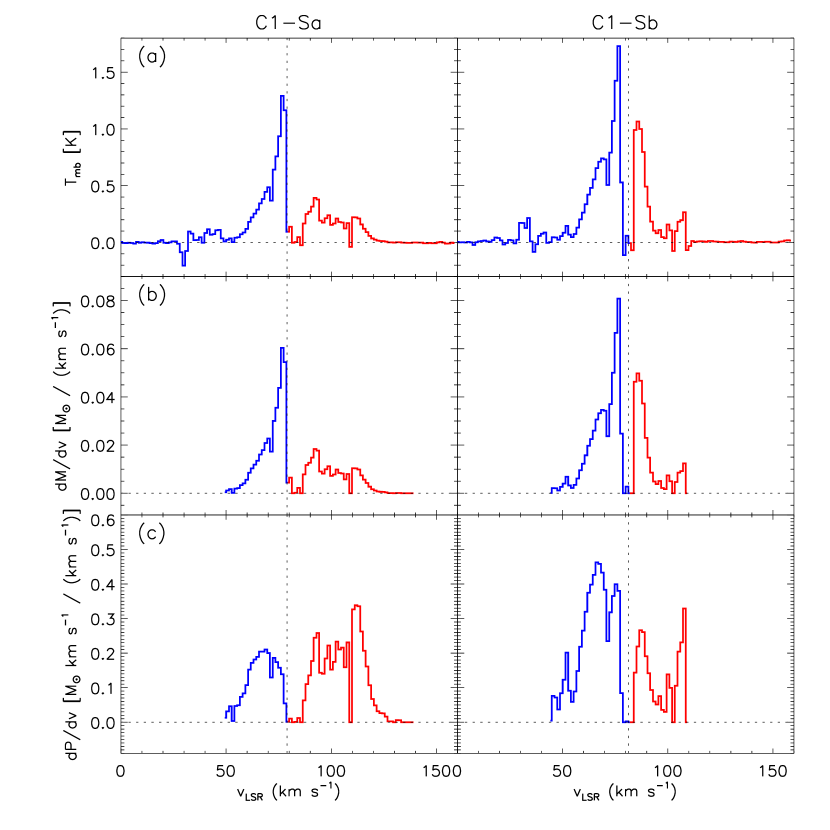
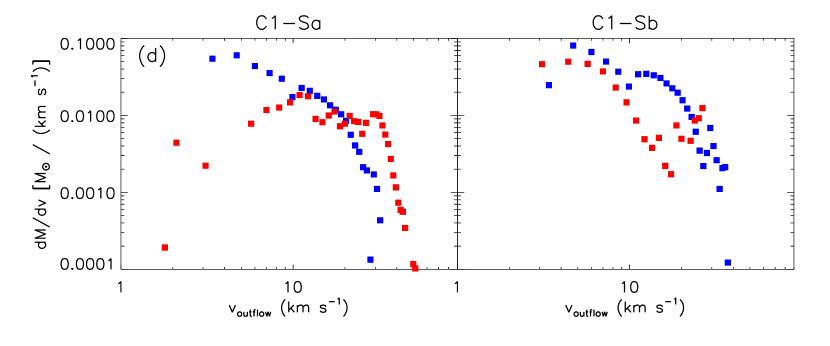
Figure 4 shows 12CO(2-1) spectra and derived mass and momentum distributions of the C1-Sa and C1-Sb outflows, extracted from the same regions used for Fig. 3. To derive the mass, one must assume an excitation temperature, with values of —K typically being used. K minimizes the mass estimate, while K increases this by a factor of 1.5.
For C1-Sa, integrating from and assuming K, the blue/red lobes have masses and momenta , respectively. Similarly, for C1-Sb, integrating from the blue/red lobes have masses and momenta , respectively. Note, the estimates for each blueshifted lobe are affected by the overlap of the sources, leading to modest overestimation of their properties, especially relative to the redshifted lobes. However, in general the absolute values of the above estimates should be viewed as lower limits, not only because of the choice of K, but also because of inclination effects (which boost momentum estimates by , where is the inclination of the outflow axis to the line of sight, with random expectation value of ), and because of optical depth effects (both within the outflowing gas, which may boost momentum by factors of 6 (Zhang et al. 2016), and due to foreground absorption).
For C1-Sa, the mass-weighted mean velocities () of the blue/red lobes are , while for C1-Sb they are . Assuming the length of all the outflows lobes are AU), the dynamical times for the blue/red lobes of C1-Sa are yr and for C1-Sb are yr. The correction factor for inclination is cos()/sin(), i.e., 0.58 for . The mass outflow rates for the C1-Sa blue/red lobes are , and for C1-Sb are . The correction factor for inclination is sin()/cos(), i.e., 1.73 for . Finally, the momentum injection rates for the C1-Sa blue/red lobes are and for the C1-Sb blue/red lobes are . The inclination correction factor is sin()/, i.e., 3.46 for . Allowing for a mass underestimation factor of 3 and assuming , the overall estimates of the total momentum fluxes are boosted by a factor of 10, i.e., totals for C1-Sa of and for C1-Sb of .
4. Discussion
Outflow momentum flux is expected to be the most reliable direct tracer of protostellar properties, since it should be independent of the effects of ambient environment (unlike mass flux, which depends mostly on the mass that has been swept-up by the primary outflow). Models of massive protostar formation (Zhang et al. 2014) based on the Turbulent Core Model (MT03) for cores of in a clump environment with (relevant for C1-S) predict , when the protostellar mass is , rising to by the time . It is interesting that these estimates are comparable with the observed values of from C1-Sa and C1-Sb. This suggests that, if C1-Sa is a massive protostar in the process of formation, that it is currently at a very early stage, i.e., has yet to accrete most of its mass. This would be broadly consistent with the protostar having a relatively low luminosity such that it does not appear yet as a MIR source. High angular resolution, high sensitivity MIR to FIR observations, e.g., with JWST, are needed to measure the SED of the protostar, which can then also constrain protostellar models. We conclude that we have detected protostars of relatively low current masses. C1-Sa appears to be embedded within the C1-S massive, cold core, as defined by (3-2) emission. It thus has a large mass reservoir from which to continue to grow: we speculate it is destined to become a massive star.
As traced by 12CO(2-1), C1-Sa’s bipolar outflow is highly collimated and has velocities extending to . Similar (blueshifted) velocities are seen in SiO(=0)(5-4) emission. Using mass-weighted mean velocities, which are , the inclination-corrected outflow timescale is yr. However, since C1-Sa’s outflow is likely to extend to larger distances than we observe, this is probably a lower limit on the duration of protostellar activity. Given the symmetric and linear morphology of the outflow lobes, it appears that C1-Sa (and C1-Sb) have not suffered significant dynamical disturbance from other nearby (proto)stars during the period they have been driving these outflows. This is consistent with assumptions of Core Accretion models and is a constraint on Competitive Accretion models.
For constant instantaneous star formation efficiency from the core, , the fiducial Turbulent Core Model predicts , where the total star formation time is yr. So for the and case, then yr implies (assuming , expected during early stages when outflow cavity opening angles are small) and .
We conclude that C1-Sa is a good candidate for an early-stage massive protostar and as such it shows that these early phases of massive star formation can involve highly ordered outflow, and thus accretion, processes (see also Zhang et al. 2015). The massive C1-S core is potentially also forming a second protostar, C1-Sb: improved estimates of its radial velocity is needed to clarify its association with this core. The results presented complement work that has shown collimated outflows can be launched from later-stage, more luminous massive protostars (e.g., Beuther et al. 2002). They also illustrate that there are similarities between high-mass protostars and their lower-mass cousins forming from lower-mass cores.
References
- Beuther et al. (2002) Beuther H., Schilke P. et al. 2002, A&A, 383, 892
- Bonnell et al. (2001) Bonnell, I. A., Bate, M. R., Clarke, C. J., & Pringle, J. E. 2001, MNRAS, 323, 785
- Butler & Tan (2009) Butler, M. J., & Tan, J. C. 2009, ApJ, 696, 484
- Butler & Tan (2012) Butler, M. J., & Tan, J. C. 2012, ApJ, 754, 5
- Butler et al. (2014) Butler, M. J., Tan, J. C., & Kainulainen, J. 2014, ApJ, 782, 30
- Caselli & Ceccarelli (2012) Caselli, P. & Ceccarelli, C. 2012, A&ARv, 20, 56
- Chambers et al. (2009) Chambers, E. T., Jackson, J. M., Rathborne, J. M., & Simon, R. 2009, ApJS, 181, 360
- Emprechtinger et al. (2009) Emprechtinger, M., Caselli, P., Volgenau, N. H., Stutzki, J., & Wiedner, M. C. 2009, A&A, 493, 89
- Girart et al. (2009) Girart, J. M., Beltrán, M. T., Zhang, Q., Rao, R., & Estalella, R. 2009, Science, 324, 1408
- Hernandez et al. (2011) Hernandez, A. K., Tan, J. C., Caselli, P., et al. 2011, ApJ, 738, 11
- Kong et al. (2015) Kong, S., Caselli, P., Tan, J. C., Wakelam, V., & Sipilä, O. 2015, ApJ, 804, 98
- Kong et al. (2016) Kong, S., Tan, J. C., Caselli, P., Fontani, F., Pillai, T., Butler, M. J., Shimajiri, Y., Nakamura, F. & Sakai, T. 2016, ApJ, submitted (arXiv:1509.08684)
- McKee & Tan (2003) McKee, C. F., & Tan, J. C. 2003, ApJ, 585, 850 [MT03]
- Parise et al. (2009) Parise, B., Leurini, S., Schilke, P. et al. 2009, A&A, 508, 737
- Pillai et al. (2015) Pillai, T., Kauffmann, J., Tan, J. C., et al. 2015, ApJ, 799, 74
- Pon et al. (2015) Pon, A., Caselli, P., Johnstone, D., et al. 2015, A&A, 577, A75
- Shu et al. (1987) Shu, F. H., Adams, F. C., & Lizano, S. 1987, ARA&A, 25, 23
- Tan et al. (2013) Tan, J. C., Kong, S., Butler, M. J., Caselli, P., & Fontani, F. 2013, ApJ, 779, 96 [T13]
- Tan et al. (2014) Tan, J. C., Beltrán, M. T., Caselli, P., et al. 2014, Protostars and Planets VI, 149
- Wang et al. (2010) Wang, P., Li, Z.-Y., Abel, T., & Nakamura, F. 2010, ApJ, 709, 27
- Wang et al. (2012) Wang, K., Zhang, Q., Wu, Y., Li, H.-B., & Zhang, H. 2012, ApJ, 745, L30
- Wang et al. (2006) Wang, Y., Zhang, Q., Rathborne, J. M., Jackson, J., & Wu, Y. 2006, ApJ, 651, L125
- Zhang et al. (2015) Zhang, Q., Wang, K., Lu, X., & Jiménez-Serra, I. 2015, ApJ, 804, 141
- Zhang et al. (2014) Zhang, Y., Tan, J. C. & Hosokawa, T. 2014, ApJ, 788, 166
- Zhang et al. (2016) Zhang, Y., Arce, H., Mardones, D. et al. 2016, ApJ, submitted (arXiv:1602.02388)