Suppression of neuronal phase synchronisation in cat cerebral cortex
Abstract
We have studied effects of perturbations on the cat cerebral cortex. According to the literature, this cortex structure can be described by a clustered network. This way, we construct a clustered network with the same number of areas as in the cat matrix, where each area is described as a sub-network with small-world property. We focus on the suppression of neuronal phase synchronisation considering different kinds of perturbations. Among the various controlling interventions, we choose three methods: delayed feedback control, external time-periodic driving, and activation of selected neurons. We simulate these interventions to provide a procedure to suppress undesired and pathological abnormal rhythms that can be associated with many forms of synchronisation. In our simulations, we have verified that the efficiency of synchronisation suppression by delayed feedback control is higher than external time-periodic driving and activation of selected neurons for the cat cerebral cortex with the same coupling strengths.
The cat corticocortical network is organised into visual, auditory, somatosensory-motor, and frontolimbic regions, and can be separated into 65 cortical areas. The areas connected by fibres of different densities that can be described through a connection matrix. In this work, we use the cat matrix considering that each area corresponds to a small-world sub-network. We build a clustered network where the local connections in the small-world sub-network are given by electrical synapses, while the shortcuts and the connections among the areas are described by chemical synapses. By means of this clustered network, we study the suppression of neuronal phase synchronisation. Synchronisation might be behind the way we perceive objects, but it is also responsible for abnormal behaviour. Clinical evidences pointed out that synchronisation of a small group of neurons plays a key role in some pathological conditions like Parkinson’s disease, tremor, and epilepsy. For this reason, the study of control of undesirable neuronal rhythms is relevant to restore normal spiking activity in a neuronal network. We focus on three methods of intervention: delayed feedback control, external time-periodic driving, and activation of selected neurons. Methods of intervention have importance for the treatment of severe neurological and psychiatric diseases. We have observed that neuronal phase synchronisation can be suppressed by means of these methods. Morever, with regard to suppression, we have also verified that delayed feedback control has a better efficiency than external time-periodic driving and activation of selected neurons. Feedback control is a method that has been implemented in clinical applications.
I Introduction
The cerebral cortex is an important part of the mammalian brain, and it is the outer covering of gray matter over the brain´s hemispheres. It is responsible for cognitive tasks like emotion, complex thought, memory, language comprehension, and consciousness buzsaki06 . In the literature, it is possible to find information about the structure of the cerebral cortex network for the macaque monkey lund93 , C. elegans izquierdo13 , the cat scannel95 , etc. The cat cerebral cortex connectivity data was first published by Scannell and Young scannel93 . The cat corticocortical network can be separated into 65 areas, and the areas are connected by fibres of different densities that can be described thought a connection matrix. The areas are separated into four clusters or cognitive regions named as visual, auditory, somatosensory-motor, and frontolimbic.
We have studied a model of neuronal network that contains a connectivity configuration in accordance with the cat matrix gardenes10 . The clusters formed by cortical areas with common functional roles are responsible for the complexity of the cat network hilgetag00 ; zhou06 ; zemanova06 . With this in mind, we consider that each element of the matrix has a sub-network with small-world property watts98 . Small-world network is clustered like regular networks wich has a path length comparable to random networks. The short path length is due to the existence of long-range connections. Stam and collaborators stam07 presented studies about the presence of small-world characteristics in functional brain networks, as well as they also presented that Alzheimer’s disease is characterised by a loss of small-world property. Epilepsy in small-world network was investigated by Netoff and collaborators netoff04 . They modelled activity in hippocampal slices considering small-world networks of excitatory neurons that reproduce bursts and seizures.
In recent years, mathematical models to describe neuronal networks have been studied very intensively. Neuronal mathematical models can take many forms, e.g. differential equations such as the Hodgkin-Huxley model hodgkin52 and Hindmarsh-Rose model hindmarsh82 , as well as models with discrete time as the Rulkov map rulkov01 . In this work, we consider a coupled Rulkov map network that presents not only discrete time, but also discrete space. The Rulkov map presents two different time scales, where the variable with slow dynamics is responsable for the modulation of bursts in the fast variable dhamala04 . Networks of coupled Rulkov maps have been used in studies about neuronal phase synchronisation batista12 ; lameu16 , suppression of bursting synchronisation lameu12 , and pattern formation wang07 .
Neuronal synchronisation can be found in neuronal activities due to coupling among neurons or by means of common inputs. Studies have demonstrated the importance of synchronisation of oscillatory phases between different brain regions in memory processes fell11 . Roelfsema et al. roelfsema97 realised studies recording local field potentials from electrodes implanted in the cortex of cats. They verified large-scale synchronisation when cats were submitted to a sudden change of a visual pattern. Synchronisation in ensembles was also studied by Ivanchenko et al. ivanchenko04 , who observed a second-order phase transition to synchronisation. Axmacher et al. axmacher06 verified that specific forms of cellular plasticity during subsequent stages of memory formation are induced by synchronisation. Nevertheless, there are evidences that certain brain disorders are related to neuronal synchronisation, e.g. epilepsy that results from high and extended synchronisation uhlhaas06 . Moreover, synchronisation of neuronal activity is a common finding in patients with Parkinson’s disease chen07 . Levy et al. levy00 demonstrated that Parkinsonian patients present synchronised high-frequency activity in the subthalamic nucleus.
In face of neuronal synchrony in brain disorders, we study here three methods to suppress undesired synchronisation: delayed feedback control, external time-periodic driving, and activation of selected neurons. The delayed feedback control was proposed by Rosenblum and Pikowsky rosenblum2004 to suppress synchronised pathological brain rhythms through delayed feedback signal batista10 . Batista et al. batista13 observed that feedback control in networks of Hodgkin-Huxley-type neurons with chemical synapses can present more energy saving when compared to other suppression methods. Feedback control is a method that has been implemented in clinical applications by means of functional magnetic resonance imaging based neurofeedback linden12 . With regard to external time-periodic driving, it was verified that electrical stimulation of deep brain structures can reduce or completely suppresses seizures lesser03 . In addition, the method about activation of selected neurons was used by Han and Boyden han07 . They used light pulses on genetically targeted neurons not only for activation, but also for inhibition of neuronal activity.
All in all, we consider a clustered network that is composed by the matrix of corticocortical connections in the cat with small-world sub-networks using as local dynamics a two-dimensional map to describe the neuronal activity. We build small-world sub-networks according to the procedure proposed by Newman and Watts newman99 , who inserted randomly chosen shortcuts in a regular network. With the objective of finding an effective way of suppression of neuronal synchronisation, we study 3 methods: external time-periodic signal, neuron control with light, and time-delayed feedback signal. One of our main numerical results is to show that the time-delayed feedback signal is more effective than the control with light and feedback signal in the cat cerebral cortex. We also verify that a perturbation in the frontolimbic region affects the other regions.
The paper is organised as follows: In Section 2, we present the mathematical model of the neuronal network. Section 3 shows the burst phase synchronisation. Section 4 exhibits our numerical results with the different methods of suppression of neuronal phase synchronisation. In the last Section, we draw our conclusions.
II Clustered network of Rulkov neurons
We consider, as neuronal model, the Rulkov map rulkov01 that reproduces neuronal bursting by means of two variables, and is given by
| (1) | |||||
| (2) |
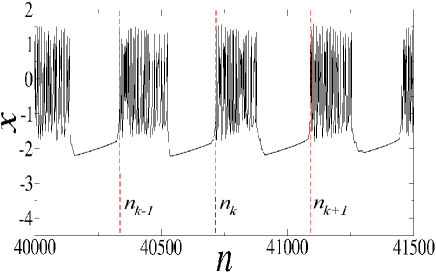
where is the fast dynamical variable, is the slow dynamical variable, controls the duration of bursts, and describe the slow time-scale. Figure 1 exhibits irregular sequence of bursts of the fast variable, where denotes when the neuronal bursting starts, and is an integer.
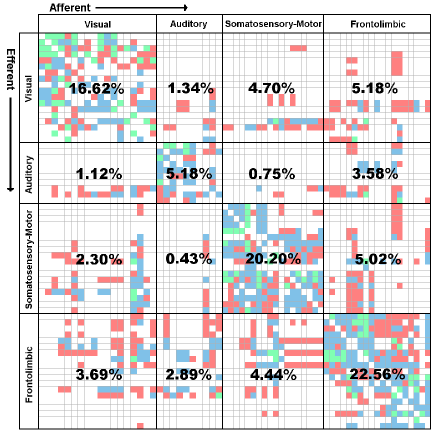
In accordance with the matrix, that describes the corticocortical connectivity of the cat brain, obtained by Scannel et al. scannel95 , we build a clustered neuronal network. Figure 2 shows the densities of connections by means of colours, where we can see white for no connections, sparse connections in red, intermediate connections in blue, and dense connections in green. Each one of the areas is modelled by a small-world network with neurons and of shortcuts. The cortical areas classified as sparse (red) have randomly directed connections. The intermediate connectivities (blue) and the dense connectivities (green) have and randomly directed connections, respectively.
The areas are separated into 4 cognitive regions: visual, auditory, somatosensory-motor, and frontolimbic. The visual region is composed of 18 cortical areas and the auditory of 10 areas, while the somatosensory-motor and the frontolimbic present 18 and 19 cortical areas, respectively. The values of percentages, in Figure 2, describe the amount of connections between regions in relation to the total connectivity in the matrix. For instance, inside the visual region there is of the total connectivity, and the percentage of connections to the visual region from the auditory region is equal to . The frontolimbic region has the largest amount of connections in the cat matrix.
In this work, the dynamics of the clustered network is based on the cat matrix and given by lameu16
| (3) | |||||
| (4) |
where denotes the neuron () in the cortical area (), and are the quantity of neurons in each small-world sub network and the number of cortical areas, respectively. The third term of the first equation corresponds to the electrical coupling with strength and the fourth term is the chemical coupling with strength . In the chemical coupling term, the chemical connection between one neuron () and other neuron () is given by the adjacency matrix . In addition, is the Heaviside step function, where is the presynaptic threshold for the chemical synapse, and is the reversal potential. In our simulations, we have considered that is randomly distributed in the interval , , , , for excitatory synapses, , for inhibitory, and 3 different methods for the perturbation . With regard to the synapses, we consider that the electrical synapses are the connections between the nearest neighbours into the small-world networks, while the chemical synapses are the shortcut connections into the small-world and connections between areas. We have also consider of excitatory and of inhibitory chemical synapses in all the network.
III Neuronal phase synchronisation
In this work, we calculate the neuronal phase by means of the time evolution within each burst, varying from 0 to as evolves from to (Fig. 1),
| (5) |
Through the phase we compute the Kuramoto’s order parameter to check the synchronous behaviour, that is given by
| (6) |
where and are the amplitude and the angle of a centroid phase vector, respectively. denotes the cognitive areas, with for visual, for auditory, for somatosensory-motor, and for frontolimbic. corresponds to the number of neurons of each area. The phase of the neurons , in the cortical area , is denoted by . The order parameter is equal to 1 for a completely synchronous behaviour and much less than 1 for uncorrelated phases.
The phase synchronisation as a function of the coupling strength can be analysed by means of the time average order parameter, given by
| (7) |
where is the time window for measurements.
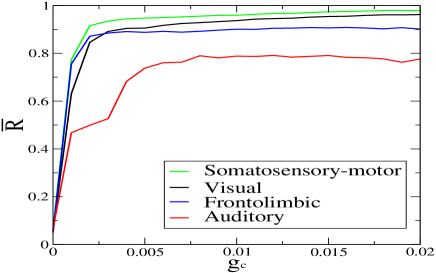
Figure 3 shows the time average order parameter as a function of the chemical coupling strength for each cortical region, where the value of the electrical coupling . We can see that the values of saturation of for the visual and the somatosensory-motor regions are larger than those of the auditory and frontolimbic regions. The auditory region presents a small percentage of intra connections, and due to this fact it is not possible to observe a strong synchronised state. Consequently, the time average order parameter saturates in a value smaller than . In addition, we also observe that all transitions are of second-order.
IV Suppression of neuronal phase synchronisation
The neuronal synchronisation can be associated with brain disorders, such as epilepsy and Parkinson’s disease. Due to this fact, we have studied methods of suppression of neuronal phase synchronisation. As diagnostic tool of suppression we use the suppression factor rosenblum04 , given by
| (8) |
where is the variance, and are the mean fields of the fast dynamical variable in the absence and presence of the control, respectively. The variance of is small when the synchronisation is suppressed, consequently the suppression factor is strongly increasing. Nevertheless, has a value approximately equal to one when the control is not efficient to suppress the synchronisation.
We have considered three methods of suppression that are found in literature: delayed feedback control, external time-periodic driving, and activation of selected neurons.
-
(i)
In the delayed feedback control, the last term in eq. (3) has the following form
(9) where represents the number of interations before, and the control is only applied in one of the four cognitive areas in neurons randomly chosen at each interation.
-
(ii)
With regard to external time-periodic driving, we consider
(10) where and are the amplitude and frequency of the perturbation, respectively. The time-periodic driving is also applied on the 100 neurons randomly chosen in the cognitive area.
-
(iii)
The third method is similar to light stimulation, in other words, the neuron receives a light pulse and goes to a state where it is forced to spike. In our simulations, randomly chosen neurons are activated () in a specific cognitive area when the perturbation is applied.
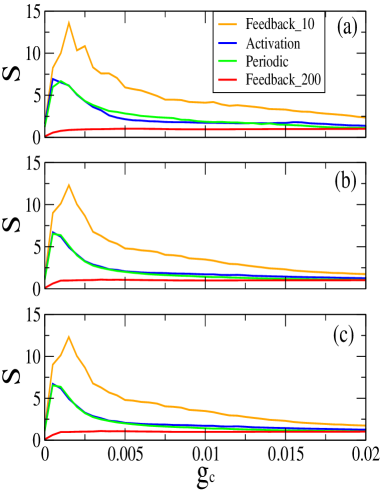
In Figure 4, the suppression factor is calculated for the controls applied on (a) the visual, (b) the auditory, and (c) the somatosensory-motor regions varying the chemical coupling strength. The feedback is represented by orange and red lines for equal to and iterations, respectively. The external time-periodic driving is denoted by green line, whereas the activation of selected neurons is represented by blue line. Our results show that the feedback control with equal to does not produce a suppression of the synchronisation. Conversely, for , for activation, and for time-periodic driving it is possible to observe a suppression with for a chemical coupling strength smaller than . The activation and the time-periodic driving have approximately the same behaviour of the suppression factor. We also verify that the feedback with presents the largest value of suppression factor. In addition, the other cognitive areas do not suffer a significant effect from these controlled areas (visual, auditory, and somatosensory-motor), in other words, the unperturbed areas remain in a synchronised state.
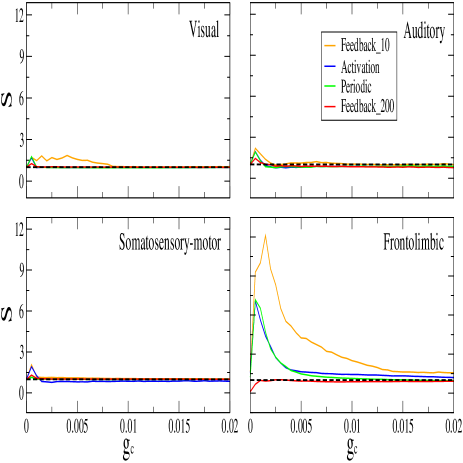
In the same way that the controls are applied on the visual, the auditory, and the somatosensory-motor, we apply on the frontolimbic area. Unlike the before cases, the uncontrolled cognitive areas presents a small influence from the suppression in the frontolimbic area. The suppression factor has its maximum value approximately equal to in a small range of the chemical coupling strength, as shown in Figure 5 for the visual, auditory, and somatosensory-motor areas. In the frontolimbic area, the values of the suppression factor have a behaviour similar to that obtained in Figure 4. In fact, the feedback with equal to presents the best efficiency compared with the activation, the time-periodic driving, and with equal to .
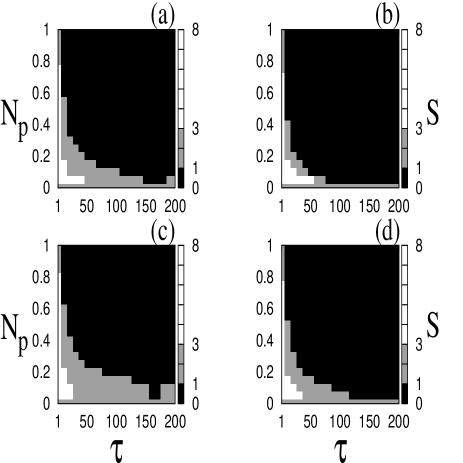
In view of our results from the delayed feedback control better than the activation and time-periodic driving, we analyse how the suppression factor is affected by the time delay and the percentage of perturbed neurons . In Figure 6 we can see the suppression factor in the bar for the number of perturbed neurons versus the time delay, where the delayed feedback is applied on (a) the visual, (b) the auditory, (c) the somatosensory-motor, and (d) the frontolimbic areas. The black regions correspond to the case in which the cognitive area does not present a suppression of synchronisation (), the grey regions exhibit a small suppression of synchronisation with the suppression factor in the interval , and the white regions show the values of and where the feedback delayed control is more efficient (). As a result, we verify that the method by means of feedback delayed control is efficient not only for different values, but also for small time delay.
The time evolution of the mean field for the black region in Figure 6 presents a large amplitude oscillations, as a result of the synchronised behaviour. Whereas, in the white region, where there is no evidence of synchronisation, the mean field has small amplitude oscillations. Oscillation quenching has been investigated in systems of coupled nonlinear oscillators koseska13 , that are classified in: oscillation (OD) and amplitude death (AD). In our simulations, we have verified that the 3 methods of suppression can induce to a mean field amplitude death (MFAD). This way, can be used as a disgnostic tool of MFAD.
V Conclusions
In this work, we studied suppression of burst phase synchronisation in a neuronal network with a structure according to the corticocortical connections of the cat brain. We have considered the cat matrix, where each cortical area has a sub-network with small-world properties.
Considering an initial configuration in that the neuronal network presents a synchronous behaviour, we have applied and compared three different suppression methods: delayed feedback control, external time-periodic driving, and activation of neurons. As a result, we verify that it is possible to obtain suppression by means of the three methods. The methods produce suppression only in the cortical areas where are applied, except when they are applied on the frontolimbic area. We observe a small suppression in the other areas when the perturbations are applied on the frontolimbic area. This occurs due to the fact that the frontolimbic area presents a larger external connectivity than the other areas.
In our simulations, using the suppression factor as diagnostic tool, the delayed feedback control have shown the best efficiency compared with the external time-periodic driving and the activation of neurons. In addition, we have verified that the delayed feedback is better for small values of the time-delayed in a large range of the number of controlled neurons. The delayed feedback control does not damage the neurons due to the fact that it uses a signal amplitude presented by neuronal activity.
Acknowledgements.
We wish to acknowledge the support of the Brazilian agencies: CNPq, CAPES, and FAPESP (2015/07311-7 and 2011/19296-1).References
- (1) G. Buzsaki, Rhythms of the Brain (Oxford University Press, Oxford, 2006).
- (2) J. S. Lund, T. Yoshioka, and J, B. Levitt, “Comparison of intrinsic connectivity in different areas of macaque monkey cerebral ,” Cereb. Cortex 3, 148-162 (1993).
- (3) E. J. Izquierdo, and R. D. Beer, “Connecting a connectome to behavior: An ensemble of neuroanatomical models of C. elegans klinotaxis,” Plos One Comput. Biol. 9, e1002890 (2013).
- (4) J. W. Scannell, C. Blakemore, and M. P. Young, “Analysis of connectivity in the cat cerebral cortex,” J. Neurosci. 15, 1463-1483 (1995).
- (5) J. W. Scannell, and M. P. Young, “The connectional organization of neural systems in the cat cerebral cortex,” Curr. Biol. 3, 191-200 (1993).
- (6) J. Gómez-Gardeñes, G. Zamora-López, Y. Moreno, and A. Arenas, “From modular to centralized organization of synchronization in functional areas of the cat cerebral cortex,” Plos One 5, e12313 (2010).
- (7) C. C. Hilgetag, G. A. Burns, M. ONeill, J. W. Scannell, and M. P. Young, “Anatomical connectivity defines the organization of clusters of cortical areas in the macaque monkey and the cat,” Philos. Trans. R. Soc. Lond. B 355, 91-100 (2000).
- (8) C. Zhou, L. Zemanová, G. Zamora, C. C. Hilgetag, and J. Kurths, “Hierarchical Organization Unveiled by Functional Connectivity in Complex Brain Networks”, Phys. Rev. Lett. 97, 238103 (2006).
- (9) L. Zemanová, C. Zhou, and J. Kurths, “Structural and functional clusters of complex brain networks”, Physica D 224, 202-212 (2006).
- (10) D. Watts, J. Duncan, and S. H. Strogatz, “Collective dynamics of small-world networks,” Nature 393, 440-442 (1998).
- (11) C. J. Stam, B. F. Jones, G. Nolte, M. Breakspear ,and Ph. Scheltens, “Small-world networks and functional connectivity in Alzheimer’s disease,” Cereb. Cortex 17, 92-99 (2007).
- (12) T. I. Netoff, R. Clewley, S. Arno, T. Keck, and J. A. White, “Epilepsy in small-world networks,” J. Neurosci. 24, 8075-8083 (2004).
- (13) A. L. Hodgkin, and A. F. Huxley, “A quantitative description of membrane current and its application to conduction and excitation in nerve,” J. Physiol. 117, 500-544 (1952).
- (14) J. L. Hindmarsh, and R. M. Rose R. M., “A model of neuronal bursting using three coupled first order differential equations,” Proc. R. Soc. London B 221, 87-102 (1984).
- (15) N. F. Rulkov, “Regularization of Synchronized Chaotic Bursts,” Phys. Rev. Lett. 86, 183-186 (2001).
- (16) M. Dhamala, V. K. Jirsa, M. Ding, “Transitions to synchrony in coupled bursting neurons,” Phys. Rev. Lett. 92, 028101 (2004).
- (17) C. A. S. Batista, E. L. Lameu, A. M. Batista, S. R. Lopes, T. Pereira, G. Zamora-López, J. Kurths, and R. L. Viana, “Phase synchronization of bursting neurons in clustered small-world networks,” Phys. Rev. E 86, 016211 (2012).
- (18) E. L. Lameu, F. S. Borges, R. R. Borges, A. M. Batista, M. S. Baptista, and R. L. Viana, “Network induces burst synchronisation in cat cerebral cortex,” Commun. Nonlinear Sci. Numer. Simulat. 34, 45-54 (2016).
- (19) E. L. Lameu, C. A. S. Batista, A. M. Batista, K. Iarosz, R. L. Viana, S. R. Lopes, and J. Kurths, “Suppression of bursting synchronization in clustered scale-free (rich-club) neuronal networks,” Chaos 22, 043149 (2012).
- (20) Q. Y. Wang, Z. S. Duan, L. Huang, G. R. Chen, and Q. S. Lu, “Pattern formation and firing synchronization in networks of map neurons,” New J. of Phys. 9, 383 (2007).
- (21) J. Fell, and N. Axmacher, “The role of phase synchronization in memory processes,” Nat. Rev. Neurosci. 12, 105-118 (2011).
- (22) P. R. Roelfsema, A. K. Engel, Peter König, and W. Singer, “Visuomotor integration is associated with zero time-lag synchronization among cortical areas,” Nature 385, 157-161 (1997).
- (23) M. V. Ivanchenko, G. V. Osipov, V. D. Shalfeev, and J. Kurths, “Phase synchronization in ensembles of bursting oscillators,” Phys. Rev. Lett. 93, 134101 (2004).
- (24) N. Axmacher, F. Mormann, G. Fernández, C. E. Elger, and J. Fell, “Memory formation by neuronal synchronization,” Brain Res. Rev. 52, 170-182 (2006).
- (25) P. J. Uhlhaas, and W. Singer, “Neural synchrony in brain disorders: relevance for cognitive dysfunctions and pathophysiology,” Neuron 52, 155-168 (2006).
- (26) C. C. Chena, V. Litvaka, T. Gilbertsona, A. K’́uhna, C. S. Lub, S. T. Leed, C. H. Tsaie, S. Tischa, P. Limousina, M. Hariza, P. Brown, “Excessive synchronization of basal ganglia neurons at 20 Hz slows movement in Parkinson’s disease,” Exp. Neurol. 205, 214-221 (2007).
- (27) R. Levy, W. D. Hutchison, A. M. Lozano, and J. O. Dostrovsky, “High-frequency synchronization of neuronal activity in the subthalamic nucleus of Parkinsonian patients with limb tremor,” J. Neurosci. 20 7766-7775 (2000).
- (28) M. G. Rosenblum, and A. S. Pikowsky, “Delayed feed back control of collective synchrony: An approach to suppression of pathological brain rhythms,” Phys. Rev. E 70, 041904 (2004).
- (29) C. A. S. Batista, S. R. Lopes, R. L. Viana, and A. M. Batista, “Delayed feedback control of bursting synchronization in a scale-free neuronal network,” Neural Netw. 23, 114-124 (2010).
- (30) C. A. S. Batista, R. L. Viana, F. A. S. Ferrari, S. R. Lopes, A. M. Batista, J. C. P. Coninck, “Control of bursting synchronization in networks of Hodgkin-Huxley-type neurons with chemical synapses”, Phys. Rev. E 87, 042713 (2013).
- (31) D. E. J. Linden, I. Habes, S. J. Johnston, S. Linden, R. Tatineni, L. Subramanian, B. Sorger, D. Healy, and R. Goebel, “Real-time self-regulation of emotion networks in patients with depression”, Plos One 7 e38115 (2012).
- (32) R. P. Lesser, “Electrical Stimulation Depresses Epileptiform Activity,” Epilepsy Curr. 3, 137-138 (2003).
- (33) X. Han, and E. S. Boyden, “Multiple-color optical activation, silencing, and desynchronization of neural activity, with single-spike temporal resolution,” Plos One 2, e299 (2007).
- (34) M. E. Newman, and D. J. Watts, ”Renormalization group analysis of the small-world network model,” Phys. Lett. A 263 341-346 (1999).
- (35) M. G. Rosenblum, and A. S. Pikovsky, “Controlling synchronization in an ensemble of globally coupled oscillators”, Phys. Rev. Lett. 92, 114102 (2004).
- (36) A. Koseska, E. Volkov, and J. Kurths, “Oscillation quenching mechanisms: Amplitude vs. oscillation death”, Phys. Rep. 531, 173-199 (1999).