Mailing address:] CEA-ESEME, Institut de Chimie de la Matière Condensée de Bordeaux, 87, Avenue du Dr. Schweitzer, 33608 Pessac Cedex, France
Gas spreads on a heated wall wetted by liquid
Abstract
This study deals with a simple pure fluid whose temperature is slightly below its critical temperature and its density is nearly critical, so that the gas and liquid phases co-exist. Under equilibrium conditions, such a liquid completely wets the container wall and the gas phase is always separated from the solid by a wetting film. We report a striking change in the shape of the gas-liquid interface influenced by heating under weightlessness where the gas phase spreads over a hot solid surface showing an apparent contact angle larger than . We show that the two-phase fluid is very sensitive to the differential vapor recoil force and give an explanation that uses this non-equilibrium effect. We also show how these experiments help to understand the boiling crisis, an important technological problem in high-power boiling heat exchange.
pacs:
05.70.Jk, 44.35.+c, 68.03.Cd, 64.60.Fr, 68.35.RhI Introduction
Singular properties of a simple fluid 1 ; 2 appear when it is near its critical temperature, , and its critical density, . When the fluid’s temperature, , is slightly lower than and the average fluid density is close to the fluid exhibits perfect wetting (i.e., zero contact angle) of practically any solid by the liquid phase in equilibrium. In this article we study a system that is slightly out of equilibrium. Our experiments, performed in weightlessness ChimPh ; BouldGW ; IJT ; Sorrento ; STAIF showed that when the system’s temperature is being increased to , the apparent contact angle (see Fig. 7 below for definition) becomes very large (up to ), and the gas appears to spread over the solid surface. In section II we describe our experimental setup that allows the spreading gas to be observed. The gas-liquid interface shape at equilibrium, which is considered in section III, plays a crucial role as an initial condition for the gas spreading phenomenon. The sections IV and V deal with the observations of the spreading gas. A theoretical model that allows this unusual phenomenon to be explained is proposed in section VI. In the section VII, we discuss the boiling crisis, a phenomenon that plays an important role in industrial applications, and how it is relevant to the spreading gas.
II Experimental setup
We report results that were obtained and repeated using several samples of ( K, kg/m3). These samples were heated at various rates in cylindrical cells of various aspect ratios on several French/Russian and French/American missions on the Mir space station using the Alice-II instrument 3 . This instrument is specially designed to obtain high precision temperature control (stability of K over 50 hours, repeatability of K over 7 days). To place the samples near the critical point, constant mass cells are prepared with a high precision density, to 0.02%, by observing the volume fraction change of the cells as a function of temperature on the ground 4 .
A fluid layer was sandwiched between two parallel sapphire windows and surrounded by a copper alloy housing in the cylindrical optical cell, the axial section of which is shown in Figure 1.
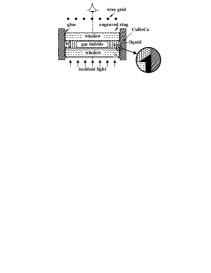
We consider here three cells of the same diameter mm, the other parameters of which are shown in Table 1. The liquid-gas interface was visualized through light transmission normal to the windows. Since the windows were glued to the copper alloy wall, some of the glue is squeezed inside the cell as shown in Fig. 1. This glue forms a ring that blocks the light transmission in a thin layer of the fluid adjacent to the copper wall making it inaccessible for observations. Because of this glue layer, the windows may also be slightly tilted with respect to each other as discussed in sec. III.
A 10 mm diameter ring was engraved on one of the windows of each cell in order to calibrate the size of the visible area of the cell images as can be seen in each image. An out-of-focus wire grid, designed to visualize Gulf fluid inhomogeneities and/or a fluid flow through light refraction, was also used. The grid was occasionally moved out of the light path, so that it is not always present in all images.
| Cell number | Cell thickness (mm) | (%) |
|---|---|---|
| 8 | 3.016 | 0.85 |
| 10 | 1.664 | 0.25 |
| 11 | 4.340 | 0.87 |
The sample cell is placed inside of a copper Sample Cell Unit (SCU) that, in turn, is placed inside of a thermostat. Heat is pumped into and out of the SCU using Peltier elements and heaters. The temperature is sampled every second and is resolved to K.
Similar ground based experiments were done before these experiments using a copy of the same instrument. The gravity forces push the denser liquid phase to the bottom of the cell and completely different behavior is seen, see 5 .
III Bubble position at equilibrium under weightlessness
The gas volume fraction (volume of the gas divided by the total cell volume) is defined by and the densities of gas and liquid for the given temperature. In our experiments, and the gas bubble is flattened between the windows (Fig. 1) due to the large aspect ratio of the cell.
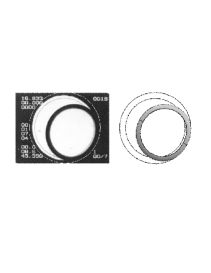
Let us first consider an ideally cylindrical cell as opposed to the real cell. At equilibrium, the windows and the copper wall are wetted by the liquid phase. Because the van der Waals forces from the walls act to make the wetting film as thick as possible, the weightless bubble should be located in the cell’s center. Because the bubble is flattened and occupies one-half of the available volume, the distance of such a centered bubble to the copper wall is large (Fig. 1). The lateral centering forces are then much weaker than the centering forces in the direction of the cell axis. Any small external influences in the real cell can displace the bubble laterally from the cell’s center. This displacement is illustrated in Fig. 2 that shows cell 10 at room temperature.
a b
We note that there are two kinds of external influences that are easily identified: residual accelerations in the spacecraft and cell asymmetry.
Bubble images for cells 8 and 10 were recorded in four Mir missions between 1996 and 2000. Several images are reported in ChimPh (Cassiopeia mission, 1996) and in Fig. 6 below (GMSF2 mission, 1999) for cell 10. It is extremely likely that the space station changed its position with respect to the residual gravity vector between these runs. The bubble position with respect to the cell, however, always remained the same. The bubble location also varies from cell to cell without any dependence on the station’s orientation. Therefore, we have no reason to attribute the off-center position of the bubble to the residual gravity.
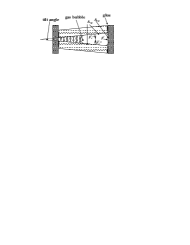
Although the cells were manufactured with high precision, the cell windows could not be exactly parallel because of the glue layer as shown in Fig. 3. In the rest of this section we will discuss the influence of the windows’ tilt on the position and on the shape of the bubble.
When the bubble’s surface is curved, there is a constant excess pressure inside the bubble defined by the Laplace formula
| (1) |
where is a surface tension and is the surface curvature. This excess pressure acts on all parts of the bubble interface. In particular, it acts on the part (where the index stands for “sapphire” and for “gas”) of the flat window surface that contacts the gas directly (or, more accurately, through a wetting film that we assume to be of homogeneous thickness). This pressure creates reactions forces and at each window, that act on the bubble. Each of these forces is perpendicular to the corresponding window. The absolute values of and are equal to . When the windows are exactly parallel, and the bubble remains at the cell’s center. When the windows are tilted with respect to each other, the non-zero force pushes the bubble in the direction of the increasing cell thickness. This motion continues until the bubble touches (through a wetting film) the copper wall of the cell, thus forming a contact spot of the area , where the index stands for “copper”. This direct contact with the solid results in another reaction force with the absolute value , such that
| (2) |
in equilibrium, see Fig. 3.
There are two equivalent ways to find the bubble shape at equilibrium. One can solve Eq. (1) that reduces to const, where the constant is obtained from the condition of the given bubble volume. The bubble volume is defined by the known gas volume fraction and the cell volume. One can also minimize the gas-liquid interface area with a bubble volume constraint. In both cases boundary conditions must be satisfied (zero contact angle in our case). The resulting bubble shape obviously depends on the cell geometry. It is also nearly independent of temperature as can be seen from Eq. (2), because all three terms of this equation are proportional to the surface tension , so that this force balance remains valid even near , where disappears. There are, however, several sources of weak temperature dependence of the bubble shape. First, there is weak dependence of the gas volume fraction on temperature at constant average density . This small deviation is smallest at the critical density and slightly greater in these experiments due to the very small deviation (see Table 1) of from . Second, the curvature depends on the thickness of the wetting film that increases near . The wetting film remains small, however, in comparison with the cell thickness. Both of these effects are very weak.
The force , which is directed horizontally in Fig. 3, causes a distortion of the bubble. This distortion results in an oval image in Fig. 2 instead of a circle. The degree of distortion increases with the tilt angle because so does . This distortion can thus be used to estimate the tilt angle.
For these constant volume gas bubbles, the degree of distortion should decrease with increasing cell thickness for the same window tilt. A larger value of results in a less compressed (more sphere-like) bubble shape with less area in contact with the wall. This smaller bubble curvature results in a smaller value for according to Eq. (1). Consequently, the force , the area of the contact with the copper wall, and the bubble distortion are smaller. This window tilt hypothesis is consistent with observations: we were not able to detect any distortion of the gas bubble in cell 8 (see Fig. 10a below that corresponds to the nearly equilibrium shape) that is approximately twice as thick (Table 1) as cell 10 shown in Fig. 2. There is, however, some tilt in cell 8 because the bubble touches the wall. We expect that the tilt angles in all of the cells are of the same order of magnitude because they were all manufactured using the same method.
To verify the window tilt hypothesis, we performed a 3D numerical simulation of the bubble surface by using the Surface Evolver finite element software Evolver . The result of this calculation is shown in Fig. 4 for cell 10.

The experimentally observed bubble deformation matches the calculation performed for a tilt angle of , see Fig. 2. The simulation resulted in the interface curvature mm-1 and in mm2 calculated for the bubble volume mm3. From this data, it is easy to calculate the effective acceleration that would create the equivalent buoyancy force . It turns out that for K, where is the gravity acceleration on Earth. This acceleration is much larger than the residual steady accelerations in the Mir space station () and this shows that the observed bubble deformation is not caused by residual accelerations. We conclude that the window tilt hypothesis about the origin of the bubble deformation and its off-center position is correct.
A similar off-center bubble position was observed under weightlessness in a cell similar to ours by Ikier et. al. 14 and was attributed to a residual acceleration. However, they report only one run in a single cell making the actual cause of the bubble off-centered position impossible to verify.
IV Continuous heating experiments
In the continuous heating experiments, the cells 8, 10 and 11 were heated nearly linearly in time . The evolution of the non-dimensional temperature for each of these experiments is shown in Fig. 5.
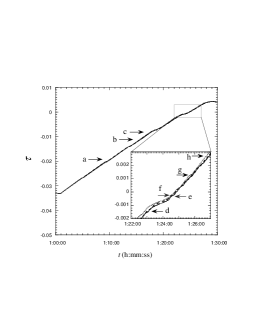
The parameter is defined as , where is the temperature of the coexistence curve that corresponds to the fluid’s average density shown in Table 1. Note that differs from only by K because the density is very close to for all cells. A 40 min temperature equilibration at preceded the heating. The mean value of at was mK/s.
Figure 6 shows the time sequence of the images of the cell 10.
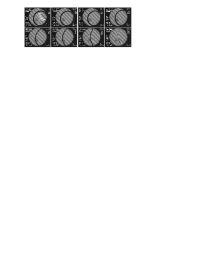
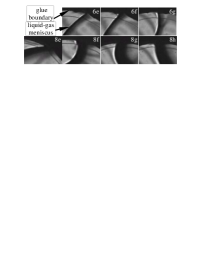
The interface appears dark because the liquid-gas meniscus refracts the normally incident light away from the cell axis. After the temperature ramp was started but still far from the critical temperature, the bubble shape changed. The contact area of the gas with the copper wall appears to increase. In other systems the wetting film under a growing vapor bubble is observed to evaporate Tong . In near-critical fluids, however, the heat transfer processes are more complex Straub . In this system we believe that there may be a similar drying process, i.e., at some time the thin wetting film that separates the gas from the copper wall evaporates. In fact, we have observed low contrast lines that appear within the area when the heating begins. An example of such a line is indicated in Figure 6a by the white arrows. The out-of-focus grid shows that these lines correspond to a sharp change in the wetting film thickness. These lines are most likely triple contact lines and we have actually seen them pinned by an imperfection on the windows as they advance and retreat in other experiments. Since the heat conductivity of copper is larger than that of sapphire, the heat is supplied to the cell mainly through the hotter copper wall. Therefore the film should evaporate on the copper wall even earlier than on the sapphire. A more refined analysis of the contact line motion will be discussed elsewhere.
The increase of the area is accompanied by an evident increase in the apparent contact angle, see Fig. 6d–f and the corresponding magnified images in Fig. 7. Near the critical temperature the apparent contact angle becomes larger than ! We will analyze these effects theoretically in section VI.
While crossing the critical point, the vapor bubble is rapidly evolving. At , the surface tension vanishes, the bubble’s relaxation from surface tension is negligible, so that the interface shape is defined by the variation of the local evaporation rate along the interface. The evaporation is stronger at the parts of the interface closest to the copper heating wall. This effect leads to the waved interface shape shown in Fig. 6g. Diffusion causes the disappearance of the interface at as shown in Fig. 6h.
Figure 8 shows the time sequence of the images of the cell 8, which is approximately twice as thick as cell 10.
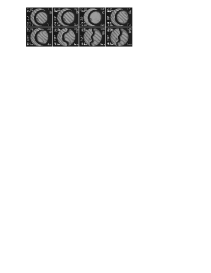
The images in Fig. 8 were taken exactly for the same values of the non-dimensional temperature (shown in Fig. 5) as the corresponding images in Fig. 6. The force pushes the bubble against the cell wall as in the case of cell 10. As discussed above, this force is weaker than for the cell 10 because the bubble appears almost circular at equilibrium (see Fig. 6a and Fig. 8a). By comparing images (e) of both sequences, we can also see that the vapor spreads slower in cell 8. The increase of the apparent contact angle is also slower. The waved shape interface appears earlier in Fig. 8f, i.e. farther from than for the cell 10. The interface is still quite sharp in Fig. 8h, while it has already diffused in the case of the thinner cell (Fig. 6h). This difference can be explained by the difference in the liquid-gas interface area, which is roughly proportional to the cell thickness. The surface tension force that tends to maintain the convex shape is not as strong for the thicker cell where a larger fluid volume has to be moved during the same time. The diffusion time is larger for cell 8 because the size of the inhomogeneity (i.e. interface) is larger.
Figure 9 shows the time sequence of the images from cell 11, which is thicker than both the cells 8 and 10.
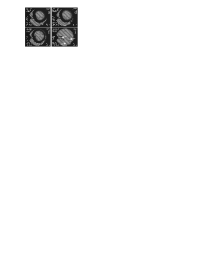
The images (a), (d) and (f) were taken for the same values of non-dimensional temperature as corresponding images in Figs. 6 and 8. This cell contained three wetted thermistors (Fig. 9i) that constrain the bubble surface (Fig. 9a). The bubble is only slightly squeezed by the windows so that the reaction forces that act on the bubble at equilibrium are weak. As a result, the bubble does not touch the copper heating wall at all. Although this is not clear in the image (a), because of the glue near the copper wall, it is clear in image (f) where small newly formed bubbles separate the initial bubble from the wall. These bubbles form from the local overheating of the fluid between the large bubble and the copper wall. There is enough fluid between the large bubble and the wall so that a small bubble may grow in it. These small bubbles push the large bubble away from the wall before any coalescence can take place.
The comparison of these three experiments clearly shows that in order to obtain the bubble spreading, the bubble needs to have a direct contact with the heating wall, i.e. to be pushed to the heating wall by some force. Note that none of the images show any evidence of steady fluid motion that would be necessary to maintain the distorted bubble shapes in Figs. 6 and 8. We conclude that this distortion of the bubble equilibrium shape cannot be caused by fluid motion.
Similar continuous heating experiments are reported by Ikier et. al. in 14 . However, a smaller heating rate (1.7 mK/s) and erratic accelerations of the cell did not allow gas spreading to be observed.
V Quenching experiments
Figure 10 shows the time sequence of the images of cell 8 when it was heated by 100 mK quenches as shown in Fig. 11.

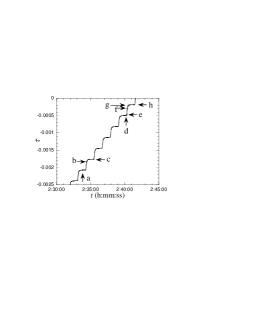
While the heating rate is quite large during each quench, the time average of the heating rate 1.4 mK/s is smaller than that during the continuous heating due to the waiting time of s after each quench. During this waiting time a partial equilibration takes place. The images (a–c) show a slight bubble spreading that appears during a quench that is farther from the critical point than the quench shown in images (d-h). After each quench as soon as the heating stops, the bubble interface begins to return to its initial form (Fig. 10c,d). This shows that the spreading vapor is caused by a non-equilibrium effect. The second quench that precedes the crossing of the critical point (Fig. 10d–h) shows very rapid interface motion accompanied by fluid flows.
While the interface returns to its initial state during the waiting time of the first quench (Fig. 10c), it does not return in the second quench (Fig. 10h). This occurs because the characteristic equilibration time grows dramatically near .
The same phenomenon of spreading gas was also observed during the heating of CO2 cells in other experiments (Pegasus BV4705, Post-Perseus F14) carried out by our group in the Mir station. However, these experiments were not designed to study the spreading gas and we do not discuss them here.
VI Interface evolution during the heating
The above experimental data showed that the spreading gas and the associated interface deformation are caused by an out-of-equilibrium phenomenon. This is especially demonstrated by the analysis of the interface shape at equilibrium (sec. III) and by the return to the equilibrium shape after each quench in sec. V. In this section we analyze possible causes of the spreading gas. Two causes are considered: Marangoni convection due to the temperature change along the gas-liquid interface and the differential vapor recoil.
VI.1 Marangoni convection
If a temperature change exists, it will create a surface tension change that will drive a thermo-capillary (Marangoni) flow in the bulk of both fluids 7 ; 8 ; 9 . The images obtained in our experiment are capable of visualizing convective flows from the shadow-graph effect. We have not seen any evidence of the steady convection that is required to create and maintain the observed bubble shape continuously during the heating. We conclude that the Marangoni convection is absent.
This conclusion is an apparent contradiction with many works that study the Marangoni effect caused by evaporation (see e.g. Palmer ). The main difference between these works and ours is in the conditions of evaporation. These works consider the evaporation into an open space where the vapor pressure is very small. The interface temperature thus follows the temperature in the bulk of the liquid and a very large evaporation rate is possible, limited only by the average velocity of the fluid molecules. In our case, the gas phase is almost at saturation pressure. This means that the total evaporation (over the whole gas liquid interface) is small and limited by the amount of the supplied heat consumed by the latent heat. Therefore, any variation is rapidly dampened by the corresponding change in the evaporation rate, stabilizing the interface against Marangoni convection, see Straub for an extended discussion. This conclusion is confirmed by the experiments Barnes , in which Marangoni convection was carefully studied in a closed cell with very clean water in contact with its vapor. No surface-tension-driven convection was registered in spite of a large Marangoni number that was much greater than its critical value obtained in the classical Marangoni-Benard experiments with non-volatile liquids 7 . It was argued in 7 that the convection was absent due to a hypothetical interface contamination present in spite of many careful preventive measures. According to our reasoning, a variation would have been strongly dampened in 7 because of the saturation conditions in the sealed cell. We also note that even in evaporative driven Marangoni convection far from saturation, the convection cells may also tend to stabilize the interface resulting in intermittent cellular formation as was observed in 8 . It was also observed in 8 that the velocity of convection and frequency of intermittent cell formation decreases as the external gas becomes more saturated.
VI.2 Differential vapor recoil
We now analyze another possible source of bubble deforming stress that does not require a temperature gradient along the interface. The bubble may be deformed by the normal stress exerted on the interface by the recoil from departing vapor Palmer . Let be the evaporating mass per unit time per unit interface area at the point on the interface. The evaporating gas moves normally to the interface, and exerts a force per unit area (a “thrust”) on the liquid of
| (3) |
where denotes mass density and the subscripts and refer to liquid and gas respectively.
The interface shape can be obtained from a quasi-static argument when the experimentally observed interface velocity is smaller than the characteristic hydrodynamic velocity , where is the shear viscosity. A numerical estimate shows that the quasi-static approximation holds for the images (a-f) in Fig. 6, in which the spreading is observed. The quasi-static approximation does not appear to hold for the quench experiments (Fig. 10), where the interface moves rapidly.
According to the quasi-static argument 13 , the interface shape can be determined from the modified Laplace equation
| (4) |
The 3D curvature is equal to the sum of the 2D curvature in the image plane and the 2D curvature in the perpendicular plane shown in Fig. 1. For the small cell thickness , this latter curvature can be accurately approximated by the constant value . This is possible because the relatively small heat flow through the less conductive sapphire windows implies a small near the contact line on the windows, as compared to the large value of at this small . The interface shape can thus be obtained from the 2D equation
| (5) |
where is a constant to be determined from the known bubble volume and is a coordinate that varies along the bubble contour in the image plane.
In order to find the distribution at the interface it is necessary to solve the entire heat transfer problem. This problem is complicated by several important factors. First, we deal with a problem that contains a free boundary (gas-liquid interface) the position of which should be determined. Second, this interface contains lines of singularities (gas-liquid-solid contact lines) where various divergences are possible. Third, the adiabatic heat transfer Straub ; 11 ; Reg (“the piston effect”) should be taken into account for near-critical fluids. The first two complications were addressed in 13 ; IJMF ; IJHMT for plane geometry, i.e. for the gas bubble growing on a plane. We have shown that can exhibit a divergence at the contact line and that it decreases exponentially far away from it. Because the bulk temperature varies sharply in the boundary layer adjacent to the walls of the cell 11 and the interface temperature is constant, the largest portion of mass transfer across the interface takes place near the triple contact line. Thus is large in the vicinity of the contact line. In this work, we present first the scaling arguments and then an approximate calculation of the bubble shape to illustrate our explanation of the spreading gas in the cylindrical geometry.
We assume that has the following form:
| (6) |
as , i.e., it has the same local behavior with respect to temperature as the critical temperature is approached. The integral rate of change of mass of the gas bubble is defined as
| (7) |
where the integration is performed over the total gas-liquid interface area. On the other hand,
| (8) |
where is the cell volume, and is assumed. Near the critical point, the co-existence curve has the form , where with the universal exponent , so that as according to Eq. (8). Thus Eq. (7) results in and the curvature change due to the vapor recoil scales as
| (9) |
where Eq. (3) and the scaling relationship () were employed. Because this critical exponent is very large, it should manifest itself even far from the critical point in agreement with the experiments. In summary, as , the vapor mass growth follows the growth of its density (the vapor volume remains constant), so that the diverging vapor production near the critical point drives a diverging recoil force.
This curvature change has a striking effect on the bubble shape because it is not homogeneously distributed along the bubble interface. Since the evaporation is strongest near the copper heating wall where the strongest temperature gradients form, both and increase strongly near this wall, i.e. near the triple contact line. Note that is proportional to the second derivative of the bubble shape function, i.e. to the first derivative of the bubble slope. If is large, then the slope of the bubble contour changes sharply when moving along the bubble contour towards the contact line, see IJT ; 13 ; IJMF for more details. Because the interface slope changes so abruptly near the contact line, the apparent contact angle should be much larger than its actual value.
Because is proportional to the second derivative of the bubble shape function, Eq. (5) is a differential equation with the boundary condition given by the actual contact angle 13 . This actual contact angle defines the first derivative (the slope) of the bubble shape function at the solid wall. It is also specified by the interfacial tension balance and must be zero near the critical point. This condition of the zero contact angle gives a boundary condition for Eq. (5). In order to illustrate a possible solution of Eq. (5), we solved it using the same expression for as in 13
| (10) |
where , being a length of the bubble half-contour with at the solid wall. We use a non-dimensional parameter to measure the influence of the vapor recoil force relative to the surface tension. It is defined as
| (11) |
where the integration is performed over the drop contour in the image plane. The numerical coefficient (see 13 ) in Eq. (10) can be determined from Eq. (11), where the upper integration limit can be replaced by infinity without any loss of accuracy. Although the expression Eq. (10) for the vapor recoil pressure is not rigorous, it contains the main physical features of the solution of the heat conduction problem: a weak divergence at the contact line and a rapid decay away from it. It is shown in IJHMT that the rigorous numerical solutions obtained far from the critical point follow this behavior.
The result of this calculation is shown in Fig. 12.
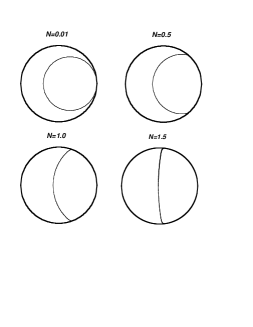
Since Eq. (9) implies
| (12) |
as , the increase mimics the approach to the critical point and qualitatively explains the observed shape of the vapor bubble (see Fig. 6). The increase of the apparent contact angle and of the gas-solid contact area can be seen in Fig. 12. Note that such a calculation is not able to predict the wavy interface shapes like those in Fig. 6g or Fig. 8f-h, because these images correspond either to (images g and h of the both figures) or to the close vicinity of where , see the discussion of the validity of the quasi-static approximation earlier in this section.
VII Spreading gas and the boiling crisis
A very similar bubble spreading was observed far from during boiling at large heat flux Van ; Tor . When the heating to a surface is increased past a Critical Heat Flux (CHF) there is a sudden transition to “film” boiling, where the heater becomes covered with gas and may burnout Tong . This “boiling crisis” is an important practical problem in many industries where large heat fluxes are frequently used. We interpret 13 ; IJHMT the boiling crisis to be similar to the gas spreading shown here. The main difference is that the large value of is made by a large vapor production that can be achieved during strong overheating rather than by the critical effects.
It is well-documented from experiments Tong that the CHF decreases rapidly when the fluid pressure approaches the critical pressure , i.e., when in our constant volume system. Previously, this tendency has not been well understood. The divergence of the factor , discussed above, helps to understand it. We first note that the evaporation rate scales as the applied heat flux and , where Eqs. (3) and (11) are used. By assuming that the boiling crisis () begins when attains its critical value (see 13 ), one finds that
| (13) |
from Eq. (12). The same exponent is also valid for the pressure scaling,
| (14) |
Eq. (14) explains the observed tendency as .
Although the strict requirements on temperature stability and the necessity of weightlessness lead to experimental difficulties to study the boiling crisis in the near-critical region, they also present some important advantages. Only a very small heating rate (heat flux) is needed to reach the boiling crisis because is very small. At such low heat fluxes, the bubble growth is extremely slow due to the critical slowing-down. In our experiments we were able to observe the spreading gas (i.e. the dry-out that leads to the boiling crisis, see Fig. 6) during 45 min! Such experiments not only permit an excellent time resolution, but also allow the complicating effects of rapid fluid motion to be avoided.
VIII Conclusions
In our experiments we observed a gas bubble spreading over a solid wall and a large value () of the apparent contact angle that appeared despite the zero actual contact angle with the solid. The spreading gas is a phenomenon that can occur in a sealed heated fluid cell only when the bubble is pressed against the heating wall. The 3D numerical calculation of the equilibrium bubble shape showed that the slightly tilted windows of the experimental cell pressed the bubble against the copper side-wall. Weightless conditions are needed in the near-critical region in order to observe this phenomenon when the surface tension is small and a bubble-like shape persists. The same phenomenon can be observed far from the critical point during boiling at high heat fluxes where it is known as the “boiling crisis”. While the gas spreads very quickly during the boiling crisis far from the critical point, the near-critical region allows a very slow spreading gas to be observed in great detail.
We explain this phenomenon as induced by the vapor recoil force that changes the shape of the vapor-liquid interface near the triple contact line. Our preliminary calculations of the gas-liquid interface shape are qualitatively consistent with the experimental images. The scaling analysis gives the critical exponent for the critical heat flux decrease near the critical point and explains the increase of the vapor recoil effect near the critical point. We believe that there is much to be learned about the boiling crisis in the near-critical region and hope that these experiments inspire more investigations.
Acknowledgements.
This work was supported by CNES and NASA Grant NAG3-1906. A part of this work was made during the stay of V. N. at the UNO and he would like to thank the Department of Physics of the UNO for their hospitality. We thank all of the Alice II team and everyone involved in the Mir missions. We especially thank J. F. Zwilling, and the french cosmonauts Claudie André-Deshays, Léopold Eyharts, and Jean-Pierre Haigneré. We thank Kenneth Brakke for creating the Surface Evolver software and for making it available for the scientific community.References
- (1) M. Schick, in: Liquids at Interfaces, Eds. J. Charvolin, J.-F. Joanny & J. Zinn-Justin, Elsevier, p.415 (1989); D. Beysens , ibid, p. 499.
- (2) R.F. Kayser, J.W. Schmidt, & M.R. Moldover, Phys. Rev. Lett. 54, 707 (1985).
- (3) Y. Garrabos, C. Chabot, R. Wunenburger, J.-P. Delville, & D. Beysens, J. Chimie Physique 96, 1066 (1999).
- (4) J. Hegseth, Y. Garrabos, V. S. Nikolayev, C. Lecoutre-Chabot, R. Wunenburger, D. Beysens, Proc. 14th Symposium on Thermophysical properties, Boulder, CO (USA) June 25–30, 2000, http://symp14.nist.gov/PDF/WET05HEG.PDF, Int. J. Thermophysics, to be published (2001).
- (5) V. S. Nikolayev, D. A. Beysens, J. Hegseth, Proc. 14th Symposium on Thermophysical properties, Boulder, CO (USA) June 25–30, 2000, http://symp14.nist.gov/PDF/WET10NIK.PDF, Int. J. Thermophysics, to be published (2001).
- (6) Y. Garrabos, R. Wunenburger, C. Lecoutre, V. Nikolayev, D. Beysens, J. Hegseth, Proc. 1st Int. Symp. on Microgravity Research & Applications in Physical Sciences and Biotechnology Sorrento, Italy, Sept. 10-15, 2000, ESA SP-454, ESTEC, Noordwijk, 157 (2000).
- (7) Y. Garrabos, R. Wunenburger, J. Hegseth, C. Lecoutre-Chabot, D. Beysens, in: Space Technology and Applications International Forum–2000, ed. M. S. El-Genk, American Institute of Physics, 737 (2000).
- (8) R. Marcout, J.-F. Zwilling, J. M. Laherrere, Y. Garrabos, & D. Beysens, Microgravity Quaterly 5, 162 (1995).
- (9) C. Morteau, M. Salzman, Y. Garrabos, & D. Beysens, in: Fluids in Space, Proc. 2nd European Symposium on Fluids in Space , Ed. A. Viviani, Jean-Gilder Congressi srl, Rome, p.327 (1997).
- (10) V. Gurfein, D. Beysens, Y. Garrabos, & B. Le Neindre, Opt. Comm. 85, 147 (1991).
- (11) J. P. Delville, M. Salzman, Y. Garrabos, & D. Beysens, in: Fluids in Space, Proc. 2nd European Symposium on Fluids in Space , Ed. A. Viviani, Jean-Gilder Congressi srl, Rome, p. 312 (1997).
- (12) http://www.geom.umn.edu/software/evolver/
- (13) C. Ikier, H. Klein, and D. Woermann, J. Colloid Interface Sci. 178, 368 (1996).
- (14) L. S. Tong, Boiling Heat Transfer and Two-Phase Flow, Taylor & Francis, New York (1997), 2nd ed.
- (15) J. Straub, L. Eicher, & A. Haupt, Phys. Rev. E 51, 5556 (1995).
- (16) J. R. A. Pearson, J. Fluid Mech. 4, 489 (1958).
- (17) J. J. Hegseth, N. Rashidnia, & A. Chai, Phys. Rev. E 54, 1640 (1996).
- (18) S. H. Davis, Ann. Rev. Fluid Mech. 19, 403 (1987).
- (19) H. J. Palmer, J. Fluid. Mech. 75, part 3, 487 (1976).
- (20) H. K. Cammenga, D. Schreiber, G. T. Barnes, D. S. Hunter, J. Colloid Interface Sci. 98, 585 (1984).
- (21) Y. Garrabos, M. Bonetti, D. Beysens, F. Perrot, T. Fröhlich, P. Carlès, & B. Zappoli, Phys. Rev. E 57, 5665 (1998) and refs. therein.
- (22) R. Wunenburger, Y. Garrabos, C. Lecoutre-Chabot, D. Beysens, & J. Hegseth, Phys. Rev. Lett 84, 4100 (2000).
- (23) V. S. Nikolayev & D. A. Beysens, Europhys. Lett. 47, 345 (1999).
- (24) V. S. Nikolayev, D. A. Beysens, Y. Garrabos & J. Hegseth, Proc. 4th International Conf. on Multiphase Flow, New Orleans, May 27 – June 1, 2001, Int. J. Multiphase flow, to be published (2001).
- (25) V. S. Nikolayev, D. A. Beysens, G.-L. Lagier & J. Hegseth, Int. J. Heat Mass Transfer 44, 3499 (2001).
- (26) H. J. van Ouwerkerk, Int. J. Heat Mass Transfer 15, 25–34 (1972).
- (27) K. Torikai, K. Suzuki & M. Yamaguchi, JSME Int. J. Series II 34, 195 (1991).