A chemical dissolution technique for challenging existing constitutive models of the densification process beneath an indentation imprint in amorphous silica
Abstract
The region of permanent densification beneath a Berkovich indentation imprint in silica glass is investigated using a novel chemical dissolution technique. The use of the similitude regime in sharp indentation testing allows one to record reliable data with a good spatial resolution that makes it possible to deal with low loads (typically below 10 mN) and crack-free imprints. The densified zone dissolves much quicker than the non densified regions. The analysis of the results, along the vertical axis, indicates that the densification zone is rather homogeneous with a steep transition to the non densified zone. The size of the densification zone, with respect to the initial free surface, is estimated to be around 1.9 the maximum penetration depth of the instrumented indentation test. These findings are compared with former experimental data and critically compared with the results of numerical simulations from selected constitutive equations and other numerical techniques from the literature. These comparisons highlight some advantages and disadvantages of existing modelings and thus call for further advanced progress on that matter. They nevertheless favor mostly the contribution of the densification process with respect to the plastic flow (volume conservative process) in creating a permanent imprint.
keywords:
Non-metallic glasses (silicates); Pressure dependent plasticity; Constitutive modeling; Densification; Nanoindentation.1 Introduction
The highest strength value measured for pristine silica glass fibres is 10 GPa at room temperature [1], but the extreme sensitivity of silicate glasses to surface damage is often reported to be the reason for low strength values of few tens of MPa in manufactured structural glass parts [2]. Although the negative impact of surface damage on the durability of silica glass has been studied for quite a long time [3], a complete understanding of this effect is far from being realised. An efficient way to scientifically study surface damage in glass is to create controlled sharp contact conditions between a pyramidal indenter having a well-defined geometry and a prepared glass surface. Under such contact conditions, oxide glasses accommodate deformation both by elastic and permanent deformation mechanisms among which one can distinguish a volume conservative one, shear flow, and a non volume conservative one, densification (i.e. permanent density increase, ) [4, 5, 6, 7, 8, 9]. The respective contributions of the two mechanisms to the overall strain depends strongly on the pressure and shear state as well as on the chemical composition of silicate glasses [10]. From purely hydrostatic compression tests it was shown that silica glass (respectively window glass) exhibits a threshold value of 10 GPa (resp. 8 GPa) below which no permanent densification is observed [11, 12, 13, 14, 15]. Above this threshold, the value of the permanent densification ratio (ratio to the initial mass density) increases monotonically with applied pressure up to a saturation value of 21% (resp. 6 %) at a pressure of 25 GPa [16, 17]. Micro Raman spectroscopy [17, 18, 19, 20, 21] and more recently Brillouin spectroscopy [22] where successfully used to either characterize permanently densified samples and their associated structural modifications or map out the size, shape and intensity of the densification ratio around and underneath residual indentation imprints [7, 18]. Although these spectroscopic techniques generate invaluable information regarding structural changes, they suffer from a relatively low spatial resolution, which is of the order of a micrometer at best [20, 22]. Thus, to map out densification contrast under indentation imprints with sufficient spatial resolution, researchers resorted to increasing the size of the processed zone by the use of high indentation loads of at least 20 N [18, 20, 22] for silica glass or soda-lime-silica glass. However, as shown in Ref. [20], this level of loading results in massive fracturing of the zone underneath a Vickers indentation [23, 24]. Crack nucleation and propagation are energy dissipative processes, such that a non negligible part of the energy involved in the indentation test goes into fracture events; this may affect the size, shape and nature of the densified area developed during indentation. Cracking events must therefore be limited as much as possible using such methods as nano-indentation at loads below 50 mN [25].
An alternative technique to Raman or Brillouin spectroscopies, which relies on the increase in the rate of dissolution of silicate glasses with the level of densification, was recently developed by Niu et al. [26]. By coupling hydrolysis with atomic force microscopy (AFM) measurements, it was shown that nanometer-sized changes in the shape of the residual imprint is possible. It was demonstrated that the increase in dissolution rate is intimately linked to the underlying structural changes induced by densification [19, 27]. Hence, the first aim of this paper is to extend this technique to give sound and quantitative information on the densification zone underneath an indentation imprint in amorphous silica, making use of the geometrical self similarity of the sharp indentation test [28]. We will focus on two main questions. Firstly, what is the size of the densification zone? Secondly, what is the nature of the densification zone, i.e. is it rather homogeneous or heterogeneous? These questions are addressed in Sections 2 and 3.
These new quantitative experimental results will allow us to discuss the present state modeling of the permanent deformation process in silica glass. Indeed, a robust constitutive model of brittle materials like silicate glasses is far from being straightforward. Unlike metallic alloys, where simple uniaxial testing in tension provides invaluable information, glasses fracture at stresses below their yield strength due to the existence of surface defects. Hence, it is necessay to carry out constrained tests such as hydrostatic compression or indentation to circumvent these issues. The pressure-induced densification process has been recently described [29] and it was shown that one must take into account a number of mechanisms to correctly match the experimental data, namely a threshold for densification, an increase in pressure upon densification, a saturation of densification and an increase in elastic moduli upon densification. Since heterogeneous and multi-axial stress fields develop underneath the indenter, it is necessary to use numerical procedures to simulate the indentation test. Recently, numerical simulations of the indentation process were reported in the literature using constitutive equations and Finite-Element Modelling (FEM) [30, 31, 32, 33], Discrete Element Modelling (DEM) [34] or Molecular Dynamics (MD) simulations [35, 36]. The second aim of this paper is to use the experimental results generated by the dissolution technique to test the validity of the constitutive models [30, 31, 32]. This is addressed in Sections 4 and 5.
2 Experimental methods
2.1 Material and indentation procedures
A commercial silica glass (SiO 99.6 mol %, SpectrosilTM) from Saint Gobain company (France) was used in this study. The glass surface was polished with cerium oxide, and subsequently annealed for 2 h at the glass transition temperature (Tg, 1100˚C). The mass density of the glass after annealing was =2.2 g/cm3. One pristine (indentation free) sample of the glass was retained for the dissolution rate measurements in its relaxed state.
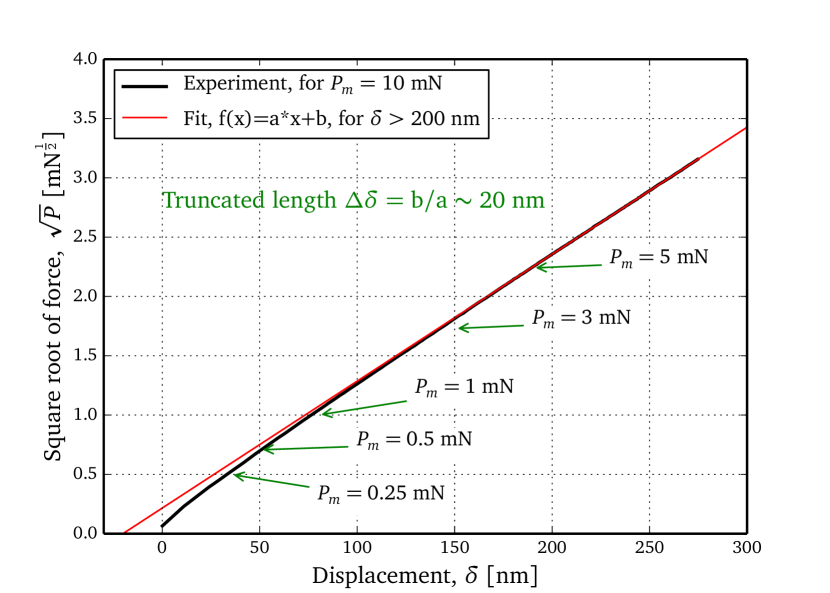
Instrumented indentation tests were carried out with a nano-indenter testing device (TI950, Hysitron, USA) at ambient conditions (23˚C and 55% relative humidity). The indenter tip is a modified Berkovich diamond pyramid. Both AFM imaging and a standard indenter tip calibration method on a fused quartz standard sample [37] lead to an indenter tip radius value of about 260 nm. Another way to qualify the bluntness of the tip is to calculate a truncated length [38]. The mechanical response of the indentation test is the force vs. the displacement (counted positively). The truncated tip defect length, , is obtained by plotting vs. for the fused quartz reference sample during the loading stage (increasing ). This curve should be linear with its origin at (0,0) for a perfect tip (self similarity of sharp indentation, see e.g. [28]). This is not the case for shallow depths below 50 nm, so was calculated by taking the intercept of a linear fit of this curve for high values of , as seen in Figure 1. is found to be 20 nm.
Nano-indentation tests were carried out using a commercial apparatus (Hysitron, TI950) on a dedicated sample, with a ’10-10-10’ loading sequence: 10 s to reach the maximum load , 10 s of holding time, and 10 s to unload the sample’s surface. They were load-controlled and the values ranged from 250 N to 10 mN. The maximum and residual displacements are referred to as and , respectively. Due to the high reproducibility of the nano-indentation test on the glass surface, five indents per chosen maximum load were performed. All imprints, as imaged by AFM, were free of corner cracks.
2.2 Chemical dissolution technique
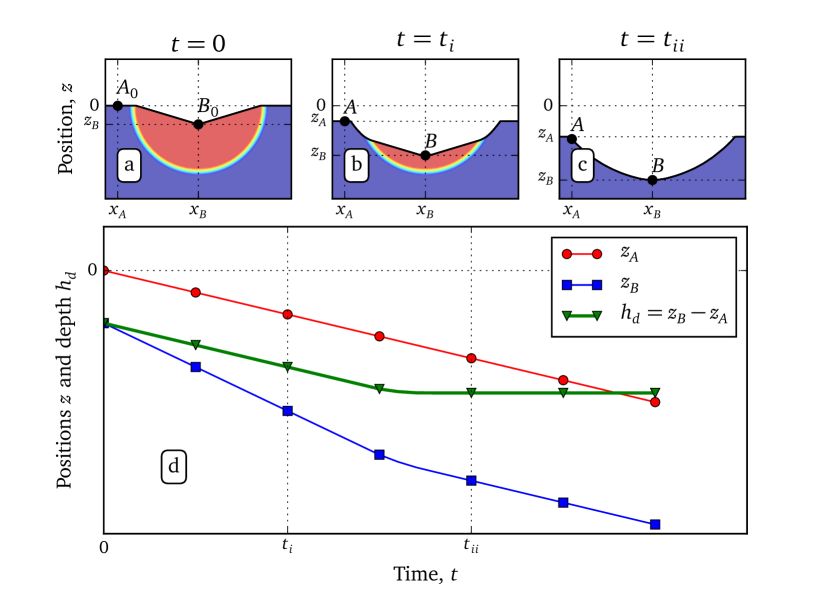
Each indented glass sample was immersed in a TeflonTM container filled with 50 mL of a 0.1 N NaOH solution heated to 80˚C. The temperature was kept at 0.5˚Cin a thermally regulated furnace. The prepared solution was divided into two separate containers for the indented and indent-free samples, respectively. The latter was used to compute the dissolution rate V0 by the weight loss method. Those conditions allowed one to avoid saturation conditions throughout dissolution, as confirmed from the linear trend of the weight mass loss of the sample versus dissolution time [26]. The indented samples immersed in the alkaline solution were taken out periodically (every half to one hour) and rinsed consecutively with deionized water and ethanol prior to carrying out AFM. AFM measurements made it possible to record the three-dimensional geometry of the imprint after each dissolution stage. Images were captured with the tapping mode of the AFM (Bruker, Nanoscope V, USA) equipped with silicon tips (TAP 300 Al) which apical angle is 70° and the tip radii are no larger than 10 nm. Due to both a smaller tip radius and a sharper apical angle, when compared to that of the indenter, the geometry of the imprint was not altered by the finite size and geometry of the AFM probe tip. Prior to carrying out any measurements, the AFM was calibrated with several grids: a 10 m pitch of 200 nm deep squared holes and a 3 m pitch of (231) nm deep engraved features (TGZ1). Moreover, to limit the effect of typical AFM artifacts on the measurements such as thermal drift and piezo creep, thermal equilibrium of the system was established (about 2 h) before capturing an image. The size of the scanned area was large enough so that a sufficient area unaffected by the indentation process exists and may be used as a reference surface (i.e., set to zero tilt and zero offset). For each loading condition, the topography of three to five indentation imprints were recorded by AFM as a function of dissolution time. Following the technique described in Ref. [26], we focus on the evolution of the depth of the residual indentation imprint as a function of dissolution time. For a clearer understanding of the process, a schematic is given in Figure 2. The sample is shown in Fig. 2 (a) after indentation with a residual imprint of depth equal to . Two points of interest are labelled A0 and B0, respectively, and their relative height is monitored by AFM ( = ). As shown in Fig. 2 (b,c), throughout the dissolution process, A0 and B0 move to A () and B (), respectively, with the residual indentation imprint depth at dissolution time being expressed as (and further referred to as the dissolution depth):
| (1) |
Thus, at time (no dissolution), and for dissolution times , because of the enhanced dissolution rate of the densified zone (colored zone) that was generated during the indentation process. Since the dissolution rate is constant over time for A, its position, from the initial point A0 at the free surface (), at dissolution time , is known via (). Therefore, the position of point B with respect to that of the initial free surface () is expressed as:
| (2) |
The first term is evaluated by determining with the loss weight method on the pristine (indent-free) sample and the second term is measured by AFM via Eq. (1).
2.3 Dimensional analysis of the dissolution process
Dimensional analysis [39] has been used by Cheng et al. [28] to establish key relationships between material properties, indenter geometry and load vs. displacement curves produced by sharp indentation. In this part, we extend this approach to the dissolution of the residual imprint in order to establish a similitude rule between two tests carried out on the same sample with different loads.
First, several assumptions are required. The indenter is a perfect pyramid or a cone so that its geometry only relies on a set of angles . The indenter’s constitutive material is homogeneous, isotropic and elastic so that its behavior depends only on its Young’s modulus and its Poisson’s ratio . The sample is an homogeneous, time independent material for which the elastic behavior is described by the Young’s modulus and Poisson’s ratio . Its inelastic behavior is controlled by a set of yield strengths [] (corresponding to pure shear, uniaxial tension, hydrostatic compression…) and a set of dimensionless additional parameters that controls the additional mechanisms such as hardening-like events. The local dissolution rate of the sample’s material is in its pristine state and after densification. The ratio is a dimensionless function which is assumed to depend only on a set of dimensionless parameters (such as the densification state…).
Then, dimensional analysis [28] allows us to establish a linear relationship between and , by introducing a dimensionless function of dimensionless arguments:
| (3) |
We now compare two imprints: a first one performed at the highest maximum force considered as the reference and a second one made at a lower maximum force . According to Eq. (3), the depths of the corresponding residual imprints during the dissolution process are indeed different but verify:
| (4) |
For a given value of , we now consider a specific value of :
| (5) |
As a consequence:
| (6) |
Therefore, we define an equivalent dissolution time, , and an equivalent dissolution depth, , to retrieve the information of the reference test "1" thanks to the information of the other test "2". They are thus calculated as:
| (7) |
As a consequence, one can rescale data for different maximum forces () w.r.t. a reference force (), using an equivalent dissolution time and an equivalent dissolution depth, as found in Eq. (7), i.e. by multiplying the raw time and depth experimental data by the rescaling factor . It makes it possible to extract complementary data from multiple indentation-dissolution tests and increase drastically the precision of the method. However, this similitude rule relies on the fact that the indentation tests are performed in the self similar regime. This is possible only because the indenter is assumed to be a perfect pyramid which has no intrinsic length scale. In order to apply this rule experimentally, one has to deal with the defects of the tip of the indenter. It is shown in [38] that if the test is performed at high enough penetration depths w.r.t. the truncated length , the self similar regime exists and the only impact of the tip defect is a shift of the penetration by . Figure 1 shows that the experimental value of is nm. Hence, all penetration depths reported hereafter are shifted by to remove (at least partially for very low loads, as discussed in the next Section) the effect of truncated length.
3 Experimental results
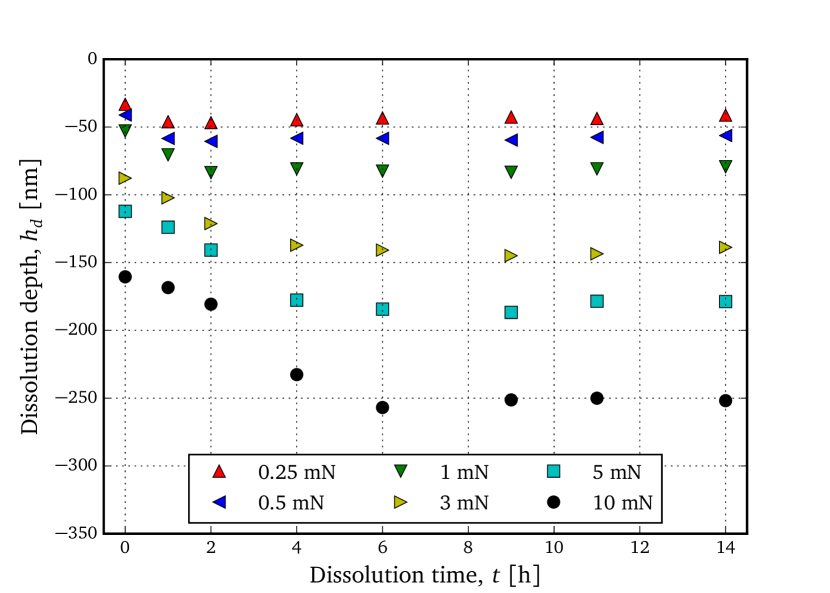
The weight loss method on the pristine glass sample (indent-free) gives a dissolution rate of V nm/h. Figure 3 reports, for indentation maximum loads ranging from 0.25 mN to 10 mN, the evolution of dissolution depths () as a function of dissolution time. Regardless of , the curves exhibit similar behavior. In the first zone, referred hereafter as Region I, the depth of the residual imprint (its absolute value) increases with dissolution time. It means that, in this region, the dissolution is faster than that of the free surface far from the imprint. For longer dissolution times, a second zone referred herafter as Region II, is characterized by a plateau, for which the imprint depth remains constant. It was shown in Ref. [26] that the boundary between Region I and II is directly linked to the transition between the densified zone and the non-densified material and may be used later as a good estimate for computing the thickness of the glass affected by the permanent deformation under a residual indentation imprint. For experimental reasons the same dissolution step was used for all the loads. Unfortunately, this choice has a strong impact on the fitting of Region I as a lack of data points is noticeable at low loads (see Fig. 3).
To circumvent this problem we use the similitude principle described in Section 2.3. We therefore rescale both axes of Fig. 3, using Eq. (7), taking the maximum load = 10 mN as a reference. Figure 4 presents these results. It is clear that, in most cases, the data points collapse into a single curve presenting the two regions defined previously. However, there are two notable exceptions at low loads of 0.25 and 0.5 mN. This is not surprising since, as highlighted in Figure 1, for low loads (and hence low displacements), we are not in the similitude regime. Shifting data by 20 nm solves only partially this situation (see Fig. 1). This situation disappears as the displacement increases. In other words, the higher the displacement induced by the indentation and/or the higher the dissolution depth, the closer we are to this similitude regime. It is illustrated in Figure 3 that, for high dissolution times (rescaled w.r.t. to the 10 mN reference load), the data from the indentations performed at 0.25 and 0.5 mN will follow the trend of the other loads. Nevertheless, we have removed these two data sets from our further analysis.
Region I was fitted by a least squares linear regression. This indicates that, in this region, the increase in dissolution rate is rather homogeneous and is found to be = 16.7 0.9 nm/h. Region II was fitted by a plateau value of 257 5 nm. These fits are superimposed on the data in Figure 4 together with confidence intervals (within one standard deviation) shaded for clarity. Such a plot allows us to calculate the intercept between the confidence intervals of Region I and Region II to get a confidence interval of the dissolution time required to reach the plateau, i.e. h.
These extended results makes us assume that the densification zone (Region I) is rather homogeneous followed by a steep transition to the non-densified zone. Hence, we can estimate the depth of the indentation depth corresponding to the plateau of Region II. Indeed, knowing the dissolution rate of the free surface (point in Fig. 2) we can estimate the depth dissolved at time to be 282 nm. By adding the dissolution depth plateau value, , we find, according to Eq. (1), that the position of the boundary of the densified zone along the vertical axis lies at 539 nm. With respect to it gives -1.88. All these data are reported in Table 1.
4 Numerical calculations
The experimental data reported in section 3 will be used to compare with numerical simulations of the indentation process for some selected constitutive equations.
4.1 Constitutive equations
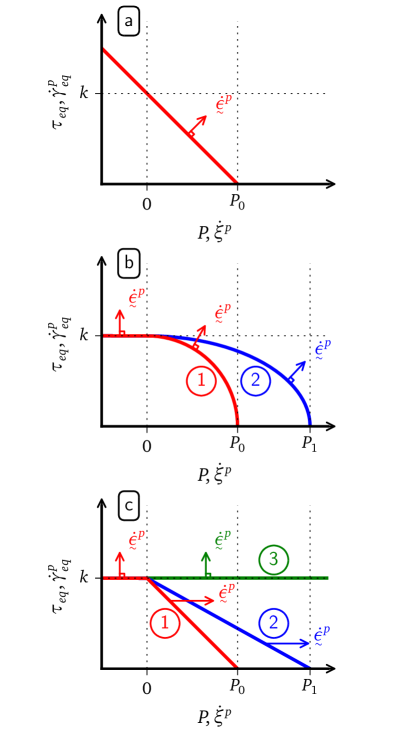
We have selected three different constitutive equations used over the past 15 years for describing the indentation process in silica glass. We describe briefly their salient features with the aid of Figure 5 and the classical notations of modern continuum mechanics. All models111We leave the Reader with Refs. [30, 31, 32, 29] for the details of the models as well as the values of the materials parameters. are rate-independent and use a yield criterion and a flow rule. The former is plotted in the equivalent shear (, is the deviatoric part of the Cauchy stress tensor) - pressure (P) plane. The latter (the direction of the plastic strain rate ) is superimposed in the equivalent isochoric shear plastic strain rate () vs densification rate () plane. For all models, in pure hydrostatic conditions (), densification occurs at a given pressure P0. The first model (see Fig. 5 (a)) is that of Lambropoulos et al. [40]; the yield criterion is linear and ressembles that of Drucker-Prager used for soils and sometimes metallic glasses but with an opposite contribution of pressure [41, 42]. The flow rule is associated (normality rule w.r.t. the yield surface) so that both densification () and shear flow () develop at the same magnitudes whatever the stress state (, P). The second model (see Fig. 5 (b)) is that of Kermouche et al. [31]; the yield criterion is elliptic for positive pressures (red line) and is modified by the increase in pressure upon densification (blue line). The flow rule is associated so that both densification () and shear () develop depending on the stress state, with extremes being at P=0 where only plastic shear develops and where only densification develops. The third model (see Fig. 5 (c)) is a slight modification of a recent model proposed in Ref. [32]. It is a sequential model, where the plastic flow is non associated (the direction of is not normal to the yield surface). The initial linear yield surface is represented in red. It is modified by the increase in pressure upon densification up to the saturation in densification (represented in blue). In between these two yield surfaces, only pure densification develops. After saturation, the behaviour is again elastic till reaching the green yield locus, corresponding to a von Mises material, therefore developing only shear (isochoric) plastic strains.
The different constitutive equations have been implemented in the FEM software AbaqusTM (Simulia, France) using a UMAT subroutine. These implementations have been tested and validated with the material parameters and the exact simulation conditions described in Refs [29, 30, 31, 32]. The only new material parameter is for the shear yield strength, k, for the third model. The material and geometrical non linearities are taken into account using a finite strain framework.
4.2 Finite element analyses
FEM simulations of the indentation process were performed using a two-dimensional axisymmetric model with a sample and an indenter. The sample is decomposed into a core zone, underneath the indenter tip, where the mesh is fine, and a shell zone where the mesh is coarse. The core zone is itself decomposed into a square zone with 32x32 square elements and a outer zone with quadrangle elements (32 again along the axis ). The shell zone is decomposed into a transition zone and a outer zone, both with quadrangle elements. All elements are linear. The dimensions of the mesh are chosen to minimize the effect of the far-field boundary conditions. This is made by using a sufficient number of outer elements in the shell zone. The typical ratio of the maximum contact radius and the sample size is about . The indenter is considered as a perfect cone exhibiting an half-angle to match the theoretical projected area function of the modified Berkovich indenter. Its mesh is the same as that of the sample with a geometrical transformation accounting for the geometry of the indenter. The indenter material is assumed to be isotropic, linear elastic (Poisson’s ratio of 0.07 and Young’s modulus of 1100 GPa). The contact between the indenter and the sample’s surface is strict (Signorini conditions) and taken as frictionless. The contact zone will take place along the square elements of the core zone. The boundary conditions consist of a null radial displacement along the vertical axis for both the sample and the indenter and a null displacement on the outer nodes of the sample. The displacement of the indenter, (taken as positive), is controlled and the force on the indenter, , is recorded. The experimental maximum displacement of the 10 mN experiment is used. The problem is solved using the commercial software ABAQUSTM (version 6.10). The pre- and post-processing tasks were made with Abapy [43].
5 Numerical results
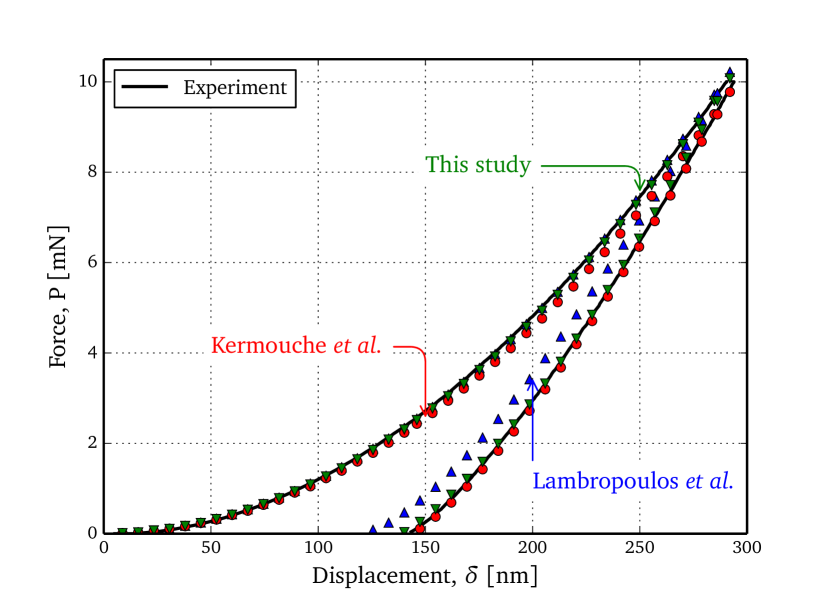
The force-displacement curves – for the three models are shown in Figure 6 along with the experimental results. The latter have been shifted to the right by = 20 nm, the truncated length, to account for the blunted indenter (see Section 2.1). In other words, it gives the mechanical response of the experimental data had the indenter been perfect (for depths greater than 2-3 ). Overall, the numerical results of all models show very close agreement with the experimental data, although the model of Lambropoulos et al. does not match exactly the experimental curve. This is in contrast with the results from Ref. [30] and is explained by the 20 nm shift of the data. For the model of Kermouche et al., there is a close match with the experimental data and it does not suffer from the 20 nm shift since, in their work, high indentation loads ( = 2 m) were used for parameter identification so that this shift does not play a crucial role (for the first model, = 500 nm). For the final model, the fit to the data is also is very close. It was made for a shear yield strength (see Fig. 5) k= 6.5 GPa to approximatively match the curve, and we did not try to make the comparison more precise.
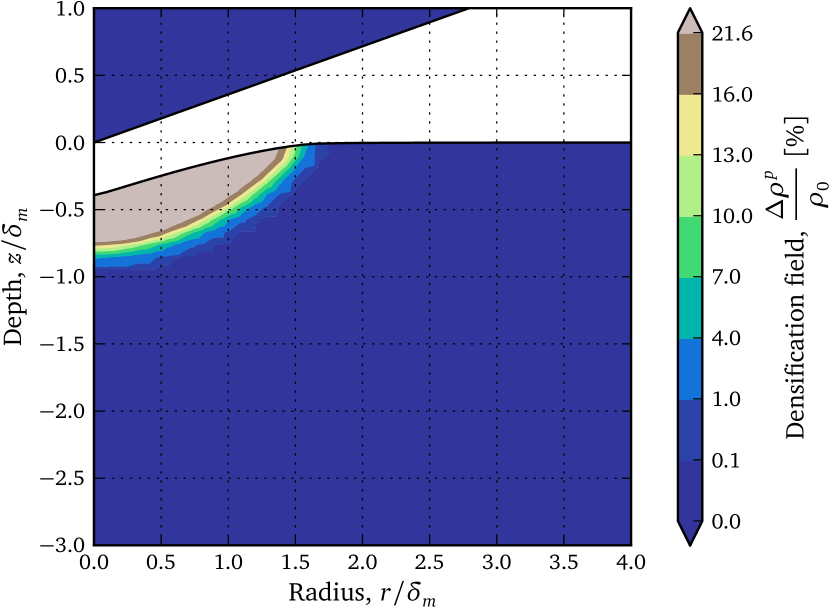
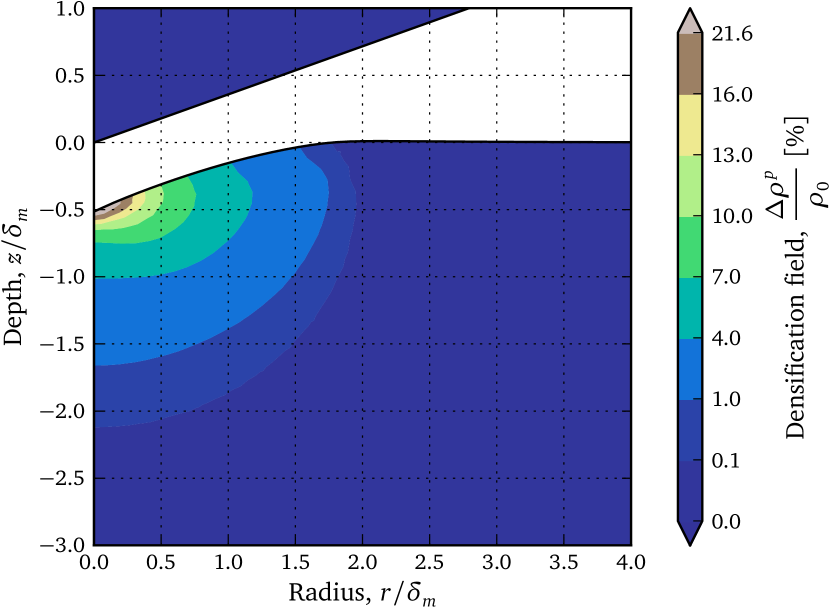
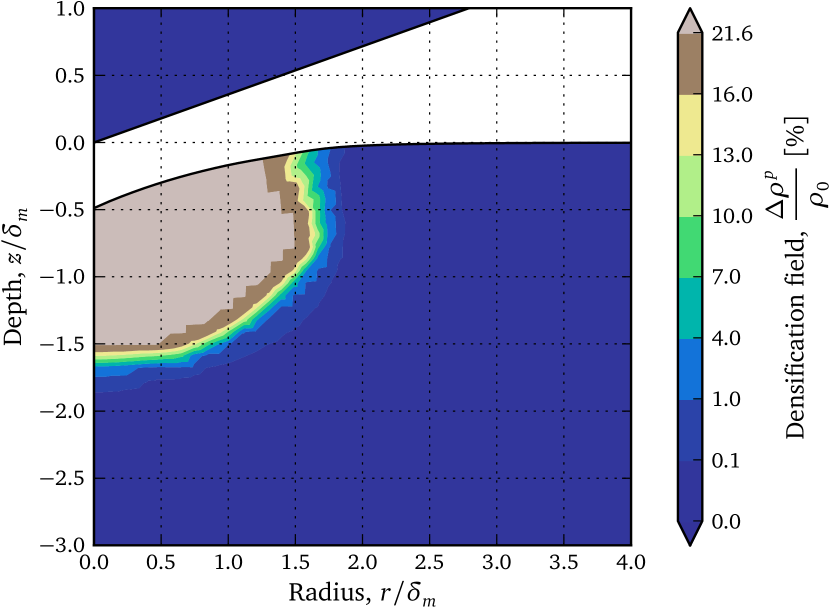
The densification field underneath the indentation imprint, after unloading, is shown for all models in Figures 7 to 9. The densification levels are presented with a non linear scale from 0 (no densification) to 21.6% (saturation in densification). Two colors (blue and light brown) indicate no densification or values above the saturation level, respectively. The latter can be due to the model that does not account for saturation (Fig. 7 and 8), extrapolation from integration points to nodes or heavily distorted elements. In the following, we take the isovalue of 0.1 % in densification as the boundary of the densification zone. The model of Lambropoulos et al. describes a densification zone that extends up to 0.9 . It is not an homogeneous zone since the model does not account for saturation in densification. The extrapolated values at nodes, heavily distorted elements underneath the indenter tip gave unrealistic maximum densification values of more than 100%. The model of Kermouche et al. describes a densification zone that extends up to 2.1 . Inside this zone the densification is not homogeneous and there is a smooth gradient from underneath the indenter tip to the non-densified zone. While this model does not account for the saturation in densification, it has a negligible impact on the densification fields (only two elements have densification values above the experimental value). In contrast, the sequential model reveals the existence of a very homogeneous densified zone (due to extrapolation at nodes the maximum densification value is found to be 21.68%, slightly above than the maximum densification ratio of 21.6%.) Moreover, there is a sharp transition from the fully densified to non-densified zones at 1.6-1.8 along the vertical axis. These ratios for all models are presented in Table 2 along with experimental results from both the literature and the present study.
6 Discussion
The three selected constitutive models are shown to reproduce accurately the mechanical response of the indentation test, i.e. the force–displacement curve, although there are significant differences between models. In other words, matching the experimental - is necessary but not sufficient. This known fact has led researchers to compare their simulation results with enlarged experimental databases in silica glass. In particular, Perriot et al. [18] used Raman micro-spectrometry ( = 20 N, =14.5 m, 5 m mapping-spacing) to determine a size of the densified zone of 1.65 w.r.t. to (isoline at 2% densification), which is very consistent with the present results (see Table 2). It is pertinent to note that only 4-5 measurement points were reported close to and along the -axis in the densified zone. Hence, it is difficult to make definitive conclusions about both the homogeneity of the densified zone and the transition between the densified and the non-densified zones ( 1 in terms of was reported) for comparing with our experimental results.
The model of Lambropoulos et al. [40] clearly does not reproduce the experimental observations underneath the imprint in terms of the size of the densification zone. The model of Kermouche et al. [31] predicts a much larger densification zone size compared with our experimental results, and the actual densification zone of the model shows smooth gradients in permanent volume changes. It is worth noting that we have also tested this model with a modification taking into account the salient features of pressure-induced densification [29]. While slightly modifying the - curve it also predicts a densification zone with smooth gradients but with a larger size ( 2.3 ). The last model (referred to as sequential) predicts a very homogeneous densification zone with a sharp transition between 1.6-1.8 .
As seen in Fig. 5 c, the sequential model favors mostly the contribution of the densification process as the principal cause for the indentation imprint in silica glass. This in total agreement with previous indentation studies indicating that silica glass deforms mostly (if not only) by densification, whereas silicate glasses deform by both densification and shear flow [4, 5, 10, 7] for indenters like Vickers or Berkovich. The sequential model can also account for recent experimental results on micro-pillars where a compressive yield strength of 7 GPa was extracted [44]. Indeed, the model predicts 8 GPa.
Other numerical methods have also been recently used to simulate the indentation process in silica glass. A DEM study accounting for the sole pressure-induced densification was reported [34]. It describes a huge densification zone ( 10 ) with very smooth densification gradients) and clearly requires the consideration of shear into the permanent deformation mechanisms, as pointed out by the authors. MD simulations have also been carried out [35, 36] employing different modifications of the BKS pair potential, as well as different indenter geometries. For the former (3D Vickers indentation), it is rather difficult, from the data presented, to conclude on a homogeneous densification zone and on its size. Meanwhile, the authors state that the process zone is smaller than 80 Å ( Å) giving a boundary smaller than a ratio of 2.5. For the latter, 2D indentation simulations were carried out with very sharp wedges (60°and 90°). The densification zone looks very homogeneous with a sharp transition between this zone and the non-densified one. Due to the huge difference in tip geometry, one cannot compare the densification zone with the experimental results described in this paper.
For pressure levels lower than 25 GPa, the permanent deformation mechanisms seem to have been correctly assessed [29] under pure hydrostatic conditions, but the critical role of shear is far from being elucidated in other situations. From the different models presented in this paper (see Fig. 5), it is obvious that the interplay between the driving forces (shear, pressure) and the dissipative mechanisms (isochoric plastic strains and densification) can be described very differently. There is therefore a strong need of experimental evidence for loading paths (in the shear-pressure plane) for discriminating among models. The recent work on micro-pillars [44] is a good example, but the now classical instrumented indentation technique is still heavily employed. Indeed, the multi-axial and heterogeneous stress fields underneath the indenter tip generate different loading paths, which provides a wealth of information. The development of this chemical dissolution technique is therefore a major contributor for increasing the experimental database to discriminate among models, whether they are constitutive equations, DEM or MD simulations [45].
7 Concluding remarks
A chemical dissolution technique was employed to investigate the densification process underneath an indentation imprint in silica glass. It relies on an higher dissolution rate for densified areas w.r.t. non densified ones. This technique allows one to extract high spatial resolution information, even for low-loads indentation tests carried out to avoid the onset of spurious cracking events, in contrast to micro-spectroscopy techniques including Raman and Brillouin. Taking into account the self similarity of the sharp indentation process made it possible to considerably extend the soundness of preliminary results [26]. It is found that the densification zone is very homogeneous (in terms of densification levels) along the vertical axis and extends up to 1.9 the maximum indentation depth with steep densification gradients between this zone and the non-densified one. These new experimental data have been used for discussing the results of existing numerical simulations of the indentation process in silica glass, including Molecular Dynamics, Discrete Element Modeling and Finite Element Modeling. In particular, selected constitutive equations for silica glass from the literature have been used and the results of numerical simulations show some of their positive aspects as well as some shortcomings. Nevertheless, a constitutive model able to correctly address the experimental findings of this paper, favors the densification process as the main one responsible for the creation of an imprint under Vickers or Berkovich indentation tests, in agreement with many previous experimental studies. Further developments including the reconstruction of the densified zone in three dimensions, and particularly the transition region, are currently under progress to pave the way for advanced modeling of the mechanical response of amorphous silica to surface damage, as well as of silicate glasses.
Acknowledgements
VK would like to thank financial support from University of South-Brittany (CRCT) and University of New South-Wales for a sabbatical leave, as well as discussions with Dr. P. Pilvin. JPG would like to thank the ANR for supporting a part of this work through the grant ANR-07-JCJC-037 as well as the Ministry of higher education for the PhD grant of KH.
References
References
- Proctor et al. [1967] B. A. Proctor, I. Whitney, J. W. Johnson, The Strength of Fused Silica, 1967. doi:10.1098/rspa.1967.0085.
- EN5 [????] EN 572-2 (2004). Glass in building - Basic soda lime silicate glass products. Part 2: Float glass. European Norm., ????
- Grenet [1889] L. Grenet, Recherches sur la résistance mécanique des verres, Bull. Soc. Encour. Ind. Nat. 4 (1889) 838–848.
- Ernsberger [1968] F. M. Ernsberger, Role of Densification in Deformation of Glasses Under Point Loading, J. Am. Ceram. Soc. 51 (1968) 545–547.
- Peter [1970] K. Peter, Densification and flow phenomena of glass in indentation experiments, J. Non. Cryst. Solids 5 (1970) 103–115.
- Hagan [1980] J. T. Hagan, Shear deformation under pyramidal indentations in soda-lime glass, J. Mater. Sci. 15 (1980) 1417–1424.
- Yoshida et al. [2005] S. Yoshida, J.-C. Sangleboeuf, T. Rouxel, Quantitative evaluation of indentation-induced densification in glass, J. Mater. Res. 20 (2005) 3404–3412.
- Rouxel et al. [2010] T. Rouxel, H. Ji, J. P. Guin, F. Augereau, B. Rufflé, Indentation deformation mechanism in glass: Densification versus shear flow, J. Appl. Phys. 107 (2010) 094903.
- Yoshida et al. [2010] S. Yoshida, H. Sawasato, T. Sugawara, Y. Miura, J. Matsuoka, Effects of indenter geometry on indentation-induced densification of soda-lime glass, J. Mater. Res. 25 (2010) 2203–2211.
- Kurkjian et al. [1995] C. R. Kurkjian, G. W. Kammlott, M. M. Chaudhri, Indentation Behavior of Soda-Lime Silica Glass, Fused Silica, and Single-Crystal Quartz at Liquid Nitrogen Temperature, J. Am. Ceram. Soc. 78 (1995) 737–744.
- Bridgman and Simon [1953] P. W. Bridgman, I. Simon, Effects of Very High Pressures on Glass, J. Appl. Phys. 24 (1953) 405–413.
- Cohen and Roy [1961] H. M. Cohen, R. Roy, Effects of Ultra high Pressures on Glass, J. Am. Ceram. Soc. 44 (1961) 523–524.
- Christiansen et al. [1962] E. B. Christiansen, S. S. Kistler, W. B. Gogarty, Irreversible Compressibility of Silica Glass as a Means of Determining the Distribution of Force in High-pressure Cells, J. Am. Ceram. Soc. 45 (1962) 172–177.
- Mackenzie [1963] J. D. Mackenzie, High-Pressure Effects on Oxide Glasses: I, Densification in Rigid State, J. Am. Ceram. Soc. 46 (1963) 461–470.
- Ji et al. [2006] H. Ji, V. Keryvin, T. Rouxel, T. Hammouda, Densification of window glass under very high pressure and its relevance to Vickers indentation, Scr. Mater. 55 (2006) 1159–1162.
- Rouxel et al. [2008a] T. Rouxel, H. Ji, V. Keryvin, T. Hammouda, S. Yoshida, Poisson’s Ratio and the Glass Network Topology - Relevance to High Pressure Densification and Indentation Behavior, Adv. Mater. Res. 39-40 (2008a) 137–146.
- Rouxel et al. [2008b] T. Rouxel, H. Ji, T. Hammouda, A. Moréac, Poisson(s Ratio and the Densification of Glass under High Pressure, Phys. Rev. Lett. 100 (2008b) 225501.
- Perriot et al. [2006] A. Perriot, D. Vandembroucq, E. Barthel, V. Martinez, L. Grosvalet, C. Martinet, B. Champagnon, Raman Microspectroscopic Characterization of Amorphous Silica Plastic Behavior, J. Am. Ceram. Soc. 89 (2006) 596–601.
- Hehlen [2010] B. Hehlen, Inter-tetrahedra bond angle of permanently densified silicas extracted from their Raman spectra., J. Phys. Condens. Matter 22 (2010) 025401.
- Kassir-Bodon et al. [2012] A. Kassir-Bodon, T. Deschamps, C. Martinet, B. Champagnon, J. Teisseire, G. Kermouche, Raman Mapping of the Indentation-Induced Densification of a Soda-Lime-Silicate Glass, Int. J. Appl. Glas. Sci. 3 (2012) 29–35.
- Deschamps et al. [2013] T. Deschamps, A. Kassir-Bodon, C. Sonneville, J. Margueritat, C. Martinet, D. de Ligny, A. Mermet, B. Champagnon, Permanent densification of compressed silica glass: a Raman-density calibration curve, J. Phys. Condens. Matter 25 (2013) 025402.
- Tran et al. [2012] H. Tran, S. Clément, R. Vialla, D. Vandembroucq, B. Rufflé, Micro-Brillouin spectroscopy mapping of the residual density field induced by Vickers indentation in a soda-lime silicate glass, Appl. Phys. Lett. 100 (2012) 231901.
- Hagan [1979] J. T. Hagan, Cone cracks around Vickers indentations in fused silica glass, J. Mater. Sci. 14 (1979) 462–466.
- Rouxel et al. [2004] T. Rouxel, J.-C. Sangleboeuf, J.-P. Guin, V. Keryvin, G.-D. Soraru, Surface Damage Resistance of Gel-Derived Oxycarbide Glasses: Hardness, Toughness, and Scratchability, J. Am. Ceram. Soc. 84 (2004) 2220–2224.
- Charleux et al. [2014] L. Charleux, V. Keryvin, M. Nivard, J.-P. Guin, J.-C. Sangleboeuf, Y. Yokoyama, A method for measuring the contact area in instrumented indentation testing by tip scanning probe microscopy imaging, Acta Mater. 70 (2014) 249–258.
- Niu et al. [2012] Y.-F. Niu, K. Han, J.-P. Guin, Locally enhanced dissolution rate as a probe for nanocontact-induced densification in oxide glasses., Langmuir 28 (2012) 10733–40.
- Deschamps et al. [2011] T. Deschamps, C. Martinet, J. L. Bruneel, B. Champagnon, Soda-lime silicate glass under hydrostatic pressure and indentation: a micro-Raman study., J. Phys. Condens. Matter 23 (2011) 035402.
- Cheng and Cheng [2004] Y. T. Cheng, C. M. Cheng, Scaling, dimensional analysis, and indentation measurements, Mater. Sci. Eng. R Reports 44 (2004) 91–150.
- Keryvin et al. [2014] V. Keryvin, J.-X. Meng, S. Gicquel, J.-P. Guin, L. Charleux, J.-C. Sangleboeuf, P. Pilvin, T. Rouxel, G. Le Quilliec, Constitutive modeling of the densification process in silica glass under hydrostatic compression, Acta Mater. 62 (2014) 250–257.
- Xin and Lambropoulos [2000] K. Xin, J. C. Lambropoulos, Densification of Fused Silica : Effects on Nanoindentation, in: A. J. Marker III, E. G. Arthurs (Eds.), Inorg. Opt. Mater. II, volume 4102, SPIE, San Diego, CA, USA, 2000, pp. 112–121. URL: http://proceedings.spiedigitallibrary.org/proceeding.aspx?articleid=916528. doi:10.1117/12.405275.
- Kermouche et al. [2008] G. Kermouche, E. Barthel, D. Vandembroucq, P. Dubujet, Mechanical modelling of indentation-induced densification in amorphous silica, Acta Mater. 56 (2008) 3222–3228.
- Keryvin et al. [2014] V. Keryvin, S. Gicquel, L. Charleux, J. P. Guin, M. Nivard, J. C. Sangleboeuf, Densification as the Only Mechanism at Stake during Indentation of Silica Glass?, Key Eng. Mater. 606 (2014) 53–60.
- Gadelrab et al. [2012] K. Gadelrab, F. Bonilla, M. Chiesa, Densification modeling of fused silica under nanoindentation, J. Non. Cryst. Solids 358 (2012) 392–398.
- Jebahi et al. [2013] M. Jebahi, D. André, F. Dau, J.-L. Charles, I. Iordanoff, Simulation of Vickers indentation of silica glass, J. Non. Cryst. Solids 378 (2013) 15–24.
- Kilymis and Delaye [2013] D. A. Kilymis, J. M. Delaye, Nanoindentation of pristine and disordered silica: Molecular Dynamics simulations, J. Non. Cryst. Solids 382 (2013) 87–94.
- Yuan and Huang [2014] F. Yuan, L. Huang, Brittle to ductile transition in densified silica glass., Sci. Rep. 4 (2014) 5035.
- Oliver and Pharr [2004] W. Oliver, G. Pharr, Measurement of hardness and elastic modulus by instrumented indentation: Advances in understanding and refinements to methodology, J. Mater. Res. 19 (2004) 3–20.
- Loubet et al. [1984] J. L. Loubet, J. M. Georges, O. Marchesini, G. Meille, Vickers Indentation Curves of Magnesium Oxide (MgO), J. Tribol. 106 (1984) 43.
- Buckingham [1915] E. Buckingham, The Principle of Similitude, Nature 96 (1915) 396–397.
- Lambropoulos et al. [1996] J. C. Lambropoulos, S. Xu, T. Fang, Constitutive Law for the Densification of Fused Silica, with Applications in Polishing and Microgrinding, J. Am. Ceram. Soc. 79 (1996) 1441–1452.
- Keryvin [2008] V. Keryvin, Indentation as a probe for pressure sensitivity of metallic glasses, J. Phys. Condens. Matter 20 (2008) 114119.
- Keryvin et al. [2008] V. Keryvin, R. Crosnier, R. Laniel, V. H. Hoang, J.-C. Sangleboeuf, Indentation and scratching mechanisms of a ZrCuAlNi bulk metallic glass, J. Phys. D. Appl. Phys. 41 (2008) 074029.
- Charleux et al. [2015] L. Charleux, V. Keryvin, L. Bizet, abapy: Abapy_v1.0, 2015. doi:10.5281/zenodo.17784.
- Lacroix et al. [2012] R. Lacroix, G. Kermouche, J. Teisseire, E. Barthel, Plastic deformation and residual stresses in amorphous silica pillars under uniaxial loading, Acta Mater. 60 (2012) 5555–5566.
- Mantisi et al. [2012] B. Mantisi, A. Tanguy, G. Kermouche, E. Barthel, Atomistic response of a model silica glass under shear and pressure, Eur. Phys. J. B 85 (2012) 304.
| [nm] | [nm] | [h] | [nm] | [nm] | [nm] | [-] |
|---|---|---|---|---|---|---|
| Experiments | Numerical simulations (this study) | ||||
| Raman [18] | This study | Lambropoulos et al. | Kermouche et al. | Sequential model | |
| [-] | 1.65 | 1.88 | 0.9 | 2.1 | 1.8 |