Characterization of the Aging and Excess Noise of a Hamamatsu Fine Mesh Photopentode
Abstract
The excess noise factor and the aging characteristics of 16 Hamamatsu R11283 photopentodes have been tested. These fine-mesh phototubes are to be paired with pure CsI scintillation crystals considered for use in the endcap calorimeter of the Belle II detector. The average excess noise factor was found to be . The electronic noise of a custom preamplifier produced by the University of Montreal was found as a consequence of this measurement and was electrons, in agreement with previous values. On average, the gain quantum efficiency was reduced to % of the initial value after passing an average of C through the anode. This corresponds to 70 years of standard Belle II operation.
keywords:
Hamamatsu , Photomultiplier , Mesh , CsI , Belle II , Aging1 Introduction
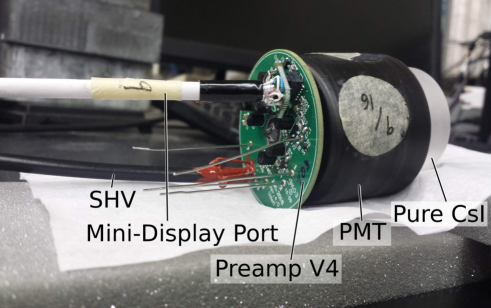
One of the upgrade considerations for the Belle II detector, situated at KEK in Tsukuba, Japan, is to replace the current thallium-doped cesium iodide (CsI(Tl)) scintillation crystals in the endcap electromagnetic calorimeter (ECL) with pure CsI [2]. A primary goal of this exchange is to reduce pileup due to the increased luminosity of the SuperKEKB accelerator. While pure CsI has a shorter scintillation time constant, it also has a reduced light yield, with the emission spectrum peaking in the UV range rather than in the visible range [3, 4]. Therefore, the new crystals will need new photosensors. Under consideration for the new photosensor is the R11283 photomultiplier tube (PMT), developed by Hamamatsu Photonics for this project. This model has five flying leads and for this reason is often referred to as a photopentode. The PMT is a head-on type with three fine mesh dynodes, UV transparent window, and a bialkali photocathode; similar to previously tested PMTs for CsI scintillation crystals, although this model is of much lower gain and has fewer dynodes [5]. The photocathode of the R11283 has a minimum effective diameter of mm, and a wavelength of maximum response of nm [6]. Pure CsI has an emission maximum at nm. The PMT is shown in Fig.3 1.
Magnetic fields decrease the performance due to changes in the inter-dynode electron path. These fine mesh PMTs will operate in the 1.5 T Belle II axial magnetic field, reducing the nominal gain by a factor of 3.5 [7]. The average nominal gain of the 16 PMTs at an operating voltage of V was . As summarized in Table 1, Hamamatsu provides a variety of measurements at V with purchase.
| Quantity | Average | Range |
|---|---|---|
| Anode Luminous Sensitivity (A/lm) | ||
| Cathode Luminous Sensitivity (A/lm) | ||
| Cathode Blue Sensitivity Index | ||
| Dark Current (nA) | ||
| Gain at V | ||
| Gain at V |
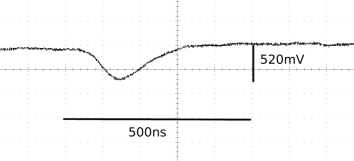
The PMT readout electronics were designed and produced by the University of Montreal [1] and consists of a preamp (version 4) and a shaper for every PMT. The preamp has a gain of V/pC and the shaper has a shaping time of 50 ns. For a step-function input, the signal produced by the shaper has a peaking time of ns. The combination of the two components produces a signal whose amplitude is proportional to the charge at the anode (Fig. 2). The board connected directly to the PMT (Fig. 1) houses both the voltage divider to power the PMT dynodes, and the preamp electronics. The shapers house and are powered by a motherboard which also provides the correct voltages to the preamp electronics.
Additional details on the measurements presented can be found in Ref. [8].
2 Methods
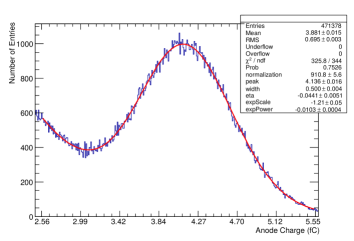
The shaper output was fed into a peak-sensing ADC (LeCroy L2259B) and the output was histogrammed using the MIDAS program [9]. The histogram was then fitted with the sum of an exponential and a Novosibirsk function. The exponential roughly describes the background, which was primarily due to backscatter. The Novosibirsk function is an asymmetric Gaussian-like function with four parameters: height, peak location, width, and an asymmetry parameter [10]. Fig. 3 shows an example of fitting this sum to the spectrum produced by the keV decay of 137Cs.
The response of the system to energy deposits in pure CsI is linear. Using several calibration sources, the value of the peak location at zero energy deposited was extrapolated and attributed to a DC offset in the peak-sensing ADC. This pedestal was then subtracted from the measurements prior to any further manipulation. The charge at the anode is proportional to the peak location, and the uncertainty to the width of this distribution. To calibrate the charge at the anode, the calibration test pulse feature of the preamp was used. This allows for a known amount of charge to be injected into the preamp, which is then processed as every other signal. From this calibration, the relationship between the ADC binning and the charge at the anode was found.
3 Excess Noise Factor
The excess noise factor is a common index for estimating the performance of photosensors [11]. This factor describes the uncertainty introduced into the system as a result of the electron multiplication process:
| (1) |
where the subscripts and denote the cathode and anode respectively. Measured at location , and are the number of electrons and the signal width respectively, as determined from the Novosibrisk fit. is the excess noise factor. Typically, the excess noise factor is larger for fine mesh PMTs than standard PMTs. Recognizing the Poisson nature of the photoelectrons and that the measured width at the anode contains contributions from both the constant electronic noise and the excess noise factor, Equation 1 can be written as:
| (2) |
where the internal PMT gain has been applied to put all relevant quantities in units of number of electrons at the photocathode (photoelectrons). Here, is the measured width at the anode and is the contribution of the electronic noise. From this, the excess noise factor can be easily found by varying the light intensity () and measuring the resulting distribution width ().
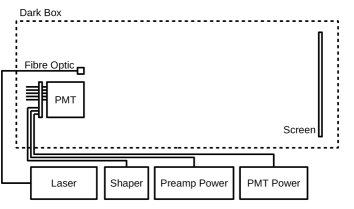
To this end, a nm laser was pulsed at Hz to illuminate the PMT (Fig. 4). The laser was first reflected off of a diffusive white screen to provide uniform light. The light intensity was controlled via the laser voltage and the screen-to-PMT distance. Using a single preamp, the excess noise factor was found for all 16 PMTs.
Fig. 5 shows the results of this analysis for one of the PMTs. The slope is the excess noise factor, and the intercept is the electronic noise in units of photoelectrons. The operating voltage for these measurements was V. On average, the excess noise factor was found to be , where the statistical error of is the standard deviation across the 16 PMTs. The systematic error of is due to the uncertainty in the value of the capacitor used in the test pulse calibration [1]. The average electronic noise was electrons at the anode, which is in good agreement with previous measurements [1]. The range of the excess noise factors was – , whereas the range of the electronic noise was – electrons at the anode. Given that the light yield of the CsI crystal is photoelectrons per MeV deposited [12], this electronic noise corresponds to an equivalent noise energy of about keV.
To estimate the impact of magnetic fields on the excess noise, the PMT gain was reduced by lowering the operating voltage. Above a gain of 55, the PMT was seen to have a constant excess noise factor. Below this, the excess noise factor increases non-linearly with decreasing gain, rising to at a gain of 25. In comparison, two avalanche photodiodes (APD) from the Hamamatsu S8664 series have been measured to have an excess noise factors of 3.4 and 5.1 [13]. These APDs are also being studied for pure CsI application as a competing option for the Belle II endcap ECL upgrade.
4 Aging
Of importance to the Belle II experiment is the effects of the PMT aging. Given that the Belle II endcap ECL will be in an axial magnetic field of approximately T, and that the PMTs will be within – to this field [14], it is expected that the gain of the PMTs will drop by about a third [7]. To simulate this, the aging process was performed with the operating voltage of the PMTs set to V, reducing the average gain to or one third of the nominal gain at V.
The performance of the PMT was characterized by the gainquantum efficiency, which was found from the slope of the peak ADC bin as a function of the energy deposited in the CsI. The change in the gainquantum efficiency relative to the initial value was monitored as a function of the charge passed through the anode, and also as a function of the real lab time elapsed. Light from a UV LED (335 nm) was used to age the PMTs, which were arrayed in a 44 array (Fig. 6). The PMTs were encased in an incubator with a UV transparent acrylic window to maintain the temperature at C. The relative humidity was kept within – % by means of desiccant and a slow influx of N2 gas into the incubator. One of the 16 PMTs was capped with black rubber to prevent aging and act as a control. This PMT was also used to correct for the residual variation in temperature. The relative peak location response with temperature was roughly linear and varied at a rate of C. Probably due to the poor thermal contact between dynodes and the environment exterior to the PMT, there is about a – h delay before the PMTs reached thermal equilibrium.
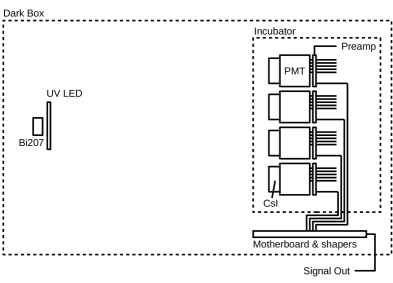
To track the performance, a constant light source was produced by gluing pure CsI pucks to the faces of the PMTs (Fig. 1) and triggering scintillation light with a 207Bi source. The glue used was TSE3032 silicone rubber produced by Momentive Performance Materials, which has an index of refraction of for nm light [15]. In comparison, the index of refraction of pure CsI is at the emission maximum of nm [3]. The CsI cylindrical pucks were manufactured by AMCRYS and were approximately the same diameter as the photocathode.
The measurement of the current was enabled by a modified preamp from the University of Montreal. This preamp did not perform any of the signal processing of the regular preamps, but rather contained a resistor such that the current could be measured with a Keithley 6485 Picoammeter. Prior to aging, a current baseline was established for each PMT using constant incident light. Using the baseline, only one PMT was needed to track the current through the anode and the current could be estimated for the other PMTs.
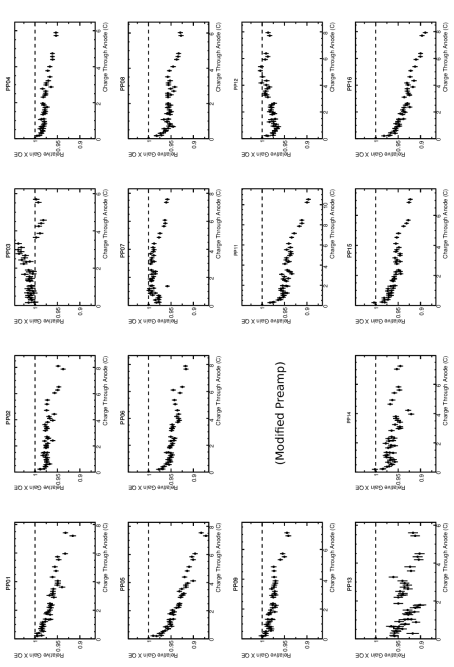
The 207Bi source was chosen for its two easily visible decays at MeV and MeV. Given the linear response of the PMT with energy, these two peaks were used to establish the gainquantum efficiency, which can be seen as a function of the integrated current in Fig. 7.
In Fig. 7, the PMT in the third column of the first row (PP03) is the control PMT and was not aged. There are a few different observed behaviors in the PMT aging. Some exhibited a burn-in period where the performance decreased rapidly during the first coulomb of charge, then appeared to stabilize. Some appeared to age continuously throughout, whereas others exhibited little to no aging or even experienced an improvement in the performance. The control PMT did not see any significant change in performance at the end of the aging process.
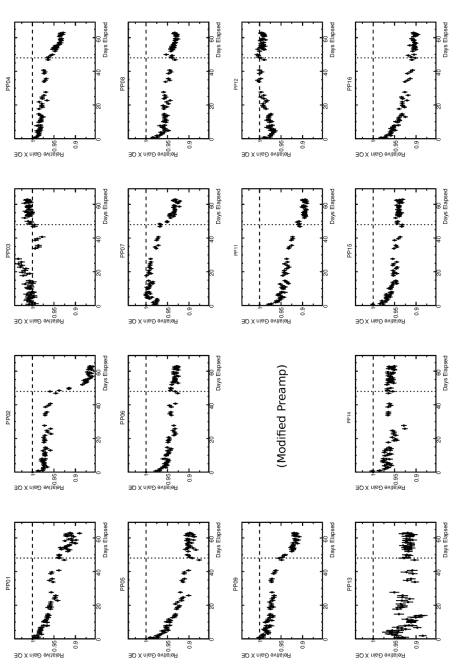
After 48 days of aging, the LED was turned off and the stability monitored (Fig. 8). Even after aging, some of the PMTs continued to see a decrease in performance. Of note, one of the 14 aged PMTs (PP02) saw nearly 10 % decrease in performance within a week. This degradation is worrying as it is rapid enough to be difficult to track via a physics-based calibration system. The control PMT did not observe any significant change in performance after the end of the aging process. At the end of the aging process an average of C was passed through the PMT anodes and the average PMT performance was reduced to % of the initial value.
By definition, each PMT has a relative performance of 1 at zero charge. Other than at this point, the PMTs appear to be scattered normally about the mean (Fig. 9). Due to the internal gain of the PMTs, an equal amount of incident light does not produce the same number of electrons at the anode, and as a result there are fewer statistics available at the larger anode charges.
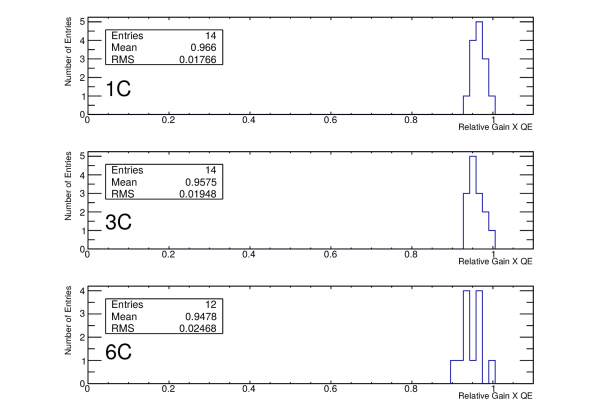
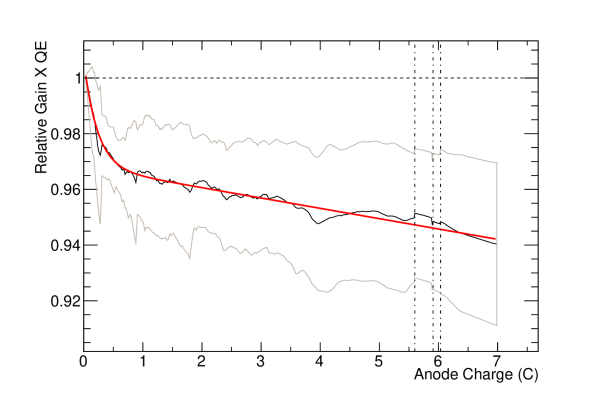
Fig. 10 shows the average gainquantum efficiency as a function of charge, with an envelope denoting the RMS. These values were found by taking a linear interpolation to account for the gaps in the measurement. As mentioned earlier, not all of the PMTs saw an equal amount of charge. At C, the total cumulative charge passed through the anode of the lowest gain PMT, the relative gainquantum efficiency was % across all 14 PMTs. As was seen in Fig. 9, the RMS grows steadily with anode charge.
Empirically, the sum of a linear and exponential function was chosen to be fitted to the curve in Fig. 10 in the range of C, using the error in the mean as the fit weighting. The resulting function is given by
| (3) |
This shows that there exists a burn-in period, modelled by the exponential term, after which the PMT experiences a linear decay in performance of %/C. The burn-in period lasts for C, after which the exponential factor scales its coefficient by less than %. By C the exponential contributes less than % to the function.
5 Summary
The initial quantities measured by Hamamatsu prior to shipping can be found in Table 1. Using processing electronics developed by the University of Montreal, the excess noise factor and aging properties of the R11283 photopentode were studied. The average excess noise factor for 16 PMTs was found to be and the average electronic noise was measured to be electrons at the anode. This electronic noise corresponds to an equivalent noise energy of 80 keV. The phototube aging was also studied by passing a large amount of charge through the anode, by exposing the photocathode to a large amount of incident light. At a reduced gain of , 14 PMTs were aged with an average of C passed through the anode, reducing the average performance of the PMTs to % of the initial measurement. Of the 14 aged PMTs, only one showed signs of rapid aging that could be a problem for some calibration systems. The average change in performance is characterized by an exponential burn-in period that lasts approximately C, after which the performance degrades linearly by %/C.
Acknowledgments
This work was supported by the technical support staff at TRIUMF, in particular P. Amaudruz who developed the pulsed UV laser and aided in the setup of MIDAS. Additionally, J.P. Martin, N.A. Starinski, and P. Taras of the University of Montreal designed and produced the preamp, motherboard, and shaper electronics. D. Jow aided in the gluing of the CsI to the PMTs. Funding for this work was provided by NSERC.
References
References
- [1] J.P. Martin, N. Starinski, P. Taras, Fast charge-sensitive preamplifier for pure CsI crystals, Nucl. Instrum. Methods A 778 (2015) 120.
- [2] Belle II Collaboration, Belle II technical design report, http://xxx.lanl.gov/abs/1011.0352, 2011.
- [3] Saint-Gobain Ceramics & Plastics, Inc., CsI(pure) cesium iodide scintillation material, Technical Report, http://www.crystals.saint-gobain.com/uploadedFiles/SG-Crystals/Documents/CsI%20Pure%20Data%20Sheet.pdf, 2007 (accessed 03.08.15).
- [4] Saint-Gobain Ceramics & Plastics, Inc., CsI(Tl), CsI(Na) cesium iodide scintillation material, http://www.crystals.saint-gobain.com/uploadedFiles/SG-Crystals/Documents/CsI(Tl)%20and%20(Na)%20data%20sheet.pdf, 2007 (accessed 03.08.15).
- [5] T. K. Komatsubara, et al., Performance of fine-mesh photomultiplier tubes designed for an undoped-CsI endcap photon detector, Nucl. Instrum. Methods A 404 (1998) 315.
- [6] Hamamatsu Photonics K.K. Electron Tube Division, Photomultiplier Tube R11283 Technical Data, Personal Communication, 2013.
- [7] A. Kuzmin, Endcap calorimeter for SuperBelle based on pure CsI crystals, Nucl. Instrum. Methods A 623 (1) (2010) 252–254, http://dx.doi.org/10.1016/j.nima.2010.02.212.
- [8] D. Fujimoto, A low gain fine mesh photomultiplier tube for pure CsI (Master’s thesis), University of British Columbia, 2015.
- [9] S. Ritt, et al., Maximum integrated data acquisition system, https://midas.triumf.ca, 1993.
- [10] H. Ikeda, et al., A detailed test of the CsI(Tl) calorimeter for BELLE with photon beams of energy between 20 MeV and 5.4 GeV, Nucl. Instrum. Methods A 441 (3) (2000) 401.
- [11] Hamamatsu Photonics K.K., Photomultiplier tubes: basics and applications, http://www.hamamatsu.com/resources/pdf/etd/PMT_handbook_v3aE.pdf, 2007.
- [12] C. Hearty, Pure CsI light output and resolution studies, in: 17th Belle II General Meeting, https://kds.kek.jp/indico/event/14531/session/73/contribution/251/material/slides/0.pdf, 2014.
- [13] Y. Jin, et al., Study of a pure CsI crystal readout by APD for Belle II end cap ECL upgrade, Nucl. Instrum. Methods A, http://dx.doi.org/10.1016/j.nima.2015.07.034.
- [14] Belle Collaboration, The Belle detector, Nucl. Instrum. Methods A 479 (2002) 117–232.
- [15] Momentive Performance Materials, TSE3032 technical data sheet, https://www.momentive.com/products/showtechnicaldatasheet.aspx?id=10404, 2015 (accessed 08.07.15).