Discrete Scale Invariance in Supercritical Percolation
Abstract
Recently it has been demonstrated that the connectivity transition from microscopic connectivity to macroscopic connectedness, known as percolation, is generically announced by a cascade of microtransitions of the percolation order parameter [Chen et al., Phys. Rev. Lett. 112, 155701 (2014)]. Here we report the discovery of macrotransition cascades which follow percolation. The order parameter grows in discrete macroscopic steps with positions that can be randomly distributed even in the thermodynamic limit. These transition positions are, however, correlated and follow scaling laws which arise from discrete scale invariance and non self-averaging, both traditionally unrelated to percolation. We reveal the discrete scale invariance in ensemble measurements of these non self-averaging systems by rescaling of the individual realizations before averaging.
Percolation penetrates many natural, technological and social systems Stauffer and Aharony (1994); Gaillard-Groleas et al. (1990); Drossel and Schwabl (1992); Buldyrev et al. (2010); Callaway et al. (2000); Newman et al. (2002); Ali Saberi (2013); D’Souza and Nagler (2015), ranging from conductivity of composite materials Sahini and Sahimi (1994); Andrade Jr et al. (2000) and polymerization Ziff et al. (1982) to epidemic spreading Anderson et al. (1992); Moore and Newman (2000); Pastor-Satorras and Vespignani (2001) and information diffusion Strang and Soule (1998); Lazarsfeld et al. (1944). Across all percolation systems, once the density of links in the networked system exceeds a critical threshold at , the system undergoes a sudden transition from microscopic connectedness to global connectivity.
This critical transition to global connectedness is typically accompanied by continuous scale invariance Stanley (1971); Sornette (2004), this means power-law scaling of observables close to the transition point Stauffer and Aharony (1994). Discrete scale invariance (DSI) arises when such continuous scale invariance is partially broken. This means the scale invariance of an observable obeying does not hold for all anymore but only for a countable set with a fixed being the fundamental scaling ratio of the system and . The discreteness of the scaling factors then leads to log-periodic modulations of the continuous scale invariance and of the power-law behavior of the observable Sornette (1998, 2004).
For models of continuous and discontinuous percolation, it has recently been demonstrated that percolation at is generically announced by a cascade of microtransitions of the size of the largest interconnected component, at discrete positions , exhibiting discrete scale invariance Chen et al. (2014).
Various percolation models exhibit non-trivial behavior also in the supercritical regime Chen et al. (2013, 2013); D’Souza and Nagler (2015), such as multiple giant components or macroscopic, discontinuous transitions. Here we report the discovery that fractional percolation models exhibit DSI for supercritical link densities . Specifically, we demonstrate DSI to be caused by the strict fractional growth mechanism and the induced delay of macroscopic scale between growth steps of the largest cluster. Fractional growth also often leads to non self-averaging in these models.
We analytically identify the relation of supercritical DSI in this class of percolation models to the standard supercritical scaling. Due to the coexistence with non self-averaging the DSI is often hidden in standard ensemble-averaged statistics. To reveal the DSI even in these measurements we propose a rescaling method, where individual realizations are aligned before averaging (the realizations in self-averaging systems are already self-aligned). We numerically and, where possible, analytically exemplify these findings for different percolation models.
All models discussed here follow the same general structure: starting from an initially empty network with nodes but links, links are added one at a time based on the given percolation rule. We observe the size of the largest cluster depending on the link density in the network . We specifically analyze percolation models leading to a fractional growth mechanism for the largest cluster.
We discuss two variants of homophilic percolation Nagler et al. (2012); Schröder et al. (2013), introduced as the first example of fractional percolation models. Both models exhibit supercritical DSI with a simple percolation rule. First we discuss global homophilic percolation and the supercritical DSI in this self-averaging system. Then we consider the local homophilic percolation model, illustrating how the signs of DSI can be completely hidden in ensemble-averaged properties due to the non self-averaging, and introduce the rescaling approach. Finally, we discuss a modified Erdős-Rényi-model Riordan and Warnke (2012) with similar properties. Due to its relation to standard Erdős-Rényi-percolation we are able to analytically derive the DSI scaling parameters for this model. The individual models are described in more detail in their individual paragraphs.
Non self-averaging in percolation.—Non self-averaging in percolation describes the phenomenon that the evolution of the relative size of the largest cluster does not converge to a well defined function of the link density as the system size . Instead remains broadly distributed with a finite variance. Examples of non self-averaging percolation models were first given in Riordan and Warnke (2012); Nagler et al. (2012). Typically, non self-averaging is defined by the relative variance of the order parameter
| (1) |
where denotes ensemble averaging. If the system is self-averaging and the relative size of the largest cluster becomes a function of , then for large systems. If, on the other hand, does not disappear for the system is said to be non self-averaging Sornette (2004). In this case is (randomly) distributed in some interval and differences between individual realizations do not decay for large systems.
DSI in percolation.—Recently DSI has been demonstrated to occur in a percolation model with global competition where in each step the two smallest clusters in the system merge Chen et al. (2014). Start with an empty graph with isolated nodes. At each step connect the two smallest clusters in the system. If multiple choices are valid pick one uniformly at random. This model is the limiting case of the original explosive percolation models Achlioptas et al. (2009), where at each step a fixed number of links compete for addition Friedman and Landsberg (2009); Nagler et al. (2011). The global competition suppresses transitions different from doubling transitions leading to . These transitions occur after adding links to the network at fixed link densities and clearly announce the percolation transition as
| (2) |
for and therefore
| (3) |
These discrete jumps thus follow DSI with scaling factors , and exponent Chen et al. (2014).
Similar to this concept we discuss the supercritical DSI using the following notation. We index the positions of the steps of as counting the steps backwards to the critical point, i.e., . We choose this indexing since there are only a finite number of steps after any due to the obvious limit of but, in the thermodynamic limit, infinitely many jumps close to the critical point. Accordingly, we write . The notation is illustrated in Fig. 1.

With this notation the supercritical discrete scale invariance is described by
| (4) |
and therefore
| (5) |
For the models considered here the factor is given by the fractional growth mechanism of the percolation rules and can be estimated using the positions of the individual steps. The DSI exponent is then given as .
Global homophilic percolation.—Starting from a modification of global competition we use a model with global “homophilic” competition to demonstrate that DSI can occur in the supercritical regime as well. Again, starting from isolated nodes, at each step choose a link uniformly at random from all links joining clusters of the same size (possibly the same cluster) and add this link. We denote this model as global homophilic percolation (GHP). This modification retains the strict doubling rule (fractional growth) from the original globally competitive model but it exhibits a non-trivial supercritical regime as it does not always merge the two smallest clusters.
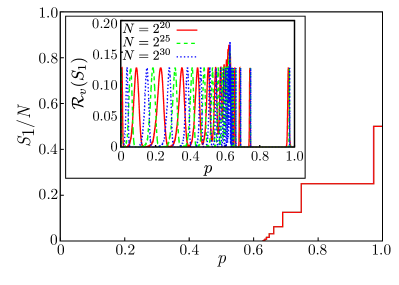
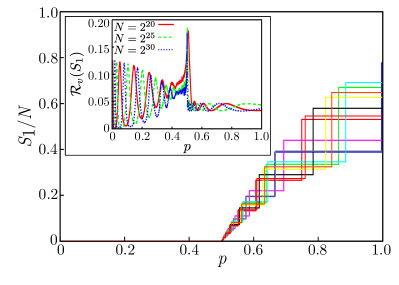
Since only doubling transitions are possible the second largest cluster needs to grow before a merger with the largest cluster. This time leads to an intrinsic macroscopic delay between the growth steps of the largest cluster, leading to supercritical DSI. Typical realizations of the evolution of the relative size of the largest cluster are shown in Fig. 2 together with the relative variance of the order parameter.
Similar to models proposed in Schrenk et al. (2012); Nagler et al. (2012); Schröder et al. (2013) this model features a continuous (first) percolation transition with an infinite amount of infinitely small discontinuous jumps. Remarkably, unlike the other models exhibiting this “staircase” behavior it is self-averaging. The positions of the peaks in the relative variance mark the individual steps after (determined via , see Fig. 2). These peaks localize for larger systems such that almost everywhere for .
This self-averaging (deterministic) staircase
represents a new type of percolation phase transitions D’Souza and Nagler (2015) and
is due to the fact that the discrete growth of clusters
holds always, throughout the entire percolation process.
For the BFW-model on the lattice analyzed by Schrenk et al. Schrenk et al. (2012) it remains to be explored if the observed staircase is a signature of non self-averaging such as in Schröder et al. (2013).
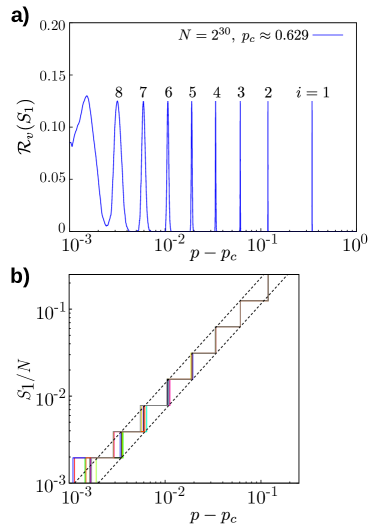
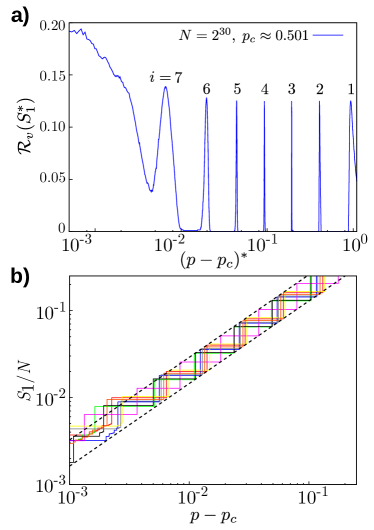
DSI in supercritical percolation.—Fig. 3(a) shows only the supercritical regime of the relative variance versus . The delay between consecutive growth steps leads to positions of these steps that are log-periodic for intermediate values of , signature of the DSI. Using Eq. 5 for pairs of consecutive steps we find an average using steps . With the known factor from the doubling transitions imposed by the percolation rule this leads to a scaling exponent of . These results agree well with the actual evolution of the system as shown in Fig. 3(b).
Due to the doubling of the size of the largest cluster with each step the number of observable jumps until the largest cluster reaches size scales as and thus the finite size simulations only show very few steps, even though in the thermodynamic limit the system exhibits infinitely many jumps close to . In fact, it can be seen in Fig. 3(a) that for very small values of the peaks are not log-periodic due to the finite size of the simulated systems.
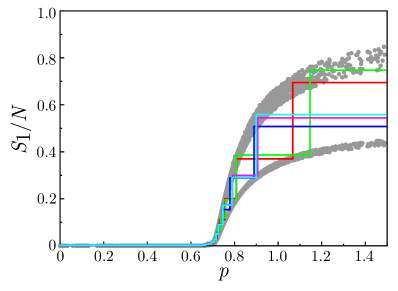
Homophilic percolation.—A similar model favoring the merger of clusters of similar size was presented in Nagler et al. (2012). In each step three nodes are chosen at random. Let the (ordered) sizes of the clusters they reside in be . The two nodes that minimize are connected, possibly creating an intra-cluster link. This homophilic percolation (HP) is the local competition variant of the global homophilic model discussed above. Example realizations of the process are shown in Fig. 4.
Since the existence of a strict fractional growth mechanism is not obvious in this model we repeat the argument from Nagler et al. (2012):
Assume the largest cluster is the only macroscopic cluster, then it can never merge with another cluster.
Either two nodes in microscopic clusters are chosen and will be linked or two nodes from the largest cluster will be chosen and then linked.
Similarly, if two macroscopic clusters exist they can only merge if :
For such a merger the three nodes have to be drawn from the largest, second largest and a microscopic cluster, otherwise an intra-cluster link is added or two microscopic clusters merge.
Then the size difference between and a microscopic cluster of negligible size must be larger than the difference , requiring .
As soon as the cluster sizes allow such a merger it has a non-zero probability of occurring and will take place instantaneously (in steps).
The HP-model therefore exhibits fractional growth with .
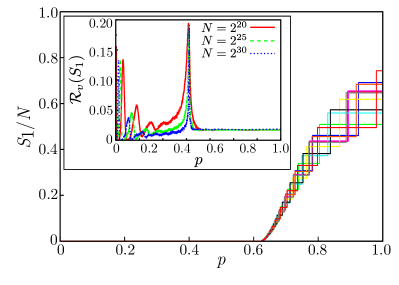
DSI in non self-averaging percolation.—The relative variance in the HP-model (Fig. 4) is non-zero after the percolation transition and does not disappear for larger systems indicating non self-averaging. This is also clearly visible by the fact that the different realizations do not coincide. Due to the non self-averaging no log-periodic oscillations and no signature of DSI is visible in the ensemble averaged properties such as the relative variance.
To clearly reveal the DSI even in the ensemble properties we propose the following rescaling procedure: In order to align the individual realizations we need to align both the relative size of the largest cluster as well as the link density. We do this by rescaling these quantities individually for each realization before calculating the ensemble properties, e.g., the relative variance. The rescaling is done in the following way:
| (6) | |||||
| (7) |
where and are the rescaling factors depending on the realization. Specifically, we align the first step where such that and the following step such that it has a fixed length . Since the rescaling is linear it does not affect the scaling exponent close to . The method is robust against changes in the exact values used for this rescaling procedure, however, the realizations should be aligned at a point where the DSI is expected to hold. Importantly, this rescaling does not affect the ensemble properties if the model is self-averaging as then the and are (almost) identical for all realizations.
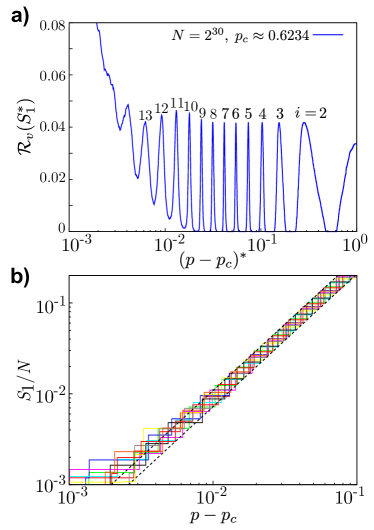
The effect of this rescaling on the relative variance is shown in Fig. 5(a). The steps of the individual realizations are now localized at the same positions such that also the peaks in the relative variance become localized, similar to Fig. 3.
This clearly reveals log-periodic oscillations and allows us to calculate the parameters of the DSI as above with (using ) and thus [see Fig. 5(b)]. This shows that even though this model is non self-averaging and the positions of the growth steps are randomly distributed, the steps of a single realization are correlated via DSI. These correlations are such that once one observations of is known the future (past) evolution can be perfectly predicted (reconstructed).
Modified ER-model.—Another example for a model that shows supercritical DSI is the modified Erdős-Rényi-model (mER). This model was presented as one of the first examples of non self-averaging behavior in explosive percolation Riordan and Warnke (2012) and is analytically treatable due to its similarities to standard ER-percolation Erdős and Rényi (1960). It was pointed out that the non self-averaging in these models is caused by small fluctuations of close to the critical point that are then amplified by the fractional growth mechanism Riordan and Warnke (2012). The mER-model restricts the largest (macroscopic) component to doubling transitions and we show here that it also features supercritical DSI.
Links are added as follows using the mER rule: Starting from an empty graph in each step three nodes are chosen at random. If the two largest components in the entire network have the same size (), connect two of the chosen nodes at random. Otherwise (), if at least two of the chosen nodes are inside the largest cluster those are connected. Else two chosen nodes in the smaller clusters are connected. This model behaves exactly as the standard ER-model Erdős and Rényi (1960) for links that do not include the largest component.
Fig. 6 shows example realizations of the process and the relative variance of the largest cluster. The mER-model is non self-averaging evidenced by the non-zero relative variance in Fig 6. However, there still exist preferred cluster sizes as can be seen by the small oscillations in . Technically, even these peaks allow for calculating the DSI parameters and . However, applying the rescaling as above reveals the DSI characteristics more clearly.
With the rescaling the steps of the individual realizations are now localized at the same positions such that the peaks in the relative variance become localized [Fig. 7(a)] clearly revealing log-periodic oscillations and therefore the DSI. We again calculate the parameters of the DSI as above and find (using steps ) and thus [see Fig. 7(b)]. Again, the small amount of observable jumps for finite system sizes decreases the possible accuracy of the measurement.
Analytic description of DSI.—We can analytically explain the appearance of DSI in percolation models with a strict fractional growth mechanism. In particular, we can even calculate the scaling exponent in the thermodynamic limit for the mER-model.
In general we make two assumptions about the model: it exhibits strict fractional growth of the largest cluster and power-law scaling (continuous scale invariance) close to the percolation transitions of the second largest cluster as is the case in most percolation models. Here, this means the delay between two consecutive jumps is given by while is growing to . We can then write and with the two assumptions above we find
| (8) | |||||
We therefore find as relation for the time between two consecutive steps
| (9) |
giving the DSI exponent . This clearly shows the connection between DSI as an extension of the known scaling laws for and a strict fractional growth mechanism of the largest cluster.
For the mER-model these assumptions are fulfilled and we are in fact able to calculate the complete evolution of the largest cluster: for all links not including the largest cluster the mER-model behaves exactly as a (link density rescaled) ER-model Riordan and Warnke (2012). Consider the time between two jumps of the largest cluster with size as above. is given by the time it takes for the second largest cluster to grow up to size , comprised of growth in the subcritical and supercritical regime. The additional time needed due to the possibility of adding intra-cluster-links in the largest cluster (not affecting the growth of the second largest cluster) can be ignored for small close to as it only occurs with probability . With for small , known from the standard ER-model, it takes time in the supercritical regime for to reach the size of . Due to the similarity of the sub- and supercritical regime in ER-percolation Bollobás (1984) the time it takes for to reach the critical point from the last step is approximately the same as the time for the supercritical growth before the last step. Thus we have .
We then calculate the link density at the jump as above with and
| (10) |
We therefore find a DSI exponent (, ).
The growth of the largest cluster then follows a staircase with a lower envelope for close to .
Both the exponent as well as the calculated prefactor agree well with the simulations considering the strong influence of finite size effects.
Beyond DSI in homophilic percolation.— Since we discussed two models of homophilic percolation as examples of (non) self-averaging percolation with supercritical DSI (see Fig. 2 and 4) one might expect similar results to hold for models in between the global and local homophilic percolation models. However, extending homophilic percolation to competition between more than nodes leads to much more complex behavior. In fact, both assumptions for the analytical derivation above are not given any more and the DSI is broken.
For example, for homophilic percolation, i.e. choosing four nodes and connecting those that have the most similar cluster size, the second largest cluster exhibits DSI after its percolation transitions. This leads to an additional source of randomness in the growth steps of the largest cluster. While this process is still non self-averaging, the randomness in the growth steps breaks the strict fractional growth of the largest cluster, breaking the discrete scale invariance (see Fig. 8). Competition between more nodes () leads to even more complex behavior as more sources of randomness are introduced. This shows that a strict fractional growth mechanism is necessary for supercritical DSI in percolation.
Conclusion.—We have studied percolation systems exhibiting a fractional growth mechanism, creating an intrinsic delay in the growth of the largest cluster, which leads to staircase-like growth and often non self-averaging. We demonstrated that this staircase growth extends the known power-law scaling in the supercritical regime to discrete scale invariance and analytically showed the connection between the scaling laws and the DSI parameters. For systems that are non self-averaging the signatures of DSI can be lost in ensemble-averaged properties. We proposed a rescaling method to align the individual realizations and expose the log-periodicity, the signature of DSI.
Notably, we introduced the global homophilic percolation model that exhibits a novel percolation phase transition type, characterized by a deterministic staircase D’Souza and Nagler (2015).
In contrast to the previously discussed DSI in the subcritical regime Chen et al. (2014), DSI in the supercritical regime of percolation cannot stem from some underlying discreteness of the network or lattice. We have demonstrated the existence of a strict fractional growth mechanism of the largest cluster as a condition for supercritical DSI. This fractional growth leads to an implicit delay in the growth of the largest cluster leading to DSI. Conversely, it would be interesting to see whether DSI can also be induced by an explicit delay in percolation models, especially since link addition or the merger of clusters in real networks is often not instantaneous.
Acknowledgements.
Malte Schröder acknowledges support from the Göttingen Graduate School for Neurosciences and Molecular Biosciences (DFG Grant GSC 226/2). Wei Chen would like to acknowledge support from the National Natural Science Foundation of China under Grant No. 11305219. Jan Nagler acknowledges the ETH Risk Center for support (Grant No. SP RC 08-15).References
- Stauffer and Aharony (1994) D. Stauffer and A. Aharony, Introduction To Percolation Theory: Revised Second Edition (Taylor & Francis, 1994).
- Gaillard-Groleas et al. (1990) G. Gaillard-Groleas, M. Lagier, and D. Sornette, Phys. Rev. Lett., 64, 1577 (1990).
- Drossel and Schwabl (1992) B. Drossel and F. Schwabl, Phys. Rev. Lett., 69, 1629 (1992).
- Buldyrev et al. (2010) S. V. Buldyrev, R. Parshani, G. Paul, H. E. Stanley, and S. Havlin, Nature, 464, 1025 (2010).
- Callaway et al. (2000) D. S. Callaway, M. E. J. Newman, S. H. Strogatz, and D. J. Watts, Phys. Rev. Lett., 85, 5468 (2000).
- Newman et al. (2002) M. E. J. Newman, D. J. Watts, and S. H. Strogatz, Proc. Natl. Acad. Sci., 99, 2566 (2002).
- Ali Saberi (2013) A. Ali Saberi, Phys. Rev. Lett., 110, 178501 (2013).
- D’Souza and Nagler (2015) R. M. D’Souza and J. Nagler, Nat. Phys., 11, 531 (2015).
- Sahini and Sahimi (1994) M. Sahini and M. Sahimi, Applications Of Percolation Theory (CRC Press, 1994).
- Andrade Jr et al. (2000) J. S. Andrade Jr, S. V. Buldyrev, N. V. Dokholyan, S. Havlin, P. R. King, Y. Lee, G. Paul, and H. E. Stanley, Phys. Rev. E, 62, 8270 (2000).
- Ziff et al. (1982) R. M. Ziff, E. M. Hendriks, and M. H. Ernst, Phys. Rev. Lett., 49, 593 (1982).
- Anderson et al. (1992) R. M. Anderson, R. M. May, and B. Anderson, Infectious diseases of humans: dynamics and control, Vol. 28 (Oxford University Press, 1992).
- Moore and Newman (2000) C. Moore and M. E. J. Newman, Phys. Rev. E, 61, 5678 (2000).
- Pastor-Satorras and Vespignani (2001) R. Pastor-Satorras and A. Vespignani, Phys. Rev. Lett., 86, 3200 (2001).
- Strang and Soule (1998) D. Strang and S. A. Soule, Annu. Rev. Sociol., 24, 265 (1998).
- Lazarsfeld et al. (1944) P. F. Lazarsfeld, B. Berelson, and H. Gaudet, The People’s Choice (Columbia University Press, 1944).
- Stanley (1971) H. E. Stanley, Introduction to Phase Transitions and Critical Phenomena, The International Series of Monographs on Physics (Oxford University Press, 1971).
- Sornette (2004) D. Sornette, Critical Phenomena in Natural Sciences, Chaos, Fractals, Self-organization and Disorder: Concepts and Tools, Springer Series in Synergetics (Springer-Verlag Berlin Heidelberg, 2004).
- Sornette (1998) D. Sornette, Phys. Rep., 297, 239 (1998).
- Chen et al. (2014) W. Chen, M. Schröder, R. M. D’Souza, D. Sornette, and J. Nagler, Phys. Rev. Lett., 112, 155701 (2014).
- Chen et al. (2013) W. Chen, X. Cheng, Z. Zheng, N. N. Chung, R. M. D’Souza, and J. Nagler, Phys. Rev. E, 88, 042152 (2013a).
- Chen et al. (2013) W. Chen, J. Nagler, X. Cheng, X. Jin, H. Shen, Z. Zheng, and R. M. D’Souza, Phys. Rev. E, 87, 052130 (2013b).
- Nagler et al. (2012) J. Nagler, T. Tiessen, and H. W. Gutch, Phys. Rev. X, 2, 031009 (2012).
- Schröder et al. (2013) M. Schröder, S. H. E. Rahbari, and J. Nagler, Nat. Commun., 4 (2013).
- Riordan and Warnke (2012) O. Riordan and L. Warnke, Phys. Rev. E, 86, 011129 (2012).
- Achlioptas et al. (2009) D. Achlioptas, R. D’Souza, and J. Spencer, Science, 323, 1453 (2009).
- Friedman and Landsberg (2009) E. J. Friedman and A. S. Landsberg, Phys. Rev. Lett., 103, 255701 (2009).
- Nagler et al. (2011) J. Nagler, A. Levina, and M. Timme, Nat. Phys., 7, 265 (2011).
- Schrenk et al. (2012) K. J. Schrenk, A. Felder, S. Deflorin, N. A. M. Araújo, R. M. D’Souza, and H. J. Herrmann, Phys. Rev. E, 85, 031103 (2012).
- Erdős and Rényi (1960) P. Erdős and A. Rényi, Publ. Math. Inst. Hungar. Acad. Sci, 5, 17 (1960).
- Bollobás (1984) B. Bollobás, Trans. Amer. Math. Soc., 286, 257 (1984).