Non-Thermal Electron Energization from Magnetic Reconnection in Laser-Driven Plasmas
Abstract
The possibility of studying non-thermal electron energization in laser-driven plasma experiments of magnetic reconnection is studied using two- and three-dimensional particle-in-cell simulations. It is demonstrated that non-thermal electrons with energies more than an order of magnitude larger than the initial thermal energy can be produced in plasma conditions currently accessible in the laboratory. Electrons are accelerated by the reconnection electric field, being injected at varied distances from the X-points, and in some cases trapped in plasmoids, before escaping the finite-sized system. Trapped electrons can be further energized by the electric field arising from the motion of the plasmoid. This acceleration gives rise to a non-thermal electron component that resembles a power-law spectrum, containing up to of the initial energy of the interacting electrons and of the initial magnetic energy. Estimates of the maximum electron energy and of the plasma conditions required to observe suprathermal electron acceleration are provided, paving the way for a new platform for the experimental study of particle acceleration induced by reconnection.
pacs:
52.72.+v, 52.35.Vd, 41.75.Jv, 52.65.RrMagnetic reconnection is a fundamental plasma process whereby magnetic energy is rapidly and efficiently converted into plasma flows, heating, and potentially non-thermal particles Zweibel and Yamada (2009). It plays a critical role in the evolution of magnetized plasmas in space physics, astrophysics and laboratory nuclear fusion devices Ji and Daughton (2011); Joglekar et al. (2014); Taylor (1986). Energetic particles are a common signature of the reconnection process, and reconnection is thought to be a promising candidate for producing the non-thermal emissions associated with explosive phenomena such as solar flares, pulsar wind nebulae and jets from active galactic nuclei. These systems span a large range of plasma conditions, and many recent studies have focused on understanding the details of the particle acceleration in both nonrelativistic Oka et al. (2010); Fu et al. (2006); Hoshino et al. (2001); Drake et al. (2006); Dahlin et al. (2014) and relativistic Guo et al. (2014); Sironi and Spitkovsky (2014) regimes. These studies have discovered a rich variety of acceleration mechanisms, with many mediated by the plasmoids that can form in the current sheet due to the tearing instability Loureiro et al. (2007). The overall efficiency of reconnection in producing energetic particles and its dependence on the plasma conditions, however, has not been settled, and thus remains an important and active area of research.
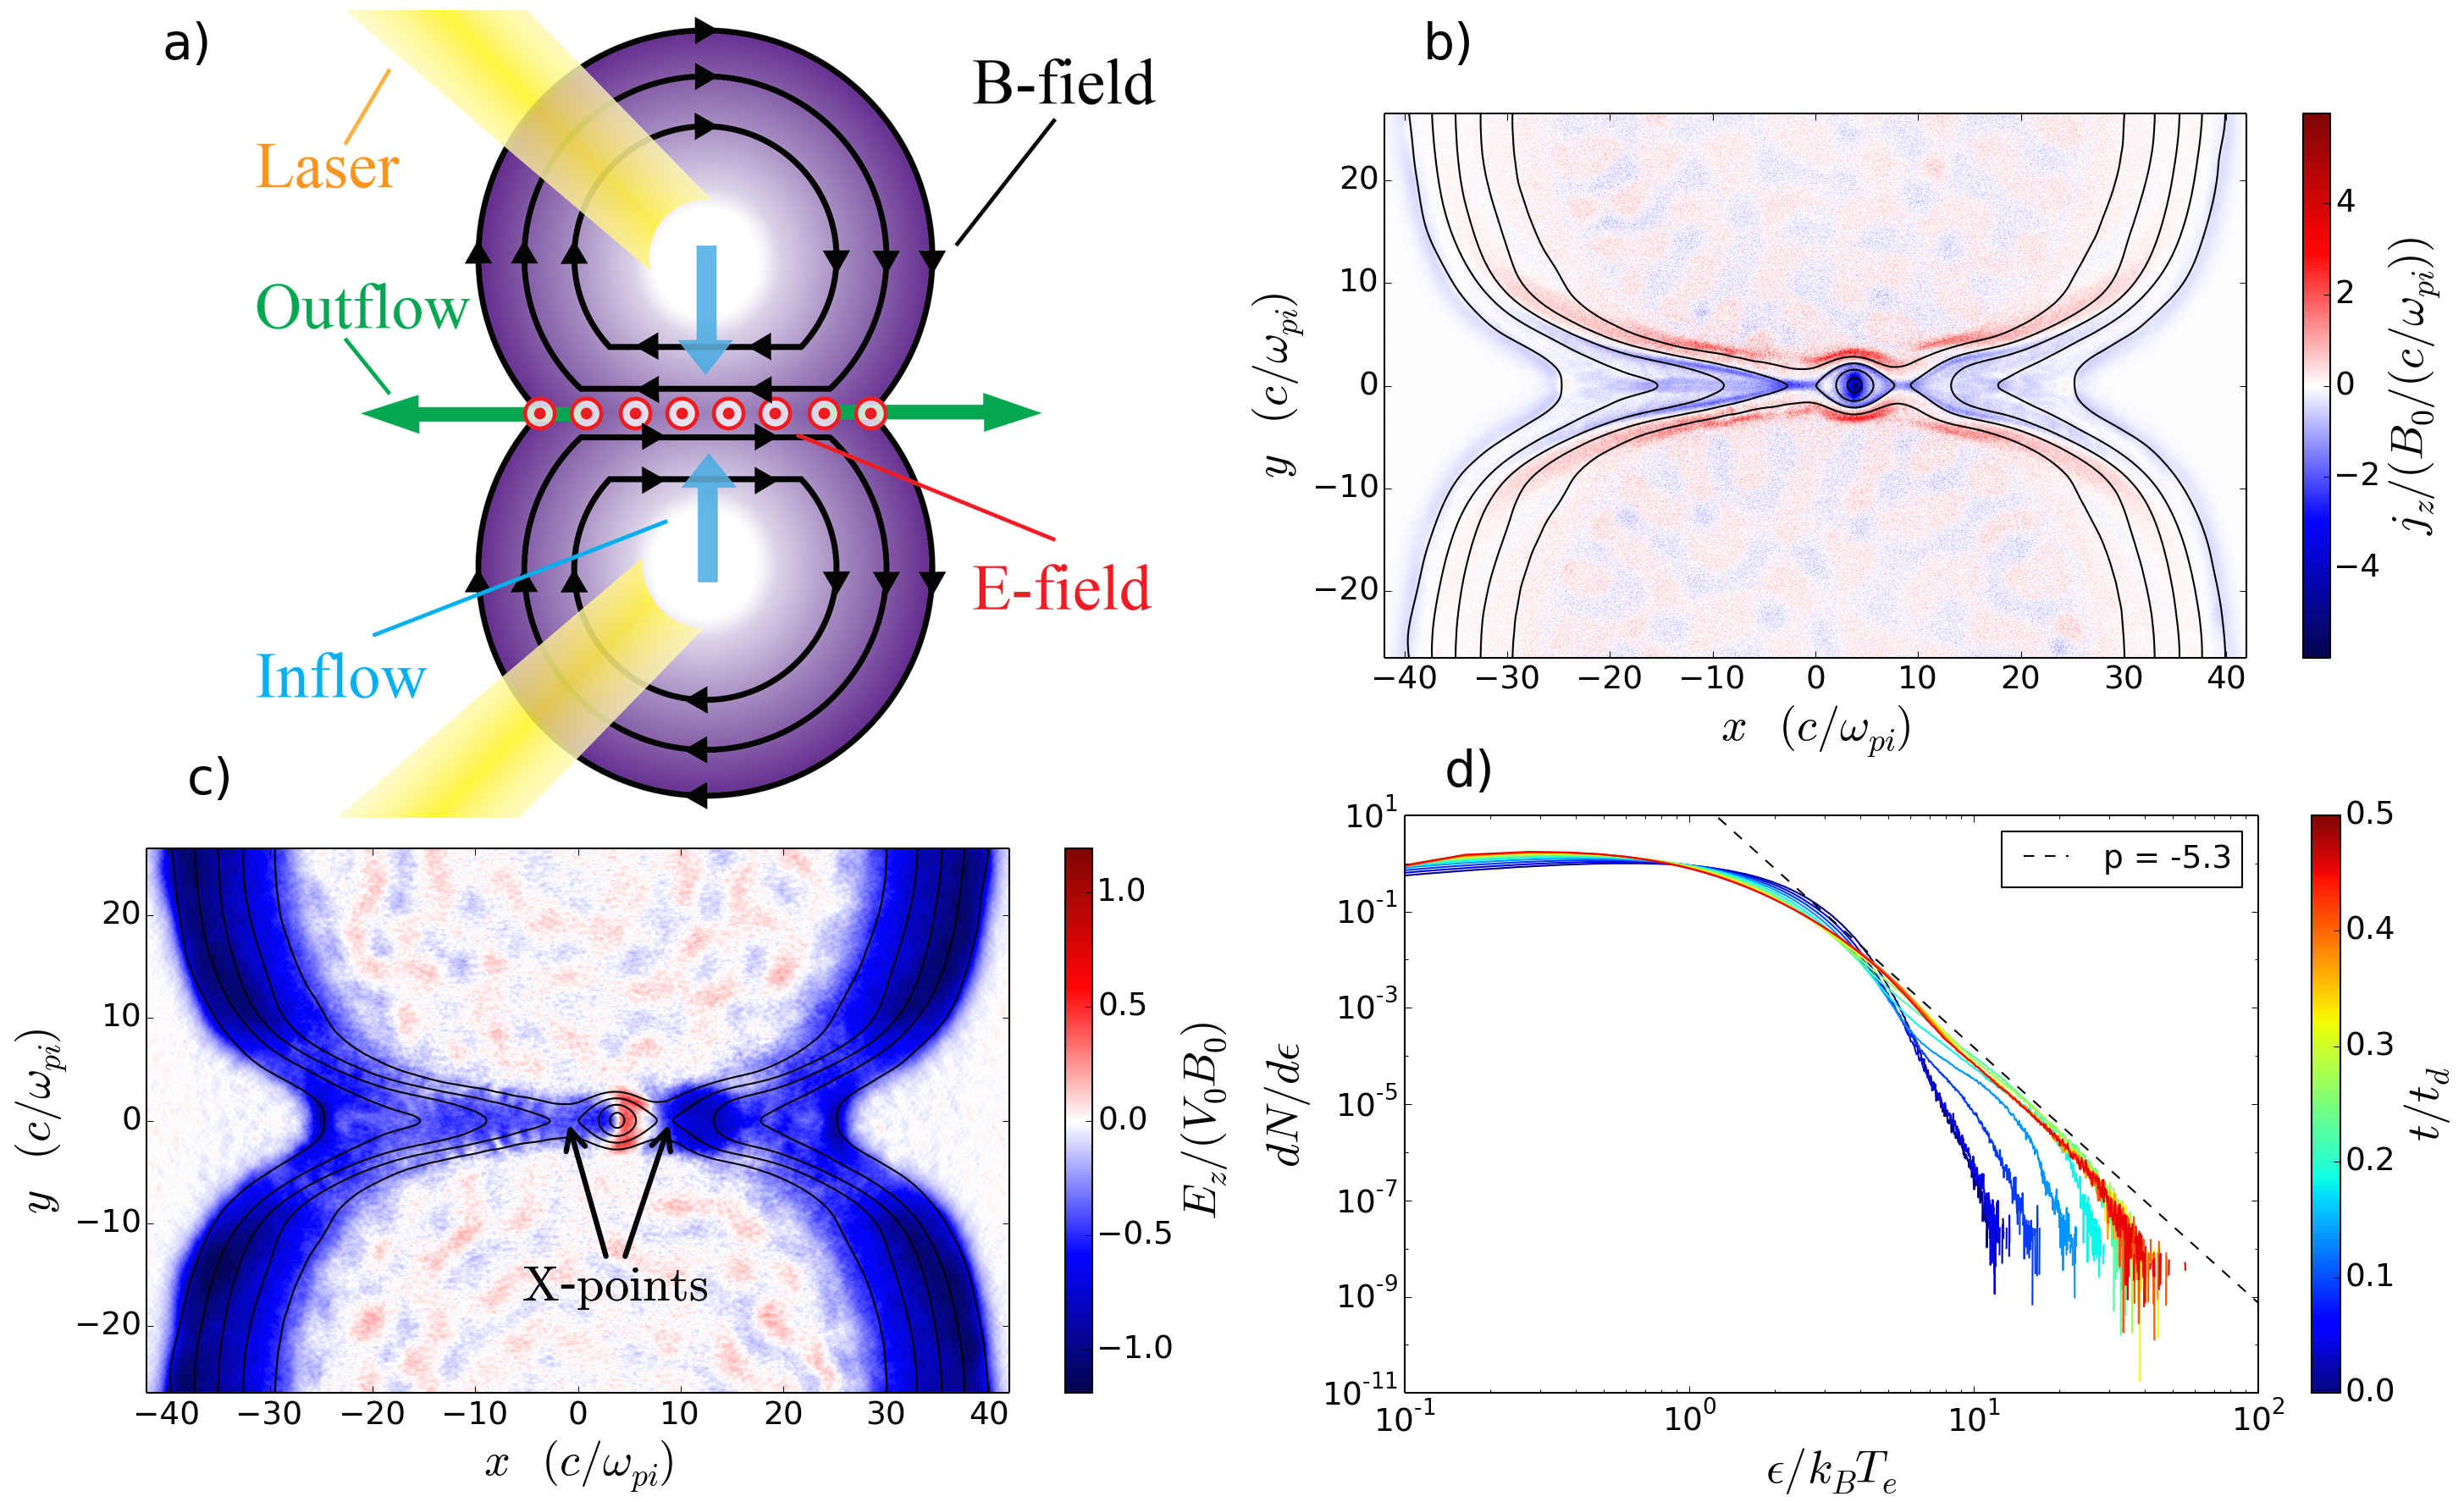
Recently, laser-driven high-energy-density (HED) plasmas have started to be used to study reconnection in the laboratory Nilson et al. (2006); Li et al. (2007); Nilson et al. (2008); Willingale et al. (2010); Zhong et al. (2010); Dong et al. (2012); Fiksel et al. (2014) (for a review of laboratory reconnection experiments see Yamada et al. (2010)). By focusing terawatt class (kJ/ns) lasers onto solid foils, plasma bubbles are produced that expand and generate megagauss scale toroidal magnetic fields by the Biermann battery () mechanism Haines (1997). The expansion of two bubbles placed in close proximity can then drive reconnection between the self-generated or externally imposed Fiksel et al. (2014) magnetic fields (Figure 1(a)). Many of the prominent features of reconnection have been observed in these systems, including plasma jets, plasma heating, changes in magnetic field topology, and plasmoid formation. Supersonic and super-Alfvénic inflow speeds place these experiments in a regime of strongly-driven reconnection, making them particularly relevant for systems featuring colliding magnetized plasma flows found in space and astrophysics. Laser-driven plasma experiments are characterized by a high Lundquist number and large system size relative to the electron and ion inertial lengths, allowing a comparison with astrophysical systems via scaling laws Ryutov et al. (2000). Until now, the possibility of using laser-driven plasmas to study non-thermal particle acceleration induced by reconnection has remained unclear.
In this Letter, we investigate the onset and the properties of particle acceleration during reconnection in laser-driven plasmas using ab initio particle-in-cell (PIC) simulations. Using the fully relativistic, state-of-the-art PIC code OSIRIS Hemker (2015); Fonseca et al. (2002, 2008, 2013) we perform two-dimensional (2D) and, for the first time, three-dimensional (3D) simulations in realistic experimental conditions and geometries. We demonstrate the possibility of detecting electrons with energies more than an order of magnitude larger than the thermal energy in conditions relevant to current experiments. The electrons are accelerated primarily by the reconnection electric field, with the randomness associated with injection at varied distances from the X-points and escape from the finite-sized system leading to a non-thermal component with a power-law shape. Furthermore, a fraction of the electrons can be trapped in plasmoids, slowly gaining further energy due to the drifting motion of the plasmoid. An estimate for the maximum electron energy and a threshold condition for suprathermal energization are given in terms of experimentally tunable parameters, which can guide future studies of particle acceleration induced by reconnection in laser-driven plasmas.
We simulate the interaction between two expanding, magnetized plasma bubbles, consistent with previous PIC studies Fox et al. (2011, 2012); Lu et al. (2013, 2014) (Figs. 1(b) and 1(c)). The simulations start when the bubbles are about to interact, and thus do not model the initial generation of the plasma or magnetic field. However, they capture the most important features of the system such as finite size and driven inflows, allowing them to be connected to a number of experimental geometries Ryutov et al. (2013). The bubbles are centered at and , with the radial vectors from the bubble centers being . Here is the radius of each bubble when they begin to interact. The initial density profile is where if , 0 otherwise. Here, is a background plasma density, and is the initial bubble radius, which we typically take to be . The velocity profile is where if , 0 otherwise. The initial magnetic field is divergence free and corresponds to the sum of two oppositely aligned ribbons, where if , 0 otherwise. is the initial half-width of the magnetic field ribbon. and are the polar and azimuthal angles, respectively, of spherical coordinate systems originating at the bubble centers. For the 2D simulations, which model the plane , . For the 3D simulations, is zero near the z-axis, rises from 0 to 1 from to , and similarly from to . The rise is given by the polynomial which approximates a Gaussian shape. The motional electric field is initialized as , where at . The 2D (3D) simulations use a box of size () and are evolved to , where is the relevant timescale for the interaction. The boundaries along the outflow directions are absorbing for the particles initially in the plasma bubble, thermal re-emitting for the particles initially in the background plasma, and an absorbing layer Vay (2000) for the electromagnetic fields. The energy spectra presented are integrated over the electrons initially in the bubbles. Simulations with larger domains confirm that the boundaries are not affecting the results. Periodic boundaries are used along the inflow direction, taking advantage of the antisymmetry of the system. We note that the majority of reconnection simulation studies employ periodic boundaries in the direction of the reconnection outflows and thus may suffer unphysical effects from recirculating particles and radiation. Studying particle acceleration in the finite-sized systems of laser-driven plasmas would yield critical insight for understanding the role of boundary conditions and particle escape in models of reconnection.
To directly match laboratory conditions of interest (e.g. those generated with the OMEGA EP laser Fiksel et al. (2014)) we model a range of Alfvénic and sonic Mach numbers, and , where is the Alfvén speed and is the sound speed. We also match the high experimental plasma beta, . The bubble radii are for the 2D (3D) simulations, within the experimentally accessible range of Fox et al. (2012). The initial temperatures and are taken to be equal and uniform. The parameters and (where is the speed of light, and the ion and electron masses, and the ion charge) are not directly matched to experimental values due to computational expense. In the majority of the simuations we use and , with chosen to correctly match . By varying these parameters in the range and we have verified that the main results of this study are relatively insensitive to their exact values. All simulations use a spatial grid of resolution of and cubic interpolation for the particles. The 2D (3D) simulations use a timestep of and 64 (8) particles per cell per species.
We first analyze in detail the 2D simulation with and . We observe that the early evolution of the system is consistent with previous studies using this configuration Fox et al. (2011, 2012); Lu et al. (2013, 2014). As the plasma flows bring in the magnetic flux at super-Alfvénic speeds, the plasma is compressed by the ram pressure and the amplitude of the magnetic field increases by a factor of . A current sheet forms on the order of the ion inertial length, which is the scale at which electrons and ions decouple, enabling fast reconnection mediated by the Hall effect Pritchett (2001). The current sheet is then unstable to the tearing instability, and we observe the formation of a single plasmoid, consistent with linear theory which predicts , where is the half-width of the current sheet Pritchett et al. (1991). For the range of conditions simulated we typically observe magnetic field enhancement by a factor of 1.5 to 5 and the formation of 1-3 plasmoids. The calculation of the different terms in the generalized Ohm’s law () shows that the electric field in the diffusion region is predominantly supported by the Hall and off-diagonal electron pressure tensor terms, in agreement with previous kinetic studies of reconnection starting from the Harris equilibrium Pritchett (2001) and laser-driven reconnection Fox et al. (2011). For the geometry of our configuration the typical value of the reconnection electric field in the diffusion region is (Figure 1(c)). In terms of the local Alfvén speed and compressed magnetic field, we find at , when the plasmoid is just beginning to form. After the onset of reconnection, the finite size of the plasma bubbles results in reconnection outflows that are directed out of the interaction region.
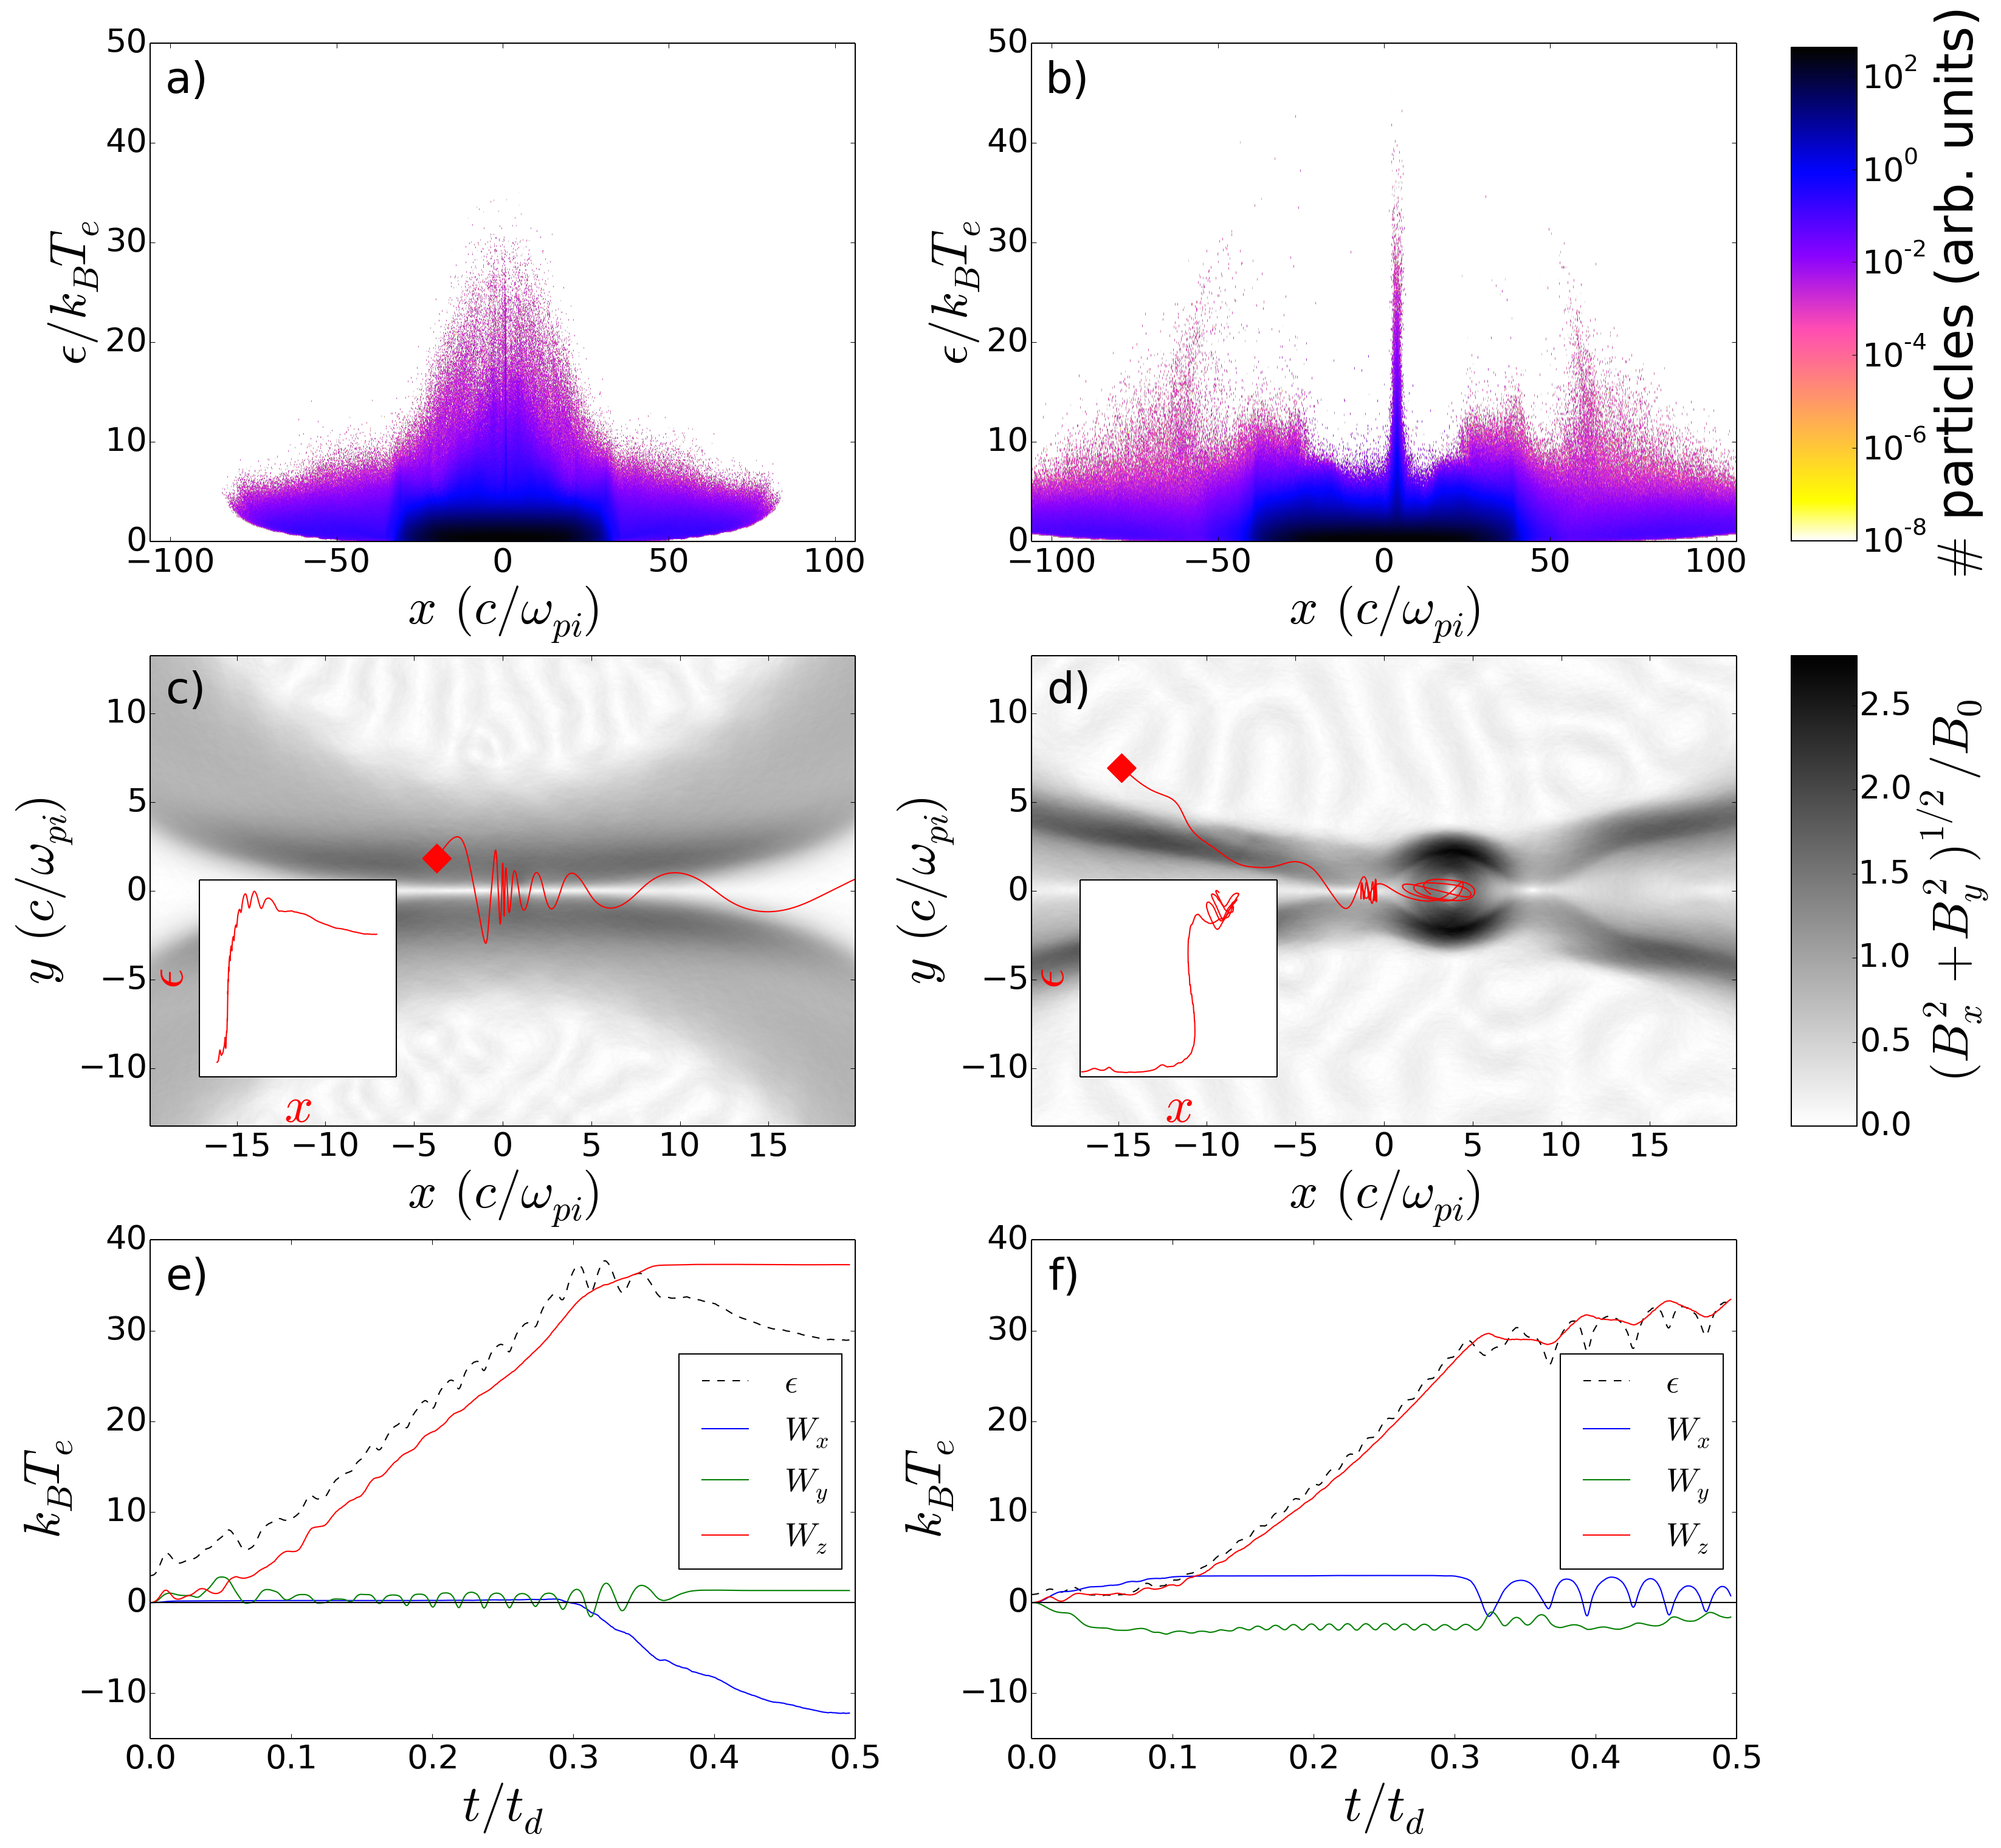
Figure 1(d) shows the temporal evolution of the electron energy spectrum for this simulation. We observe the development of a non-thermal component with energies up to that resembles a power law with index . In Figure 2(a), a distribution of energetic electrons is seen in the reconnection region. The energy decreases with distance from x = 0, which is approximately the location of the X-point before the plasmoid forms. At a later time, shown in Figure 2(b), energetic electrons are seen both to escape in the plasma outflows and to be trapped in a peak at the location of the single plasmoid that forms in the simulation. The most energetic electrons are trapped at . In a realistic 3D system, which we will discuss later, the trapped electrons would also escape the reconnection region, but along the z-direction.
In order to understand the details of the particle acceleration, we tracked the detailed motion of the most energetic electrons in the simulation. The relative importance of the electric field components in energizing the electrons was determined by calculating the work done by each throughout the simulation, . Figs. 2(c) and 2(d) show trajectories that illustrate the two distinct types of behavior observed for the energetic electrons. The evolution of the total energy and the work done by the electric field components for these electrons is plotted in Figs. 2(e) and 2(f). In both cases the particles gain the majority of their energy as they are accelerated in the out-of-plane direction by the reconnection electric field near the X-point, as can be seen in the insets in Figs. 2(c) and 2(d). The in-plane magnetic field then rotates the velocities of the electrons into the plane, at which point the electrons will either escape in the outflow direction (as in Figure 2(c)), become trapped in a plasmoid (as in Figure 2(d)), or travel around the bubble along the field lines. The electrons that escape the reconnection region lose some of their energy to the in-plane polarization electric field (Figure 2(e)), whereas the trapped electrons can be further accelerated due to the motion of the plasmoid. The energization rate is seen to decrease for the trapped electrons, as shown in Figure 2(f). In this simulation the plasmoid is slowly drifting along the outflow direction, and thus the trapped electrons see an out-of-plane motional electric field with alternating polarity (Figure 1(c)) as they circle inside the plasmoid Oka et al. (2010). Plasma flowing into the drifting plasmoid from the bounding X-points leads to an asymmetry in its motional electric field, allowing trapped electrons to gain further energy. Simulations with a single bubble confirm that the electric field from the bubble expansion does not significantly energize particles.
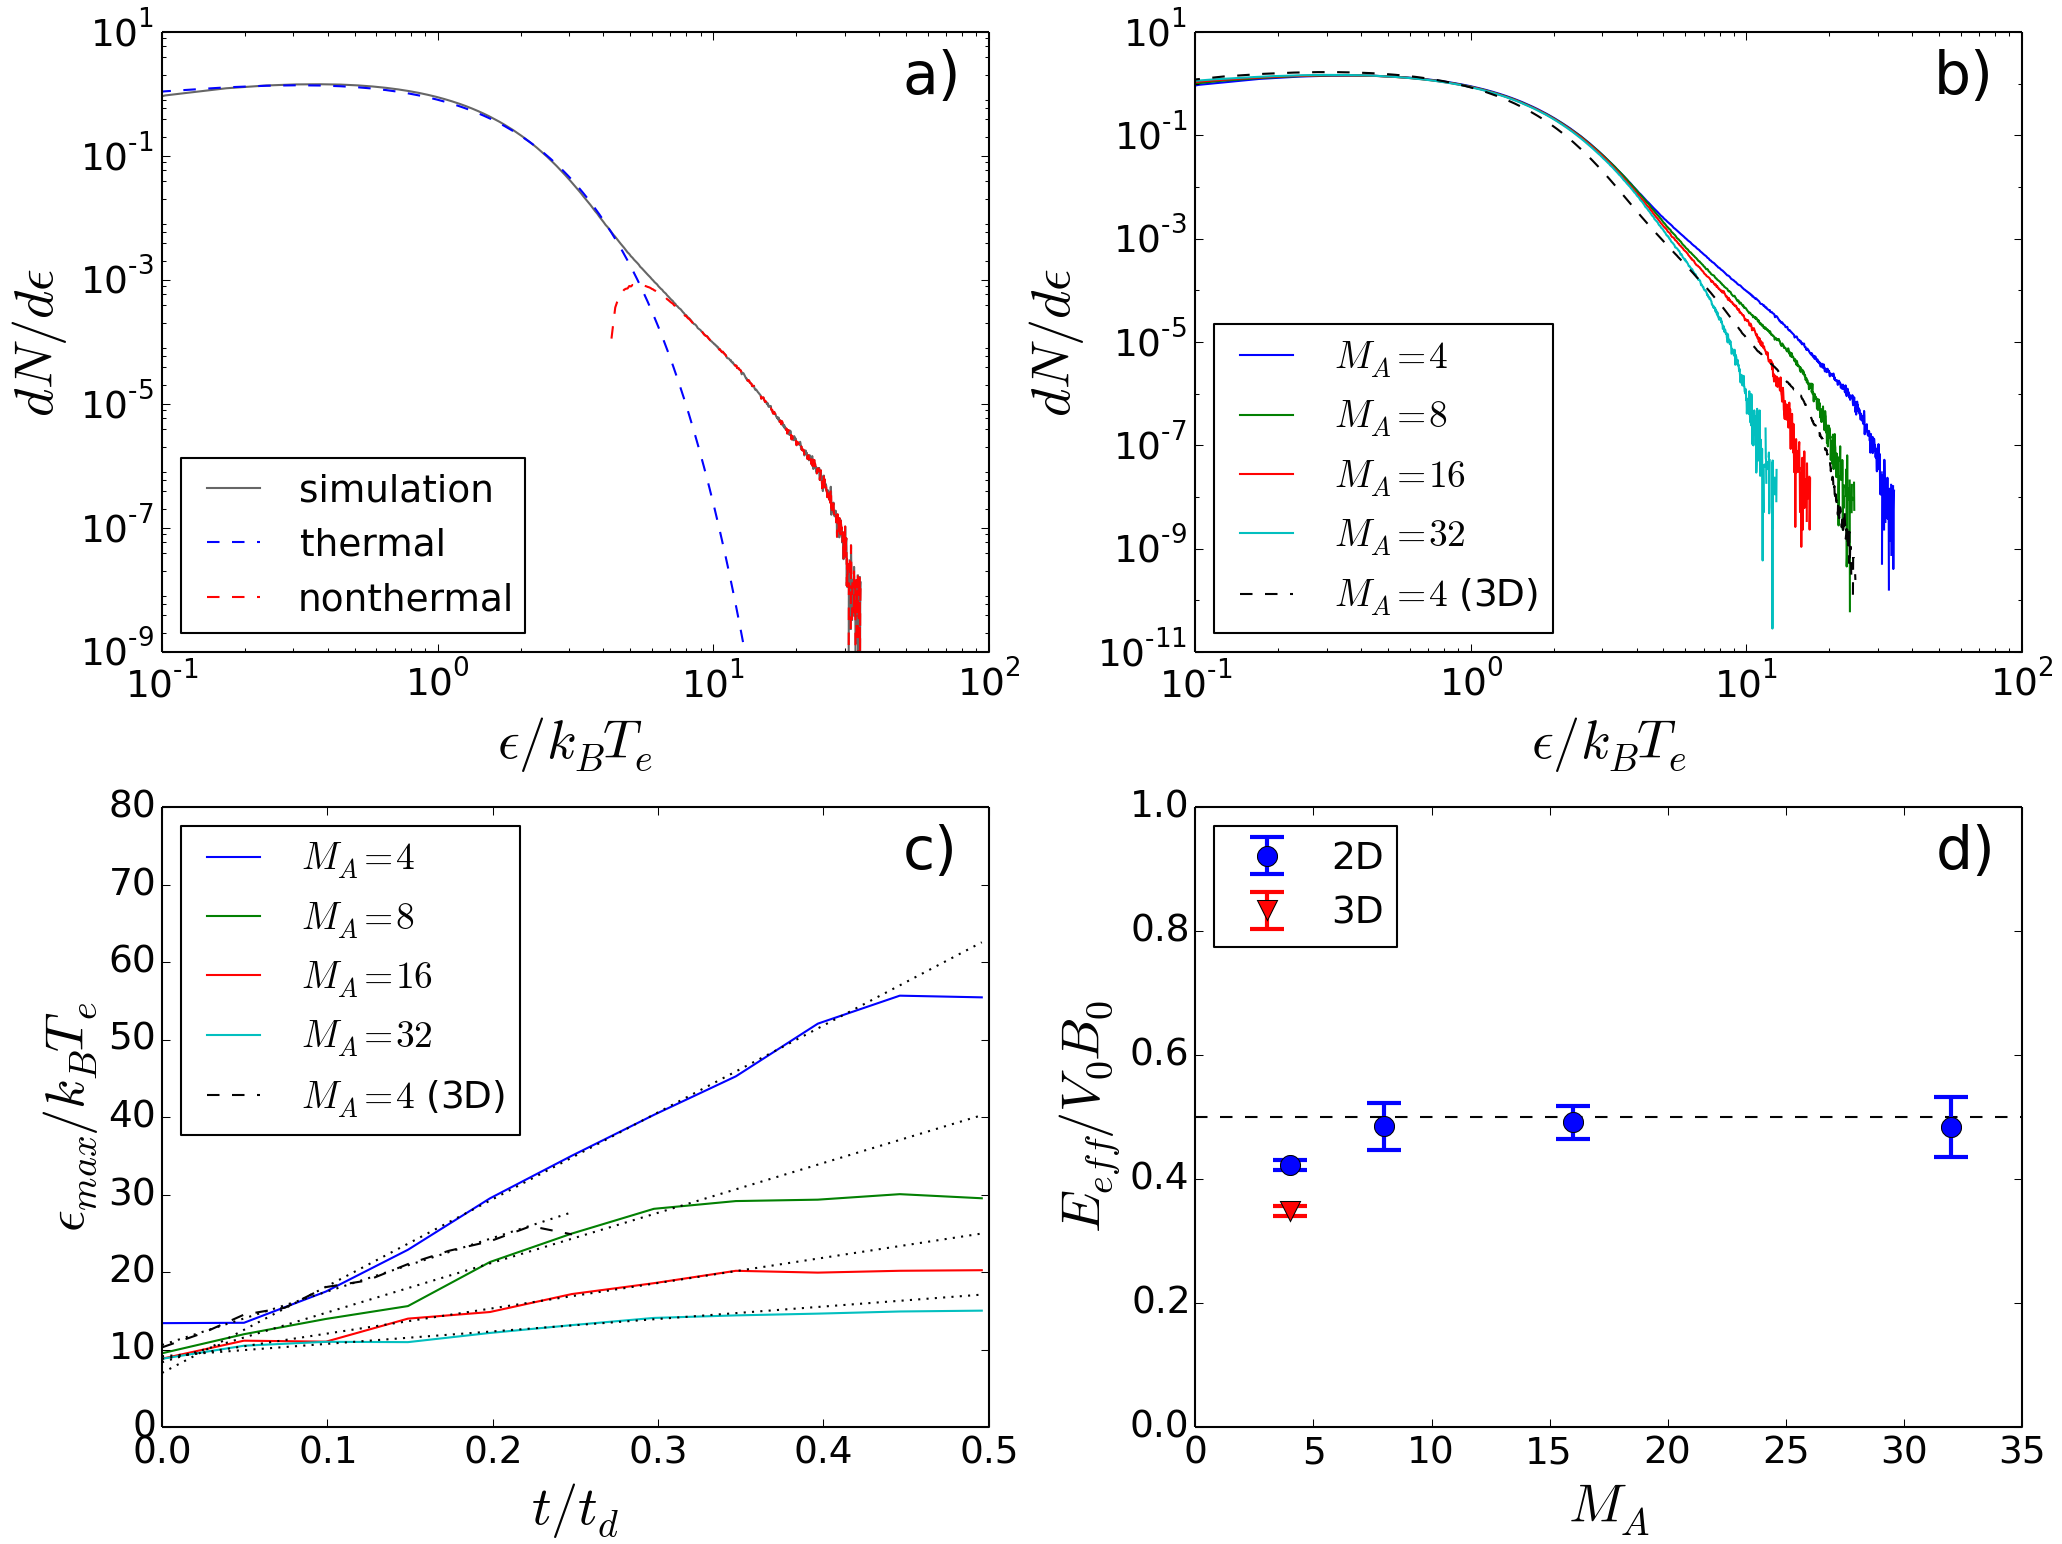
In Figure 3(a) we observe that the low-energy portion of the electron distribution is well fitted by a Maxwell-Boltzmann distribution (blue dashed line) and that there is a non-thermal component that starts at and resembles a power-law with an index of and an exponential cutoff at (red dashed line). Periodic simulations for the same plasma parameters but transversely infinite profiles (not shown here) show that in much larger systems the power-law component extends to higher energies and has a harder index of , indicating the importance of particle escape in finite systems. The comparison with transversely infinite systems will be discussed in detail elsewhere. At the end of the simulation (), the non-thermal component contains of the initial energy of interacting electrons, of the initial energy stored in the magnetic field, and of the total number of electrons initially in the bubbles. Previous work has shown that the presence of plasmoids may give rise to Fermi-acceleration mechanisms Drake et al. (2006). Calculating as a function of for the tracked particles (where is energy) shows an energization rate that is approximately constant, indicating that the dominant acceleration mechanism producing the energetic electrons is not Fermi acceleration. This is likely to require a much larger number of plasmoids and thus a more energetic laser drive than that used in current experiments. We note that even in the simulations with up to 3 plasmoids we do not observe evidence of Fermi acceleration associated with the plasmoids. In our case, the distribution of energies for the accelerated electrons is established as electrons are injected into the diffusion region at varied distances from the X-points and escape the diffusion region at different times. The electrons that interact nearer to the X-point are exposed to the reconnection electric field for a longer amount of time before the in-plane magnetic fields direct them out of the diffusion region, allowing them to reach higher energies Sironi and Spitkovsky (2014). Additional randomness is introduced by the finite probability for a given electron to escape from the system or become trapped in a plasmoid and further energized.
Figure 3(b) shows a comparison of the electron energy spectra at for four 2D simulations with and ranging from 4 to 32. All show the development of a high energy tail with a power-law shape and similar spectral indices, indicating the similarity of the acceleration mechanisms across these conditions. The maximum electron energy attained increases with the initial magnetic field amplitude, consistent with the picture that the electrons gain their energy directly from the reconnection electric field. Figure 3(c) shows the evolution of the maximum electron energy in each simulation, and the corresponding energization rates are shown in Figure 3(d). The effective electric field corresponding to the energization rate is found to be close to for all cases, consistent with the typical value of the reconnection electric field observed in the diffusion region in the simulations.
2D simulations do not capture the finite size of the system in the out-of-plane (acceleration) direction. It is thus critical to consider 3D effects. To this end we have performed full 3D simulations of reconnection between expanding plasma bubbles, with the initialization described above and the conditions . They show that the out-of-plane variation does not significantly change the acceleration picture but does limit the maximum electron energy attainable. An important difference to the 2D case is the fact that the amplitude of the magnetic field is only seen to increase by , in contrast with the increase in 2D. The electron spectrum at is shown in Figure 3(b). The spectrum exhibits a high-energy tail with a similar spectral index to the 2D case, demonstrating that the non-thermal energization survives in 3D and that the acceleration mechanisms are similar. The maximum electron energy is smaller for the 3D case, due to the finite out-of-plane size limiting the maximum energy attainable. The energization rate is also slightly smaller in 3D, due to the fact that the electrons do not see a uniform value of the reconnection electric field as they travel in the out-of-plane direction.
The finite out-of-plane size limits the distance over which an electron can be accelerated by the reconnection electric field to approximately the diameter of the bubble. Considering the effective value of the reconnection electric field is , an estimate for the maximum energy increase of an electron can then be written in terms of experimentally tunable parameters as . Applying this to the parameters of the 3D simulation presented above gives , which predicts well the location of the exponential cutoff of the power-law as shown in Figure 3(b). The threshold condition for producing suprathermal electrons in the laboratory is then , which is easily satisfied by the conditions accessible in current experiments. The conditions of two recent laser-driven reconnection experiments at the Omega Laser Facility Fox et al. (2012); Fiksel et al. (2014) are estimated to be , , and . For these conditions our model predicts maximum electron energies of . An important experimental signature of this acceleration due to reconnection is that the non-thermal electrons should be detected in a fan-like profile, with energetic electrons being emitted both in the direction of reconnection outflows and in the direction opposite to the reconnection electric field.
In summary, by performing ab initio kinetic simulations of magnetic reconnection in laser-driven plasmas, we have shown that these systems can accelerate non-thermal electrons to energies more than an order of magnitude larger than the thermal energy in conditions currently accessible in the laboratory. Electron injection at varied distances from the X-points and escape from the finite-sized system leads to a non-thermal component that resembles a power-law spectrum. Our results indicate that laser-driven plasmas thus offer a new platform for the experimental study of particle acceleration induced by reconnection, which could help illuminate the role reconnection plays in explosive phenomena associated with space and astrophysical plasmas.
Acknowledgements.
This work was supported by the U.S. Department of Energy SLAC Contract No. DE-AC02-76SF00515. The authors acknowledge the OSIRIS Consortium, consisting of UCLA and IST (Portugal) for the use of the OSIRIS 3.0 framework and the visXD framework. S. T. was supported by the NCSA through the Blue Waters Graduate Fellowship program and the Department of Defense through the NDSEG fellowship program. This work was also partially supported by DOE Fusion Energy Science, the SLAC LDRD program, and by the NSF Grant (PICKSC), AC11339893. Simulations were run on Mira (ALCF supported under Contract No. DE-AC02-06CH1135) through an INCITE award, on Blue Waters, and on the Bullet Cluster at SLAC.References
- Zweibel and Yamada (2009) E. G. Zweibel and M. Yamada, Annual Review of Astronomy and Astrophysics 47, 291 (2009).
- Ji and Daughton (2011) H. Ji and W. Daughton, Physics of Plasmas 18, 1 (2011) .
- Joglekar et al. (2014) A. S. Joglekar, A. G. R. Thomas, W. Fox, and A. Bhattacharjee, Physical Review Letters 112, 1 (2014).
- Taylor (1986) J. B. Taylor, Reviews of Modern Physics 58, 741 (1986).
- Oka et al. (2010) M. Oka, T.-D. Phan, S. Krucker, M. Fujimoto, and I. Shinohara, The Astrophysical Journal 714, 915 (2010) .
- Fu et al. (2006) X. R. Fu, Q. M. Lu, and S. Wang, Physics of Plasmas 13, 1 (2006).
- Hoshino et al. (2001) M. Hoshino, T. Mukai, T. Terasawa, and I. Shinohara, Journal of Geophysical Research 106, 25979 (2001).
- Drake et al. (2006) J. F. Drake, M. Swisdak, H. Che, and M. A. Shay, Nature 443, 553 (2006).
- Dahlin et al. (2014) J. T. Dahlin, J. F. Drake, and M. Swisdak, Physics of Plasmas 092304, 19 (2014) .
- Guo et al. (2014) F. Guo, H. Li, W. Daughton, and Y.-H. Liu, Physical Review Letters 155005, 4 (2014) .
- Sironi and Spitkovsky (2014) L. Sironi and A. Spitkovsky, The Astrophysical Journal 783, L21 (2014) .
- Loureiro et al. (2007) N. F. Loureiro, A. A. Schekochihin, K. College, and S. C. Cowley, Physics of Plasmas 14, 14 (2007) .
- Nilson et al. (2006) P. M. Nilson, L. Willingale, M. C. Kaluza, C. Kamperidis, S. Minardi, M. S. Wei, P. Fernandes, M. Notley, S. Bandyopadhyay, M. Sherlock, R. J. Kingham, M. Tatarakis, Z. Najmudin, W. Rozmus, R. G. Evans, M. G. Haines, A. E. Dangor, and K. Krushelnick, Physical Review Letters 97, 1 (2006).
- Li et al. (2007) C. K. Li, F. H. Séguin, J. A. Frenje, J. R. Rygg, R. D. Petrasso, R. P. J. Town, O. L. Landen, J. P. Knauer, and V. A. Smalyuk, Physical Review Letters 99, 055001 (2007).
- Nilson et al. (2008) P. M. Nilson, L. Willingale, M. C. Kaluza, C. Kamperidis, S. Minardi, M. S. Wei, P. Fernandes, M. Notley, S. Bandyopadhyay, M. Sherlock, R. J. Kingham, M. Tatarakis, Z. Najmudin, W. Rozmus, R. G. Evans, M. G. Haines, A. E. Dangor, and K. Krushelnick, Physics of Plasmas 15, 092701 (2008).
- Willingale et al. (2010) L. Willingale, P. M. Nilson, M. C. Kaluza, A. E. Dangor, R. G. Evans, P. Fernandes, M. G. Haines, C. Kamperidis, R. J. Kingham, C. P. Ridgers, M. Sherlock, a. G. R. Thomas, M. S. Wei, Z. Najmudin, K. Krushelnick, S. Bandyopadhyay, M. Notley, S. Minardi, M. Tatarakis, and W. Rozmus, Physics of Plasmas 17, 043104 (2010).
- Zhong et al. (2010) J. Zhong, Y. Li, X. Wang, J. Wang, Q. Dong, C. Xiao, S. Wang, X. Liu, L. Zhang, L. An, F. Wang, J. Zhu, Y. Gu, X. He, G. Zhao, and J. Zhang, Nature Physics 6, 984 (2010).
- Dong et al. (2012) Q. L. Dong, S. J. Wang, Q. M. Lu, C. Huang, D. W. Yuan, X. Liu, X. X. Lin, Y. T. Li, H. G. Wei, J. Y. Zhong, J. R. Shi, S. E. Jiang, Y. K. Ding, B. B. Jiang, K. Du, X. T. He, M. Y. Yu, C. S. Liu, S. Wang, Y. J. Tang, J. Q. Zhu, G. Zhao, Z. M. Sheng, and J. Zhang, Physical Review Letters 108, 1 (2012) .
- Fiksel et al. (2014) G. Fiksel, W. Fox, A. Bhattacharjee, D. H. Barnak, P.-Y. Chang, K. Germaschewski, S. X. Hu, and P. M. Nilson, Physical Review Letters 113, 1 (2014).
- Yamada et al. (2010) M. Yamada, R. Kulsrud, and H. Ji, Reviews of Modern Physics 82, 603 (2010).
- Haines (1997) M. Haines, Physical Review Letters 78, 254 (1997).
- Ryutov et al. (2000) D. D. Ryutov, R. P. Drake, and B. A. Remington, The Astrophysical Journal Supplement Series 127, 465 (2000).
- Hemker (2015) R. G. Hemker, (2015), arXiv:1503.00276 .
- Fonseca et al. (2002) R. Fonseca, L. Silva, and F. Tsung, Science—ICCS 2002 , 342 (2002).
- Fonseca et al. (2008) R. A. Fonseca, S. F. Martins, L. O. Silva, J. W. Tonge, F. S. Tsung, and W. B. Mori, Plasma Physics and Controlled Fusion 124034, 10 (2008) .
- Fonseca et al. (2013) R. A. Fonseca, J. Vieira, F. Fiuza, A. Davidson, F. S. Tsung, W. B. Mori, and L. O. Silva, Plasma Physics and Controlled Fusion 55, 124011 (2013) .
- Fox et al. (2011) W. Fox, A. Bhattacharjee, and K. Germaschewski, Physical Review Letters 106, 215003 (2011) .
- Fox et al. (2012) W. Fox, A. Bhattacharjee, and K. Germaschewski, Physics of Plasmas 19 (2012), 10.1063/1.3694119.
- Lu et al. (2013) S. Lu, Q. Lu, Q. Dong, C. Huang, S. Wang, J. Zhu, Z. Sheng, and J. Zhang, Physics of Plasmas 20, 112110 (2013).
- Lu et al. (2014) S. Lu, Q. Lu, C. Huang, Q. Dong, J. Zhu, Z. Sheng, S. Wang, and J. Zhang, New Journal of Physics 16, 083021 (2014).
- Ryutov et al. (2013) D. D. Ryutov, N. L. Kugland, M. C. Levy, C. Plechaty, J. S. Ross, and H. S. Park, Physics of Plasmas 20, 032703 (2013).
- Vay (2000) J.-L. Vay, Journal of Computational Physics 165, 511 (2000).
- Pritchett et al. (1991) P. L. Pritchett, F. V. Coroniti, R. Pellat, and H. Karimabadi, Journal of Geophysical Research 96 (1991), 10.1029/91JA01094.
- Pritchett (2001) P. L. Pritchett, Journal of Geophysical Research 106, 3783 (2001).