Influence of tetragonal platelets on the dielectric permittivity of
Abstract
We study the temperature-dependent evolution of the octahedral tilt order in a lead-free relaxor ferroelectric and its impact on the ferroelectric properties. Using diffuse neutron scattering on a single crystal, we suggest a model for the temperature-dependent nanostructure of this perovskite that features chemically pinned tetragonal platelets embedded in the rhombohedral matrix, often separated by a cubic intermediate phase. Our results show a clear correlation between the squared thickness of the tetragonal platelets and the dielectric permittivity. This is interpreted as a sign for increased polarizability of the strained and distorted lattice at the center of the tetragonal platelets.
pacs:
61.72.Dd, 81.30.Hd, 66.30.hd, 77.80.JkI Introduction
The scientific quest to replace commonly used lead-based ferroelectrics with lead-free alternatives, which would be significantly less hazardous for human health and our environment, has been ongoing for a number of years.Rödel et al. (2009) The very first customer products using lead-free ferroelectrics are currently being introduced to the market.Rödel et al. (2015) However, the properties of those lead-free materials that are known today need to be improved further in order to make them suitable for a wider range of applications. The solid solution of (NBT) and is known as a promising candidate, but the mechanisms leading to its relaxor properties are not yet clear.Rödel et al. (2015) It is thus evident that more research needs to be undertaken in order to clarify the underlying mechanisms and systematically investigate ways to increase the performance of this material.
As a solid solution between two perovskite titanates, (NBT-BT) also possesses a perovskite structure.Jo et al. (2011); Picht et al. (2010) Depending on composition and temperature, cubic, tetragonal, rhombohedral, and monoclinic symmetries have been reported.Takenaka et al. (1991); Ma and Tan (2011); Ma et al. (2013) In the specific case (NBT-3.6BT), the cubic , tetragonal and rhombohedral structures have traditionally been assigned as a function of decreasing temperature.Ma and Tan (2010); Daniels et al. (2011); *Daniels2012 However, it is still unclear whether the original phase diagrams by Takenaka et al. (1991) on poled ceramics and by Ma and TanMa and Tan (2010) for unpoled ceramics have to be revised to include a monoclinic phase field.Gorfman and Thomas (2010); *Gorfman2012; Aksel et al. (2011a); Usher et al. (2012); Ma et al. (2013); Beanland and Thomas (2014); Fuentes-Cobas et al. (2014); Ge et al. (2014); Gorfman et al. (2015) Since a reliable distinction between the rhombohedral and monoclinic phases is not required for our analysis, and because it is experimentally challenging, we will use the designation “rhombohedral” instead of “rhombohedral or monoclinic”.
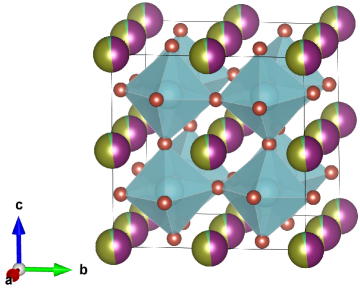
In the space groups , , and , the pseudocubic unit cell can be distorted in different ways. All of these space groups possess a characteristic polar axis, along which ferroelectric shifts of the cations are possible. Furthermore, these space groups permit tilting of the oxygen octahedra about the respective polar axis. These two order parameters, i.e., ferroelectric shifts and octahedral tilting, can indeed be coupled.Gröting (2013) In any case, the determination of the local tilt system is an established method for the identification of the local symmetry,Glazer (1972); *Glazer1975; Woodward and Reaney (2005) and thus possible domain configurations. In Glazer’s notation,Glazer (1972); *Glazer1975 which is commonly used for specifying octahedral tilt systems in perovskites, the tilt system in the cubic phase can be described as (no tilt). The tetragonal phase possesses in-phase tilting about the axis. Finally, the rhombohedral phase is associated with antiphase tilt. The double pseudocubic unit cell of NBT-3.6BT with symmetry is depicted in Fig. 1. The edge length is and the rhombohedral angle is .Jo et al. (2011) The local disorder of the positionsShuvaeva et al. (2005); Thomas et al. (2005) is not shown. The tilt system with tetragonal symmetry leads to superlattice reflections (SRs) at -type positions,Woodward and Reaney (2005) where stands for odd and for even integers. From here on, all reflections will be indexed with respect to the single pseudocubic unit cell with . The -type reflections are associated with the tetragonal phase and will be collectively referred to as “-type”. Since -type (except for the forbidden , odd) SRs are due to tilts, they will be designated as “-type”. The designation “-type” will be used for the ( odd) SRs, which could be caused by a monoclinic structureGorfman and Thomas (2010) with tilting.Stokes et al. (2002) The occurrence of mixed tilting, most importantly in the orthorhombic phase with the tilt system,Dorcet et al. (2008) would lead to the observation of additional -type (except for the forbidden , odd) SRs,Woodward and Reaney (2005) designated as “O-type”.
The sequence of phase transitions in NBT-3.6BT is comparable to that of pure NBT. Detailed studies of the phase transitions in the NBT system have been performed during the past 30 years.Pronin et al. (1980); Zvirgzds et al. (1982); Vakhrushev et al. (1982); Jones and Thomas (2002); Balagurov et al. (2006); Dorcet et al. (2008); Trolliard and Dorcet (2008); Aksel et al. (2011b); Deng et al. (2014); Gorfman et al. (2015) The addition of 3.6% shifts the temperature regions of the diffuse phase transitions from 503 K to approximately 463 K () and from 613 to 583 K ().Takenaka et al. (1991) Moreover, diffuse scattering studies on both systems have documented the presence of -type SRs close to room temperature.Kusz et al. (1999); Trolliard and Dorcet (2008); Daniels et al. (2011); *Daniels2012; Yao et al. (2012); Matsuura et al. (2013); Ge et al. (2013a) On the other hand, no -type SRs have been observed in recent neutron and synchrotron x-ray powder-diffraction experiments.Usher et al. (2012); Rao et al. (2013a); *Rao2013a; Garg et al. (2013a); *Garg2013a; Ge et al. (2014); Fuentes-Cobas et al. (2014) This can be understood considering that the -type SRs are elongated close to room temperature and exhibit a rather diffuse character,Trolliard and Dorcet (2008); Daniels et al. (2011); *Daniels2012; Ge et al. (2013a) so that the corresponding powder reflections become much broader and less intense than those that would be expected from a bulk tetragonal sample. Additionally, the low x-ray scattering power of oxygen makes the -type SRs particularly weak in x-ray powder diffraction. Consequently, they may not be detectable if the tetragonal phase fraction is too low. Furthermore, Ge et al. (2012) have shown that octahedral tilt order can occur even when no measurable tetragonal distortion of the crystal lattice is present. In other words, the absence of the splitting of fundamental reflections such as in a powder diffraction pattern does not imply the absence of tilting. Indeed, a cubic minority phase has been proposed by Aksel et al. (2011b) and Usher et al. (2012) based on their powder diffraction profile refinements. It is thus conceivable that the macroscopically rhombohedral NBT and NBT-3.6BT contain a low volume fraction of a metrically cubic phase with tilting at room temperature. In addition to this tetragonal minority phase, a recent NMR experiment has provided direct evidence for the presence of an undistorted cubic phase.Groszewicz et al. (2014)
The domain structure has predominantly been investigated using transmission electron microscopy. Whereas an early study by Soukhojak et al. (2000) reported the absence of domains in -doped NBT, the presence of domains could later be verified. Ma and Tan (2010) have observed a strong composition dependence of the domain structure. For and , rhombohedral domains of approximately 100 nm have been found to dominate. They are separated by domain walls, which are oriented parallel to .Ma et al. (2013, 2010) In contrast, significantly smaller domains with an average size of approximately 50 nm have been reported for .Yao et al. (2012) The tetragonal domains in NBT-3.6BT have not been observed directly. In the case of ceramics with , approximately 40% of the grains possess a core-shell structure in which the shell region has symmetry.Ma and Tan (2010); Ma et al. (2010); Ma and Tan (2011) The shape of the tetragonal nanodomains in this region resembles thin platelets, which are oriented parallel to . They may be embedded in an undistorted cubic matrix phase. In NBT, nanometer-sized tetragonal plateletsDorcet and Trolliard (2008); Thomas et al. (2010); Matsuura et al. (2013); Ge et al. (2013b); Gorfman et al. (2015) (initially assumed to be monoclinicKreisel et al. (2003); *Kreisel2004) with orientation parallel to have been used as a model to explain the observed diffuse x-ray, neutron, and electron scattering features. The tetragonal platelets could be imaged directly by Beanland and Thomas (2011), who have shown that, as opposed to ceramics, the platelets are inhomogeneously distributed in the rhombohedral matrix that constitutes most of the sample volume. Consequently, these two possibilities for the arrangement and local environment of the tetragonal platelets have to be considered at intermediate compositions such as NBT-3.6BT. As a transmission electron microscopy experiment on -doped NBT-BT has clearly shown, such a two-phase structure can occur on the length scale of a few unit cells.Schmitt and Kleebe (2010a); *Schmitt2010a The microstructure then approaches a modulated global structure such as the / model proposed by Levin and Reaney (2012) for NBT.
The various types of domains that were found in rhombohedral NBT are separated by different kinds of planar defects.Beanland (2011) Ferroelectric nanodomains with a size of about 10 - 50 nm are separated by twin planes with preferential orientation parallel to Dorcet and Trolliard (2008); Levin and Reaney (2012); Ma et al. (2013) and local tilting.Dorcet et al. (2008); Trolliard and Dorcet (2008) The possibility of (multiple) rotational twinning within one rhombohedral nanodomain has been studied by Major et al.[][(submitted)]Major2016 They showed that a simple model featuring rotational twins as the only planar defects in a rhombohedral matrix is sufficient to reproduce the electric-field-dependent diffuse x-ray scattering features. In the case of NBT-3.6BT, the tetragonal and cubic phase fractions have to be taken into consideration, too. Since the tilts in adjacent layers of octahedra are decoupled along the polar axis, the formation energy for a stacking fault in the tilt sequence is very low.Meyer et al. (2015) Domains with different crystallographic symmetry can only be joined by incommensurate interfaces, which typically extend over two to three layers of octahedra.Gröting et al. (2012) Specifically, Beanland (2011) has suggested that the transition from to tilting occurs via an orthorhombic transition region with tilting. This possibility, as well as the previously mentioned modulated global structure model, will be discussed in Sec. III.
A two-dimensional model of the nanostructure of NBT-3.6BT is presented in Fig. 2. In the first enlargement (center), the local distribution of the tetragonal phase is depicted in detail. Most importantly, it features nanometer-sized tetragonal platelets, some of which are separated from the rhombohedral matrix by a thin, tilt-free transition layer. The arrows indicate the local polarization direction in the rhombohedral domains. The second enlargement (right) shows a possible interface between the rhombohedral matrix and a tetragonal platelet. The tilt angle is exaggerated for clarity. Note the distortion of the oxygen octahedra in the lower two layers.
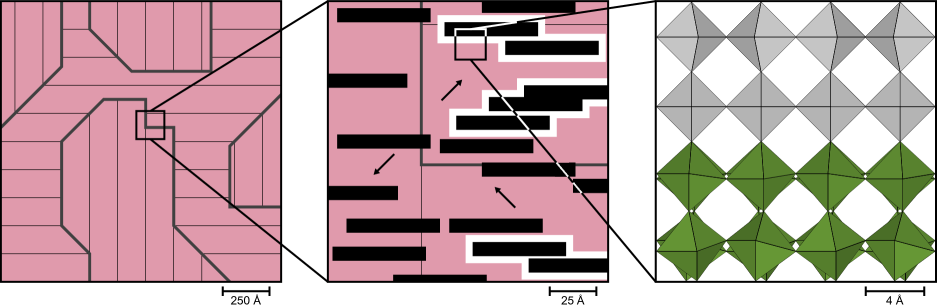
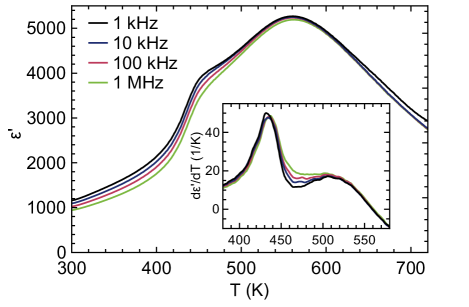
Figure 3 shows the dielectric function of unpoled NBT-3.6BT as a function of temperature and measurement frequency. The data shown in this figure were measured on a single-crystal plate with orientation parallel to . In the unpoled state, corresponding measurements on - and -oriented single crystals yield very similar results.Schneider et al. (2014) Like other relaxor ferroelectrics, NBT-3.6BT exhibits a clear frequency dispersion of the permittivity. In contrast to the prototypical relaxor , however, the temperature of the permittivity maximum does not depend on the measurement frequency in the case of NBT-3.6BT.Cross (1987) Nevertheless, NBT-BT is commonly described as a relaxor system.Chen et al. (2008); Xu et al. (2008); Craciun et al. (2012) The depolarization temperature , which corresponds to the maximum of the derivative depicted in the inset, and come rather close to the macroscopic phase transition temperatures reported by Takenaka et al. (1991) and are, respectively, 30 and 20 K below the phase transitions. Whereas an indirect correlation clearly exists, it is likely not due to a direct causal link.
For lead-based relaxor ferroelectrics, a clear picture of the nanostructure has been established in order to explain their peculiar dielectric properties. It is based on the concept of polar nanoregions (PNRs).Bokov and Ye (2006) In x-ray and neutron-scattering experiments, the PNRs have been associated with the diffuse scattering around fundamental reflections, i.e., reflections with integer , , and .Gehring (2012) These diffuse scattering features react to the application of an electric field to the sample, thus providing the link to its dielectric properties. It should be noted, however, that the association of this diffuse scattering with PNRs is not yet universally accepted.Bosak et al. (2012)
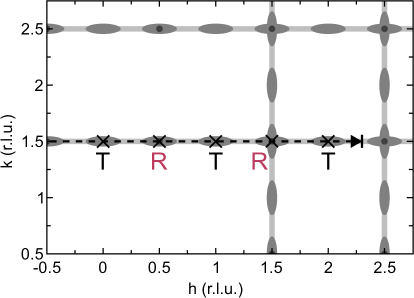
In contrast, lead-free relaxor ferroelectrics such as NBT-BT behave very differently. As previous diffuse scattering experiments on NBT-BT with have shown, it is the diffuse scattering in the scattering plane with that exhibits an electric field dependence.Daniels et al. (2011); *Daniels2012 (Reciprocal space coordinates and scattering vectors are given in reciprocal lattice units based on the perovskite unit cell with .) In fact, all scattering planes with half-integer contain field-dependent diffuse scattering features. The most important scattering components in the plane are schematically depicted in Fig. 4. Apart from the previously mentioned SRs at and comparatively diffuse SRs at , diffuse streaks connecting the reflections parallel to , , and are the most prominent features.Balagurov et al. (2006); Dorcet and Trolliard (2008); Daniels et al. (2011); *Daniels2012; Liu et al. (2012) The SRs, on the one hand, are due to the octahedral tilt within nanodomains with rhombohedral and tetragonal symmetry, respectively. On the other hand, the diffuse streaks are caused by planar defects in the nanostructure with orientation parallel to and an average distance of 20 nm.Major et al. (2016)
We characterize the temperature dependence of the disorder in NBT-3.6BT using elastic diffuse neutron scattering. The thermal evolution of the nanodomain structure is investigated with a special focus on correlation lengths. Finally, the observed features are related to the macroscopic permittivity.
II Experimental
The data were collected at the thermal triple-axis spectrometer EIGERWagner et al. (2006); *Blau2009 using a double focusing pyrolytic graphite (PG) monochromator and a horizontally focusing PG analyzer. The sample was an unpoled single-crystal boule with the composition . It was grown using the top-seeded solution growth method. The starting composition had previously been used to grow other crystals whose composition was verified using inductively coupled plasma atomic emission spectrometry. The weight of the sample was approximately 8.6 g and its shape resembled a disk with a diameter of approximately 17 mm and a thickness of approximately 8.5 mm. The symmetry axis had grown parallel to . The sample was not polished.
The temperature was varied between 310 and 780 K using a small furnace. The sample was mounted in a small, thin-walled copper bucket to achieve high degrees of temperature stability and homogeneity. A thermocouple was placed very close to the sample, so that the sample temperature could be constantly monitored and stabilized.
Al2O3-based cement was used for fixing the sample on a copper wedge. This allowed us to conduct our measurements in the scattering plane as defined by the reciprocal lattice points and . The Al2O3-based cement was also used for subsequently fixing the wedge inside the previously described bucket. The lid, made out of solid copper, closed the sample space and provided the mechanical and thermal connection between the bucket and the hot finger of the furnace. A second copper container was placed around the bucket as additional thermal shielding. It was surrounded by the vacuum container made of aluminium.
The temperature range from 310 to 780 K was covered in nine steps, focusing on the crystallographic phase transitions. At each step, the purely elastic scattering along with was measured. Two further scans were performed without the sample at the highest and lowest temperature for later background subtraction.
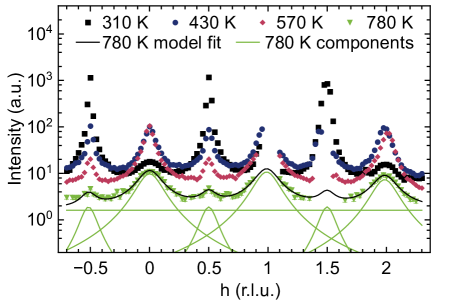
The following data reduction steps were undertaken: A linear interpolation of the empty container scattering intensity was performed due to its weak temperature dependence. This background was subtracted from the measured data. If the measured intensity at any given data point was below three times the interpolated background intensity, this point was neglected in the further analysis as potentially unreliable. This mainly applied to points around and , which coincide with two powder reflections of copper. The remaining reduced data were fitted with the sum of six Voigt peaks, representing the SRs, and a constant background. At , an additional Voigt component had to be introduced for a proper representation of the -type SRs. In any given fit, the intensity of the SRs at and was constrained to be equal, as were the Lorentzian widths for all -type SRs and for all -type SRs. The Gaussian width of all Voigt peaks was fixed at the calculated resolution of the spectrometer. This was estimated using the iFitFarhi et al. (2014); *Farhi2012-based ResLibCal package. The Popovici algorithmPopovici (1975) was used in the ResLib implementation. All least-squares refinements were carried out using Fityk 0.9.8.Wojdyr (2010)
After the measurements along , the sample was remounted on a different copper wedge. The new scattering plane was defined by the reciprocal-lattice points and . Subsequently, additional purely elastic-scattering measurements were carried out along with and along with . These measurements were made at 430, 480, and 570 K, respectively. The empty container scattering was measured at 480 K. The fits of the scans were made using one Lorentzian peak and a linear background. The peak position was held constant.
III Results and Discussion
The temperature and -dependence of our elastic neutron scattering measurements are shown in Fig. 5. Missing data points around and were excluded from further treatment due to strong container scattering. At 310 K, the SRs at -type are strong and well-defined, whereas the scattering at -type and is much weaker and broader. With increasing temperature, the intensity of the -type SRs strongly decays, although they remain visible even at 780 K. The -type SRs become stronger and sharper in the intermediate temperature range, but they are always visibly broader than their -type counterparts. In addition, there is also a strong, -independent component despite the previous background correction.
In the measurements along , which are shown in Fig. 6, a temperature-dependent -type superlattice reflection at is clearly seen. Its intensity shows the same temperature dependence as the -type SRs, i.e., the intensity ratio is constant within the error bars at . This is a strong indication that both types of superlattice reflection originate from the same regions of the sample and that the -type reflection is not due to higher order scattering from fundamental reflections such as . However, we cannot exclude the occurrence of multiple scattering as discussed in Ref. Gorfman and Thomas, 2010. Furthermore, the intensity ratio as predicted based on the model from Ref. Usher et al., 2012 is much lower at about 0.2% even for a bulk monoclinic sample. Therefore, we cannot draw any definitive conclusions regarding the crystallographic symmetry of the rhombohedral or monoclinic phase.
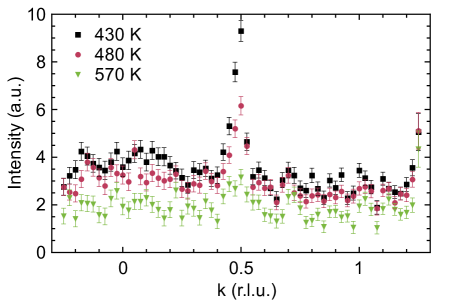
Second, we would like to emphasize the absence of the O-type superlattice reflection in Fig. 6 at . Levin and Reaney (2012) have argued that although tilting is present in NBT, the O-type SRs may not be detectable by electron scattering due to the low oxygen sensitivity of this probe. In the case of neutrons, the oxygen sensitivity is much higher, but still no superlattice reflection is visible in our scans. Consequently, it appears unlikely that an orthorhombic phase with tilting is present in NBT-3.6BT in the intermediate temperature range. This supports our assumption that the symmetry transition between the coexisting and tilt systems does not occur via an intermediate phase with a-a-c+ tilting. Instead, a completely tilt-free transition layer, as shown in Fig. 2, seems to be the most probable possibility. Furthermore, our model provides a natural explanation for the detection of an undistorted cubic component by Groszewicz et al. (2014)
Third, the background intensity in the purely elastic scans along with (Fig. 6) is significantly weaker than the -independent scattering component observed in the scans along (Fig. 5), where . The background in the scans can thus be used to derive an upper bound for the weakly -dependent scattering contributions that are present in the scans. The lower background intensity in the overlapping range, and the reduction of the background with increasing and , which is evident in Fig. 6, can also be observed in the scans along with (not shown). A tentative extrapolation to higher using both and data correspondingly yields a weakly -dependent background intensity that is significantly lower than the -independent intensity found along in the measured temperature range. We thus assume that the -independent scattering is dominated by the electric-field-dependent diffuse streak known from Ref. Daniels et al., 2011; *Daniels2012. Its intensity remains approximately constant up to 570 K and decreases upon further heating.
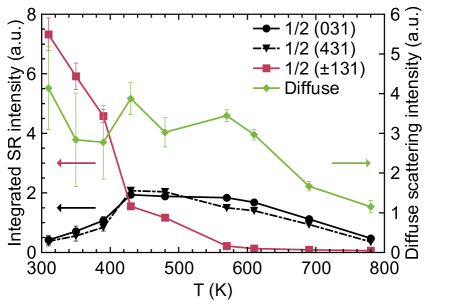
The detailed temperature dependence of both the superlattice reflection intensities and the elastic diffuse scattering intensity can be seen in Fig. 7. The intensity of the SRs has been integrated parallel to . The rhombohedral, tetragonal, and cubic phase fractions were estimated based on the integrated intensities of the SRs. The cubic phase fraction near room temperature was taken from Groszewicz et al. (2014) as . Jones and Thomas (2002) have shown for NBT that the tilt angles in the rhombohedral and tetragonal phases are only slightly temperature-dependent over large temperature ranges. We thus assume that the temperature dependence of the structure factors can be neglected. Thermal displacements are not considered. For the -type SRs, the structure factors were calculated using an model with a tilt angle of about the pseudocubic axis, which corresponds to the atomic positions given by Ranjan and Dviwedi.Ranjan and Dviwedi (2005) Since the tilt angle of pure NBT in the rhombohedral room temperature phase was given as ,Jones and Thomas (2002) the relative uncertainty of all tilt angles was assumed to be 20%. A Bi3+ position splitting of in the directionThomas et al. (2005) was also taken into account. In the tetragonal phase, the Ti4+ displacement along has no effect on the intensities of the SRs. The tilt angle has not been determined for NBT-3.6BT at elevated temperature, so that the model is based on the atomic positions provided by Jones and Thomas (2002) for pure NBT at 673 K, which correspond to a tilt angle of about the pseudocubic axis.
The measured intensities of the SRs were divided by the calculated and the Lorentz factors . A further correction was made to reflect the lower number of equivalent SRs in a monodomain single crystal compared to the assumed case of random orientation of the tilt domains. The resulting reduced intensity was assumed to be proportional to the respective phase fractions. It was calculated for both -type SRs individually and subsequently averaged. To obtain the proportionality constant, the total phase fraction of the non-cubic phases had to be taken into account. With the assumption that this proportionality constant is not temperature-dependent, all phase fractions could be calculated as a function of temperature. The error bars in Fig. 8 were determined by propagation of uncertainty.
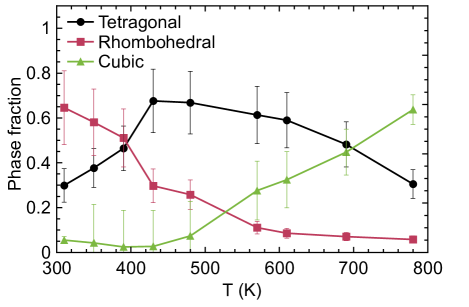
Even though the measured temperature range includes the two macroscopic phase transitions from rhombohedral to tetragonal and from tetragonal to cubic, it is immediately apparent from Fig. 8 that the rhombohedral and tetragonal phases are present throughout the investigated temperature range. The tetragonal phase fraction is very significant even at room temperature, which is over 100 K below the macroscopic rhombohedral to tetragonal phase transition. With increasing temperature, the rhombohedral phase fraction diminishes continuously. The cubic phase fraction appears to remain constant below about 430 K. Upon further heating, it grows linearly within the error bars. Nevertheless, at 780 K, which is about 200 K above the tetragonal to cubic phase transition, the actual cubic phase fraction is only around 64 % due to the presence of both rhombohedral and tetragonal phases.
The correlation lengths of the octahedral tilt order in the rhombohedral and tetragonal domains have been calculated from the Lorentzian broadening of the superlattice reflection profiles in Fig. 5. We assume that the correlations result from (possibly frozen) fluctuations, which lead to an Ornstein-Zernike form of the correlation function. The characteristic correlation length is then inversely proportional to the half width at half maximum of the corresponding scattering peak in reciprocal space. The mathematical relation is , with given in reciprocal lattice units and representing the lattice parameter in real space. The resulting correlation lengths are shown in Fig. 9. Since we used two Voigt components to fit the -type SRs below 480 K, we obtained two characteristic length scales of the rhombohedral tilt order.
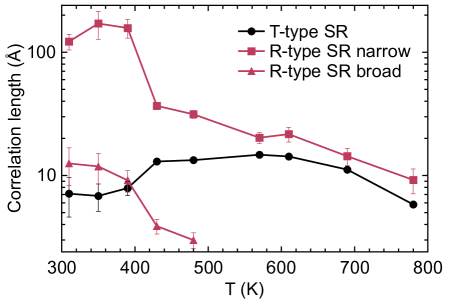
Figure 9 shows that the long-range correlations in the rhombohedral domains occur on a length scale of approximately 150 Å up to 390 K. At higher temperature, a continuous reduction of the correlation length is observed. The length scale of the short-range correlations decreases from 13 Å at 310 K to 3 Å above 430 K, i.e., one pseudocubic unit cell. We assume that these short-range correlations are due to the overdamped phonon, as proposed by Ge et al.Ge et al. (2013a)
On the other hand, the correlation length of the tetragonal domains increases by a factor of two around the rhombohedral to tetragonal phase transition and continues to increase to its maximum of roughly 15 Å around 600 K. It is particularly striking that the correlation length of the tilts in the tetragonal domains remains below 15 Å even when the sample is macroscopically tetragonal. This can be understood if the tetragonal domains are envisaged as small platelets in a rhombohedral or cubic matrix.
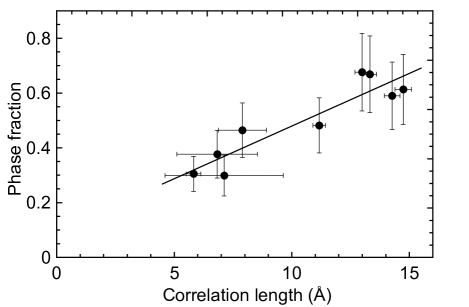
The phase fraction and tilt correlation length seem to be qualitatively correlated in both phases (compare Figs. 8 and 9). It turns out that the correlation coefficients are 0.92 for the rhombohedral phase (narrow component), 0.996 for the rhombohedral phase (broad component), and 0.92 for the tetragonal phase. Eliminating the influence of temperature yields partial correlation coefficients and 0.95, respectively, for the rhombohedral phase. Both correlation coefficients decrease slightly when the effect of temperature is eliminated, which shows that a causal relation between the correlation length and the phase fraction may be present. On the other hand, for the tetragonal phase, which is higher than and thus a strong indication that the phase fraction indeed depends on the correlation length. This dependence is shown in Fig. 10.
To derive a possible explanation for this linear dependence, let us briefly reconsider the dependence of the octahedral tilting on the chemical short-range order. The influence of chemical short-range order on the stability of different tilt systems has been shown for pure NBT by density-functional-theory calculations.Gröting et al. (2012) A crucial result of Gröting et al. (2012) was that at ambient pressure, the local cation configurations designated as “110”, “11-01xy”, and “111” favor out of phase tilts, whereas tilts are favored by local “10-01z”, “all3+1”, and “001” cation ordering. In agreement with Levin and Reaney,Levin and Reaney (2012) Gröting et al. (2012) propose the existence of chemically ordered nanoregions with tilting, embedded in a rhombohedral matrix. As we have shown, no O-type SRs are present in the case of NBT-3.6BT (see Fig. 6). We therefore assume that the in-phase tilting in NBT-3.6BT occurs in tetragonal nanoregions with tilt order. This difference between NBT and NBT-3.6BT seems plausible considering that NBT-3.6BT is closer to the tetragonal phase field and, according to Ma et al.,Ma et al. (2013) even in a different phase field than pure NBT.
Since the local cation ordering is stable as long as cation diffusion is not activated, the tetragonal nanoregions remain fixed in space and it can be assumed that their number density does not change significantly with temperature. It can thus be said that the tetragonal platelets seem to be chemically pinned. In addition to this effect of the local Na/Bi ordering, the tilt structure depends strongly on the concentration,Gröting and Albe (2014) so that chemical inhomogeneity could add to the pinning effect in NBT-BT. Coming back to the interpretation of Fig. 10, it seems likely that the thickness of the tetragonal platelets varies most strongly with temperature, whereas their other dimensions remain constant. Thus, the volume of the platelets would be a linear function of their thickness. Neglecting the possibility of stacking faults along the tetragonal direction, the thickness of the platelets corresponds to the tilt correlation length. If the number density of the tetragonal platelets is finally assumed to be constant, a linear dependence of the phase fraction on the tilt correlation length would result.
On this basis, a clear picture of the nanostructure can be drawn. The tetragonal platelets are distributed inhomogeneously in the crystal, as has been shown for pure NBT.Dorcet and Trolliard (2008); Beanland and Thomas (2011) At low temperatures, they are surrounded by large rhombohedral domains. The incompatibility of the tilt systems leads to a continuous transition, which in some cases involves a thin cubic layer at the interface. Due to the reduced stability of the rhombohedral tilt system at intermediate temperatures, the rhombohedral domains shrink, while the tetragonal platelets grow. At high temperatures, some rhombohedral domains disappear and the tetragonal platelets begin to shrink. The cubic interface layers, which now surround all platelets, grow to coalesce into a continuous matrix.
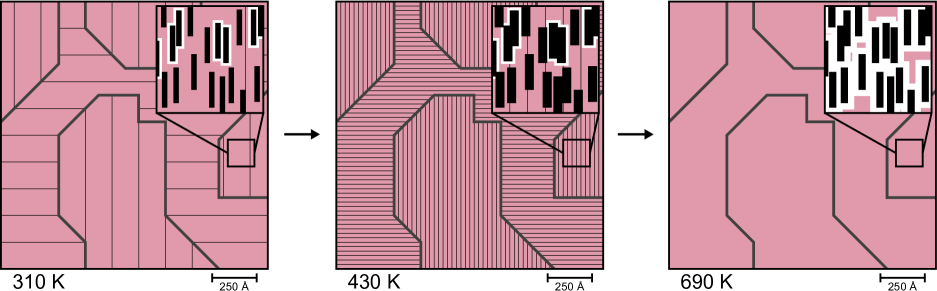
Figure 11 shows a model for the thermal evolution of the domain structure that was sketched in Fig. 2. The low cubic phase fraction at low to medium temperatures indicates that the tilt-free layers around the tetragonal platelets are very narrow, i.e., about one unit cell thick. In many cases, the tilt transition occurs on such a small length scale that all layers are distorted and a tilt-free layer does not occur at all. At high temperature, the cubic phase becomes dominant and the rhombohedral phase disappears. This means that the observed reduction of the correlation length in the rhombohedral phase upon heating is only partly due to domain fragmentation within the rhombohedral regions, which has mainly been observed at low to intermediate temperatures.Dorcet et al. (2008) The continuous growth and coalescence of the tilt-free regions clearly leads to an additional reduction of the rhombohedral domain size due to the inward movement of the phase boundaries.
A very interesting structure-property relationship can be observed in the correlation between the dielectric permittivity and the squared correlation length of the tetragonal domains. This is shown in Fig. 12.
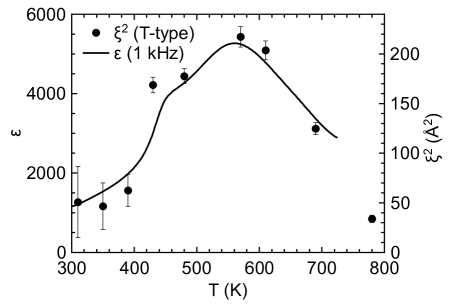
It is clearly seen in Fig. 12 that the temperature dependences of the permittivity and the squared correlation length are very similar. This shows that the thickness of the tetragonal platelets may be of crucial importance for the dielectric properties of NBT-based relaxors. If the polarizability were constant throughout the tetragonal platelets, a linear dependence of on the volume fraction and thus on (see Fig. 10) would be expected. The observation that is in fact proportional to could indicate that the local polarizability increases linearly with increasing distance from the undistorted cubic phase, i.e., with increasing octahedral tilting. Then , which is proportional to the volume integral of the local polarizability, would be proportional to , as we observe. This is consistent with the observation that the tetragonal phase fraction increases upon poling and exhibits a more pronounced field-induced distortion.Jo et al. (2011); Ge et al. (2013b); Hinterstein et al. (2015) A similar, qualitative correlation between the composition-dependent volume fraction of the tetragonal phase and the piezoelectric properties of NBT-BT has previously been proposed in Ref. Yao et al., 2012. Since we could show that the volume fraction of the tetragonal phase is proportional to its correlation length, the findings of Yao et al. (2012) are also consistent with the correlation shown in Fig. 12.
IV Conclusions
We have characterized the temperature dependence of the octahedral tilt order in NBT-3.6BT using elastic diffuse neutron scattering. In order to determine the volume fractions of the different octahedral tilt systems, we have investigated the intensity of the associated superlattice reflections. We have found no indication that an orthorhombic component is present. The phase fractions of the rhombohedral, tetragonal, and cubic components depend strongly on the temperature: Close to room temperature, the rhombohedral phase dominates, but the phase fraction decreases with increasing temperature. The tetragonal phase dominates in the intermediate temperature range. Since the reduction of the tetragonal phase fraction at high temperature is not very pronounced, the macroscopically cubic phase still contains over 30 % of the tetragonal phase, 200 K above the phase transition.
Furthermore, we have derived the correlation lengths of the rhombohedral and tetragonal domains from the superlattice reflection profiles. We have found it necessary to include two components of the rhombohedral SRs in the fitting model below 480 K, leading to two correlation lengths on different length scales. Both correlation lengths of the rhombohedral domains decrease continuously with increasing temperature. The tetragonal domains undergo only small size changes between 6 Å and 15 Å, and thus remain consistently smaller than the rhombohedral domains. Notably, the correlation length of the tetragonal domains exhibits the same temperature dependence as the tetragonal phase fraction. These results lead us to the conclusion that the nanostructure at ambient temperature features chemically pinned tetragonal platelets embedded in the rhombohedral matrix, often separated by a cubic intermediate phase. The thickness of the tetragonal platelets changes with temperature. The thickness of the cubic intermediate layers increases above the phase transition and leads to the coalescence of the cubic regions at high temperature, when the cubic phase is the dominant component of the matrix. The additional short range order in the rhombohedral phase below the macroscopic tetragonal to rhombohedral phase transition may be due to the soft phonon mode.
We have also found clear indications that the dielectric permittivity is a function of the tetragonal platelet thickness squared. This correlation leads us to the conclusion that the tetragonal phase becomes more polarizable with increasing distance from the tilt-free interfaces. However, the composition dependence of the dielectric properties shows that a bulk tetragonal phase exhibits a weaker response than a two-phase mixture.Jo et al. (2011); Garg et al. (2013a) Thus, the lattice strain induced by the surrounding rhombohedral matrix may facilitate the field-induced distortions whithin the tetragonal phase, so that a two-phase system with a high density of platelets with intermediate thickness could exhibit the best dielectric properties in the NBT-BT system. Due to the chemical pinning effect, the size and distribution of the tetragonal platelets can probably be influenced by the local chemical order. This means that controlling the chemical order may turn out to be an additional way of tailoring the dielectric properties of NBT-BT.
As a final remark, we would like to point out that our studies of the static structural features provide indications towards the atomistic origin of the temperature dependence of the dielectric permittivity. However, the frequency dependence of the permittivity at lower temperatures remains unexplained. Inelastic-scattering studies might help to shed some light on the underlying dynamic processes.
Acknowledgements.
The authors would like to acknowledge Daniel Rytz for the synthesis of the investigated single crystal. The authors are also indebted to Deborah Schneider for providing the permittivity data and insightful discussions. This work is based on experiments performed at the Swiss spallation neutron source SINQ, Paul Scherrer Institute, Villigen, Switzerland. This research project has been supported by the European Commission under the 7th Framework Programme through the “Research Infrastructures” action of the “Capacities” Programme, NMI3-II Grant number 283883. This work was funded by the Deutsche Forschungsgemeinschaft (DFG) under SFB 595 “Electrical Fatigue in Functional Materials.”References
- Rödel et al. (2009) J. Rödel, W. Jo, K. T. P. Seifert, E.-M. Anton, T. Granzow, and D. Damjanovic, J. Am. Ceram. Soc. 92, 1153 (2009).
- Rödel et al. (2015) J. Rödel, K. G. Webber, R. Dittmer, W. Jo, M. Kimura, and D. Damjanovic, J. Eur. Ceram. Soc. 35, 1659 (2015).
- Jo et al. (2011) W. Jo, J. E. Daniels, J. L. Jones, X. Tan, P. A. Thomas, D. Damjanovic, and J. Rödel, J. Appl. Phys. 109, 014110 (2011).
- Picht et al. (2010) G. Picht, J. Töpfer, and E. Hennig, J. Eur. Ceram. Soc. 30, 3445 (2010).
- Takenaka et al. (1991) T. Takenaka, K. Maruyama, and K. Sakata, Jpn. J. Appl. Phys. 30, 2236 (1991).
- Ma and Tan (2011) C. Ma and X. Tan, J. Am. Ceram. Soc. 94, 4040 (2011).
- Ma et al. (2013) C. Ma, H. Guo, and X. Tan, Adv. Funct. Mater. 23, 5261 (2013).
- Ma and Tan (2010) C. Ma and X. Tan, Solid State Commun. 150, 1497 (2010).
- Daniels et al. (2011) J. E. Daniels, W. Jo, J. Rödel, D. Rytz, and W. Donner, Appl. Phys. Lett. 98, 252904 (2011).
- Daniels et al. (2012) J. Daniels, W. Jo, and W. Donner, J. Miner. Met. Mater. Soc. 64, 174 (2012).
- Gorfman and Thomas (2010) S. Gorfman and P. A. Thomas, J. Appl. Crystallogr. 43, 1409 (2010).
- Gorfman et al. (2012) S. Gorfman, A. M. Glazer, Y. Noguchi, M. Miyayama, H. Luo, and P. A. Thomas, J. Appl. Crystallogr. 45, 444 (2012).
- Aksel et al. (2011a) E. Aksel, J. S. Forrester, J. L. Jones, P. A. Thomas, K. Page, and M. R. Suchomel, Appl. Phys. Lett. 98, 152901 (2011a).
- Usher et al. (2012) T.-M. Usher, J. S. Forrester, C. R. dela Cruz, and J. L. Jones, Appl. Phys. Lett. 101, 152906 (2012).
- Beanland and Thomas (2014) R. Beanland and P. A. Thomas, Phys. Rev. B 89, 174102 (2014).
- Fuentes-Cobas et al. (2014) L. E. Fuentes-Cobas, L. Pardo, M. E. Montero-Cabrera, J. R. Plaisier, A. García, K. Brebøl, E. Mercadelli, and C. Galassi, Cryst. Res. Technol. 49, 190 (2014).
- Ge et al. (2014) W. Ge, C. Luo, Q. Zhang, Y. Ren, J. Li, H. Luo, and D. Viehland, Appl. Phys. Lett. 105, 162913 (2014).
- Gorfman et al. (2015) S. Gorfman, D. S. Keeble, A. Bombardi, and P. A. Thomas, J. Appl. Crystallogr. 48, 1543 (2015).
- Gröting (2013) M. Gröting, Ph.D. thesis, Technische Universität Darmstadt (2013).
- Glazer (1972) A. M. Glazer, Acta Crystallogr., Sect. B 28, 3384 (1972).
- Glazer (1975) A. M. Glazer, Acta Crystallogr., Sect. A 31, 756 (1975).
- Woodward and Reaney (2005) D. I. Woodward and I. M. Reaney, Acta Crystallogr., Sect. B 61, 387 (2005).
- Shuvaeva et al. (2005) V. A. Shuvaeva, D. Zekria, A. M. Glazer, Q. Jiang, S. M. Weber, P. Bhattacharya, and P. A. Thomas, Phys. Rev. B 71, 174114 (2005).
- Thomas et al. (2005) P. A. Thomas, J. Kreisel, A. M. Glazer, P. Bouvier, Q. Jiang, and R. Smith, Z. Kristallogr. 220, 717 (2005).
- Stokes et al. (2002) H. T. Stokes, E. H. Kisi, D. M. Hatch, and C. J. Howard, Acta Crystallogr., Sect. B 58, 934 (2002).
- Dorcet et al. (2008) V. Dorcet, G. Trolliard, and P. Boullay, Chem. Mater. 20, 5061 (2008).
- Momma and Izumi (2011) K. Momma and F. Izumi, J. Appl. Crystallogr. 44, 1272 (2011).
- Pronin et al. (1980) I. P. Pronin, P. P. Syrnikov, V. A. Isupov, V. M. Egorov, and N. V. Zaitseva, Ferroelectrics 25, 395 (1980).
- Zvirgzds et al. (1982) J. A. Zvirgzds, P. P. Kapostin, J. V. Zvirgzde, and T. V. Kruzina, Ferroelectrics 40, 75 (1982).
- Vakhrushev et al. (1982) S. B. Vakhrushev, B. E. Kvyatkovskii, N. M. Okuneva, E. L. Plachenova, and P. P. Syrnikov, JETP Lett. 35, 134 (1982).
- Jones and Thomas (2002) G. O. Jones and P. A. Thomas, Acta Crystallogr., Sect. B 58, 168 (2002).
- Balagurov et al. (2006) A. M. Balagurov, E. Y. Koroleva, A. A. Naberezhnov, V. P. Sakhnenko, B. N. Savenko, N. V. Ter-Oganessian, and S. B. Vakhrushev, Phase Transitions 79, 163 (2006).
- Trolliard and Dorcet (2008) G. Trolliard and V. Dorcet, Chem. Mater. 20, 5074 (2008).
- Aksel et al. (2011b) E. Aksel, J. S. Forrester, B. Kowalski, J. L. Jones, and P. A. Thomas, Appl. Phys. Lett. 99, 222901 (2011b).
- Deng et al. (2014) G. Deng, S. Danilkin, H. Zhang, P. Imperia, X. Li, X. Zhao, and H. Luo, Phys. Rev. B 90, 134104 (2014).
- Kusz et al. (1999) J. Kusz, J. Suchanicz, H. Böhm, and J. Warczewski, Phase Transitions 70, 223 (1999).
- Yao et al. (2012) J. Yao, N. Monsegue, M. Murayama, W. Leng, W. T. Reynolds, Q. Zhang, H. Luo, J. Li, W. Ge, and D. Viehland, Appl. Phys. Lett. 100, 012901 (2012).
- Matsuura et al. (2013) M. Matsuura, H. Iida, K. Hirota, K. Ohwada, Y. Noguchi, and M. Miyayama, Phys. Rev. B 87, 064109 (2013).
- Ge et al. (2013a) W. Ge, C. P. Devreugd, D. Phelan, Q. Zhang, M. Ahart, J. Li, H. Luo, L. A. Boatner, D. Viehland, and P. M. Gehring, Phys. Rev. B 88, 174115 (2013a).
- Rao et al. (2013a) B. N. Rao, A. N. Fitch, and R. Ranjan, Phys. Rev. B 87, 060102 (2013a).
- Rao et al. (2013b) B. N. Rao, R. Datta, S. S. Chandrashekaran, D. K. Mishra, V. Sathe, A. Senyshyn, and R. Ranjan, Phys. Rev. B 88, 224103 (2013b).
- Garg et al. (2013a) R. Garg, B. N. Rao, A. Senyshyn, P. S. R. Krishna, and R. Ranjan, Phys. Rev. B 88, 014103 (2013a).
- Garg et al. (2013b) R. Garg, B. N. Rao, A. Senyshyn, and R. Ranjan, J. Appl. Phys. 114, 234102 (2013b).
- Ge et al. (2012) W. Ge, Y. Ren, J. Zhang, C. P. Devreugd, J. Li, and D. Viehland, J. Appl. Phys. 111, 103503 (2012).
- Groszewicz et al. (2014) P. B. Groszewicz, H. Breitzke, R. Dittmer, E. Sapper, W. Jo, G. Buntkowsky, and J. Rödel, Phys. Rev. B 90, 220104 (2014).
- Soukhojak et al. (2000) A. Soukhojak, H. Wang, G. Farrey, and Y.-M. Chiang, J. Phys. Chem. Solids 61, 301 (2000).
- Ma et al. (2010) C. Ma, X. Tan, E. Dul’kin, and M. Roth, J. Appl. Phys. 108, 104105 (2010).
- Dorcet and Trolliard (2008) V. Dorcet and G. Trolliard, Acta Mater. 56, 1753 (2008).
- Thomas et al. (2010) P. Thomas, S. Trujillo, M. Boudard, S. Gorfman, and J. Kreisel, Solid State Sci. 12, 311 (2010).
- Ge et al. (2013b) W. Ge, C. Luo, C. P. Devreugd, Q. Zhang, Y. Ren, J. Li, H. Luo, and D. Viehland, Appl. Phys. Lett. 103, 241914 (2013b).
- Kreisel et al. (2003) J. Kreisel, P. Bouvier, B. Dkhil, P. A. Thomas, A. M. Glazer, T. R. Welberry, B. Chaabane, and M. Mezouar, Phys. Rev. B 68, 014113 (2003).
- Kreisel et al. (2004) J. Kreisel, P. Bouvier, B. Dkhil, B. Chaabane, A. M. Glazer, P. A. Thomas, and T. R. Welberry, Ferroelectrics 302, 293 (2004).
- Beanland and Thomas (2011) R. Beanland and P. Thomas, Scr. Mater. 65, 440 (2011).
- Schmitt and Kleebe (2010a) L. A. Schmitt and H.-J. Kleebe, Funct. Mater. Lett. 03, 55 (2010a).
- Schmitt and Kleebe (2010b) L. A. Schmitt and H.-J. Kleebe, Funct. Mater. Lett. 03, 309 (2010b).
- Levin and Reaney (2012) I. Levin and I. M. Reaney, Adv. Funct. Mater. 22, 3445 (2012).
- Beanland (2011) R. Beanland, Acta Crystallogr., Sect. A 67, 191 (2011).
- Major et al. (2016) M. Major, J. E. Daniels, P. K. M. Tung, and W. Donner, J. Appl. Crystallogr. (2016).
- Meyer et al. (2015) K.-C. Meyer, M. Gröting, and K. Albe, J. Solid State Chem. 227, 117 (2015).
- Gröting et al. (2012) M. Gröting, I. Kornev, B. Dkhil, and K. Albe, Phys. Rev. B 86, 134118 (2012).
- Schneider et al. (2014) D. Schneider, W. Jo, J. Rödel, D. Rytz, and T. Granzow, J. Appl. Phys. 116, 044111 (2014).
- Cross (1987) L. E. Cross, Ferroelectrics 76, 241 (1987).
- Chen et al. (2008) M. Chen, Q. Xu, B. H. Kim, B. K. Ahn, J. H. Ko, W. J. Kang, and O. J. Nam, J. Eur. Ceram. Soc. 28, 843 (2008).
- Xu et al. (2008) C. Xu, D. Lin, and K. W. Kwok, Solid State Sci. 10, 934 (2008).
- Craciun et al. (2012) F. Craciun, C. Galassi, and R. Birjega, J. Appl. Phys. 112, 124106 (2012).
- Bokov and Ye (2006) A. Bokov and Z.-G. Ye, J. Mater. Sci. 41, 31 (2006).
- Gehring (2012) P. M. Gehring, J. Adv. Dielectr. 02, 1241005 (2012).
- Bosak et al. (2012) A. Bosak, D. Chernyshov, S. Vakhrushev, and M. Krisch, Acta Crystallogr., Sect. A 68, 117 (2012).
- Liu et al. (2012) Y. Liu, R. L. Withers, J. Wang, L. Norén, A. J. Studer, and Y. Li, J. Adv. Dielectr. 02, 1230012 (2012).
- Wagner et al. (2006) W. Wagner, J. Mesot, P. Allenspach, G. Kuehne, and H. Rønnow, Phys. B 385 - 386, Part 2, 968 (2006), Proceedings of the Eighth International Conference on Neutron Scattering.
- Blau et al. (2009) B. Blau, K. N. Clausen, S. Gvasaliya, M. Janoschek, S. Janssen, L. Keller, B. Roessli, J. Schefer, P. Tregenna-Piggott, W. Wagner, and O. Zaharko, Neutron News 20, 5 (2009).
- Farhi et al. (2014) E. Farhi, Y. Debab, and P. Willendrup, J. Neutron Res. 17, 5 (2014).
- Farhi (2012) E. Farhi, “The iFit data analysis library,” ILL, Computing for Science (2011-2012), http://ifit.mccode.org.
- Popovici (1975) M. Popovici, Acta Crystallogr., Sect. A 31, 507 (1975).
- Wojdyr (2010) M. Wojdyr, J. Appl. Crystallogr. 43, 1126 (2010).
- Ranjan and Dviwedi (2005) R. Ranjan and A. Dviwedi, Solid State Commun. 135, 394 (2005).
- Gröting and Albe (2014) M. Gröting and K. Albe, Phys. Rev. B 89, 054105 (2014).
- Hinterstein et al. (2015) M. Hinterstein, L. A. Schmitt, M. Hoelzel, W. Jo, J. Rödel, H.-J. Kleebe, and M. Hoffman, Appl. Phys. Lett. 106, 222904 (2015).