Searching for Binary Y dwarfs with the Gemini Multi-Conjugate Adaptive Optics System (GeMS)
Abstract
The NASA Wide-field Infrared Survey Explorer (WISE) has discovered almost all the known members of the new class of Y-type brown dwarfs. Most of these Y dwarfs have been identified as isolated objects in the field. It is known that binaries with L- and T-type brown dwarf primaries are less prevalent than either M-dwarf or solar-type primaries, they tend to have smaller separations and are more frequently detected in near-equal mass configurations. The binary statistics for Y-type brown dwarfs, however, are sparse, and so it is unclear if the same trends that hold for L- and T-type brown dwarfs also hold for Y-type ones. In addition, the detection of binary companions to very cool Y dwarfs may well be the best means available for discovering even colder objects. We present results for binary properties of a sample of five WISE Y dwarfs with the Gemini Multi-Conjugate Adaptive Optics System (GeMS). We find no evidence for binary companions in these data, which suggests these systems are not equal-luminosity (or equal-mass) binaries with separations larger than 0.5-1.9 AU. For equal-mass binaries at an age of 5 Gyr, we find that the binary binding energies ruled out by our observations (i.e. erg) are consistent with those observed in previous studies of hotter ultra-cool dwarfs.
Subject headings:
Brown dwarfs - stars: low–mass – binaries: general – Methods: observational - Techniques: imaging, simulations1. Introduction
The discovery of the coolest Y spectral class of brown dwarfs has extended the temperature range for isolated star-like objects down to 250 K (Cushing et al., 2011; Luhman, 2014). Their discovery enables the study of the properties of objects in the temperature gap between the coolest previously known sub-stellar objects (Teff 500 K) and gas-giant planets (Teff 130 K). Currently twenty–one Y dwarfs are known (Cushing et al., 2011; Kirkpatrick et al., 2012; Tinney et al., 2012; Liu et al., 2012; Kirkpatrick et al., 2013; Cushing et al., 2014; Pinfield et al., 2014), as well as three candidates awaiting spectroscopic confirmation (Liu et al., 2011; Luhman et al., 2011; Luhman, 2014; Schneider et al., 2015).
Most of the spectroscopically confirmed Y dwarfs have been identified as isolated field objects by the NASA Wide-field Infrared Survey Explorer (WISE, Wright et al., 2010). Searches for very low-mass binaries (defined as having a total system mass Mtot 0.2 M⊙ and primary mass M1 0.1 M⊙) have concentrated on high resolution imaging surveys, using both nearby field sources (e.g; Koerner et al., 1999; Burgasser et al., 2003; Reid et al., 2008; Gelino et al., 2011; Aberasturi et al., 2014) and young cluster associations (e.g; Martín et al., 1998; Neuhäuser et al., 2002; Bouy et al., 2006; Todorov et al., 2014). These studies have determined a brown dwarf binary fraction of 10%–30% (Burgasser et al., 2007), which is substantially lower than the binary fraction of solar-type stellar systems ( 65%; Duquennoy & Mayor, 1991) and the binary fraction of early-type M stars ( 30%–40%; Delfosse et al., 2004; Reid & Gizis, 1997). This trend could indicate either a mass dependence on the multiplicity or an as yet uncovered population of very low-mass binaries. The latter is strongly supported by the known incompleteness of the statistics for very tight (a 1 AU) and wide (a 100 AU) binaries (see Konopacky, 2013, and references therein).
The binary status of Y type brown dwarfs is also both unclear and of considerable interest. Open questions include: Is there a lower mass limit for the formation of binary systems? How common are Y dwarf binary systems? What is the mass ratio distribution between the components of Y dwarf binaries? A new generation of wide-field adaptive optics systems using laser-guide star constellations and deformable mirrors conjugating to multiple layers in the atmosphere offer the prospect of addressing these questions from the ground (in advance of JWST’s capabilities becoming available in space).
Binarity, in addition, has been proposed as an explanation for some of the spread seen in the absolute magnitudes of otherwise similar Y dwarfs (Tinney et al., 2014; Leggett et al., 2015). The latest atmospheric models (Morley et al., 2012) are consistent with the majority of the observed absolute magnitudes for Y dwarfs. However, some (including WISEA J053516.87–750024.6 and WISEA J035934.07–540154.8 studied in this paper) show disparities. These objects appear to be over-luminous in MJ and MW2 relative to cloud-free models suggesting either the presence of condensate clouds or equal-mass binarity. Binary Y dwarf systems, once identified, also offer the opportunity to empirically measure dynamical masses (e.g; Dupuy et al., 2009; Konopacky et al., 2010).
These issues motivated a diffraction-limited study to determine the binary status of five Y dwarfs using the Gemini Multi-Conjugate Adaptive Optics System (GeMS). In Section 2, the properties of our sample, observations and data reduction are detailed. In Section 3 the binary status of our targets is examined, and conclusions are presented in Section 4.
2. Observations and data reduction
| Full designation | Short name | J3 | Spectral type | ||
|---|---|---|---|---|---|
| (mag) | (mas) | ||||
| WISEA J035934.07–540154.8 | W0359 | 21.40 0.09 | 63.2 6.0 | Y0 | |
| WISEA J053516.87–750024.6 | W0535 | 22.09 0.07 | 74.0 14.0 | Y1 | |
| WISEA J071322.55–291752.0 | W0713 | 19.42 0.03 | 108.7 4.0 | Y0 | |
| WISEP J154151.65–225025.2 | W1541 | 20.99 0.03 | 175.1 4.4 | Y1 | |
| WISEA J163940.83–684738.6 | W1639 | 20.57 0.05 | 202.3 3.1 | Y0pec |
We observed a sample of five nearby Y dwarfs discovered by WISE (see Table 1). The full WISE designation, near-infrared J3 photometry, parallax and spectral type for the sample are also listed. These objects were observed with the Gemini South Adaptive Optics Imager (GSAOI, McGregor et al., 2004; Carrasco et al., 2012) and corrected for atmospheric aberrations by the Gemini Multi–Conjugate Adaptive Optics System (GeMS, d’Orgeville et al., 2012). GSAOI has a pixel scale of 0.02 and is composed of four 20482048 Rockwell HAWAII–2RG arrays that form a near-infared imaging mosaic. Each detector offers access to a field of view of 41x41. All observations were carried out in the GSAOI passband (1.486–1.628 m). This filter was chosen as this provides the optimal sensitivity for these faint objects with very strong methane absorption.
The extreme faintness of Y brown dwarfs combined with the rarity of suitably bright natural guide stars makes natural guide star adaptive optics for these targets completely impractical. The GeMS system was chosen for these observations over a traditional single-deformable mirror system, because its wide field of correction allows the selection of off-axis tip-tilt stars over a large field, as well as delivering AO correction over a large 2’ diameter field. This to-date unique capability allows observations of Y dwarfs to address both “narrow field” binarity science, as presented here, and wide-field astrometric science, to be presented in a future publication.
A log listing the observations is given in Table 2. The Y dwarfs W1541, W0713 and W1639 were observed between March 2013 and May 2013 with a total integration time of approximately 1 hour, using 54 exposures of 66s each and random telescope dithering every 6 exposures inside a box size of 1.6″1.6″.
Experience with this observing mode showed that observing overheads were high and therefore, subsequent observations for W0359 and W0535 were carried out by dithering and co-adding every 9 exposures. These observations delivered a typical FWHM of 86 mas for W1541, W0713 and W1639 and a FWHM of 120 mas for W0359 and W0535. The difference in the FWHM for these two groups of objects are caused by the different observing conditions.
Data processing was performed using the Gemini GSAOI pipeline, which operates in the IRAF environment111http://www.gemini.edu/sciops/data–and–results/getting–started#gsaoi. This applies a bad pixel mask, creates and subtracts an averaged dark from all images, applies a flat-field generated using dome flats and generates sky frames using dithered data sets which are then subtracted. Finally dithered images are combined using reference stars to produce a single mosaicked image.
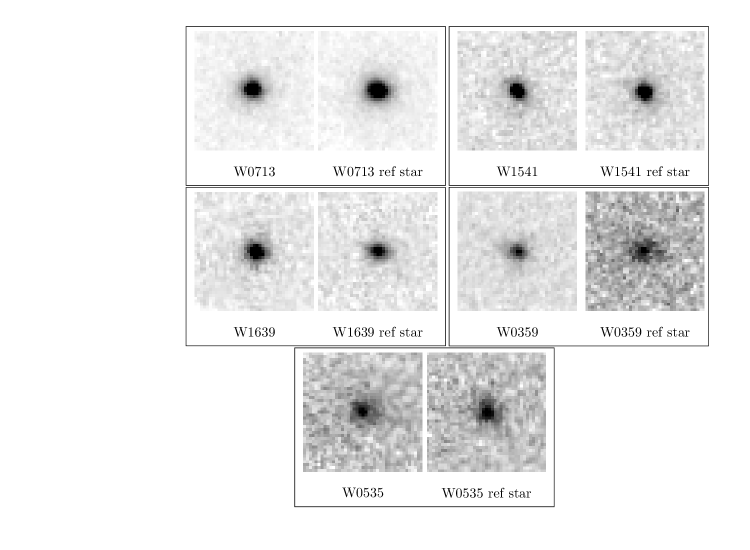
The creation of the final mosaicked image relies on the presence of sufficient reference stars in the field to perform an astrometric registration. For four of our targets (W0535, W0713, W1541, W1639) this analysis could be done for the single detector containing our target. However, for W0359 we needed to process all four detectors together to make a 22 mosaic in order to acquire sufficient reference stars for this step. The FWHM in the final mosaics for each target, determined from Point Spread Function (PSF) analysis described in Section 3, are listed in Table 2. Postage-stamp images zooming on a 0.8”0.8” region around each of our targets along with a nearby unresolved reference star are shown in Figure 1. These show that no obvious binary companions are found in these data.
| Short | UT Date | Exp. | Array1 | Gain | FWHM | FWHM |
|---|---|---|---|---|---|---|
| name | (s) | (e-/ADU) | (pix) | () | ||
| W0359 | 2013 Dec 20 | 360s9 | 3 | 2.41 | 5.51 | 0.11 |
| W0535 | 2014 Dec 04 | 360s9 | 3 | 2.41 | 6.37 | 0.12 |
| 2013 Mar 22 | 66s549 | 3.99 | 0.08 | |||
| W0713 | 2 | 2.01 | ||||
| 2013 Apr 20 | 66s549 | 4.47 | 0.09 | |||
| 2013 Apr 20 | 66s549 | 4.13 | 0.08 | |||
| W1541 | 2 | 2.01 | ||||
| 2013 May 24 | 66s549 | 3.98 | 0.08 | |||
| W1639 | 2013 Apr 21 | 66s549 | 4 | 2.64 | 4.92 | 0.09 |
Note. — 1 –Mosaic detector where each target is located. For W0359 we processed all the GSAOI arrays into a combined mosaic. For the other targets only the individual detector with the target was processed to a final image.
3. Binary Analysis
Figure 1 shows no obvious evidence for close binary companions in our data. To examine this more closely we have performed two analyses to understand the presence (or absence) of binary companions. We concentrate in this study on close binary companions –- the presence (or absence) of wider companions is better probed by multiple epochs of natural-seeing data (since the confirmation of wider companions will critically rely on the observations of common proper motions) and is therefore deferred to a future paper.
3.1. Point Spread Function Analysis
We obtained a Point Spread Function (PSF) model for each image using the DAOPHOT II package (Stetson, 1987) implemented within the Starlink222http://www.star.bris.ac.uk/mbt/daophot/ environment. Unsaturated stars were selected and used to determine an initial model PSF, which was used to fit and subtract all known stars within each image in a first pass processing. Any objects detected in the first-pass PSF-subtracted image (and in particular any objects detected near the PSF stars) are added into the list of known stars and included in a second pass of analysis, so as to iterate toward an uncontaminated single-star PSF. This final PSF was then used to simultaneously fit to all objects in the field, allowing a final subtraction of all known objects from the mosaics. This process did not reveal any companions within 1.0″ of our targets. It also yielded a PSF model for each image that was used in subsequent image injection simulations.
3.2. Companion Detection Simulations
We used to two methods to explore the detectability of potential binary companions of our target stars, and to determine the magnitude-difference and separation-limits implied by our non-discovery of companions.
3.2.1 Artificial Star Injection Simulations
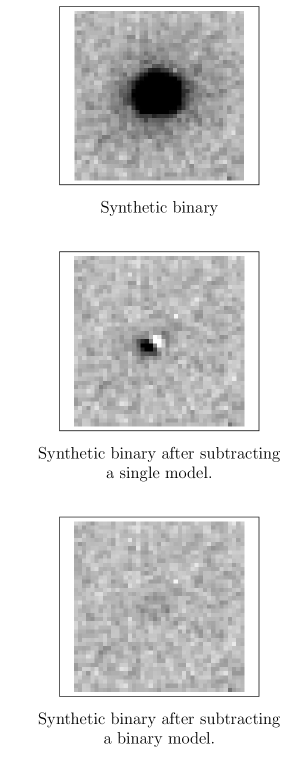
This method injects synthetic binaries with a variety of separations and magnitude differences into the images, then treats these new systems as both single and binary systems and fits PSF models to them.
We first construct a 160x160 pixels sub-image centered on each Y dwarf. Into those sub-images, we inject a pair of synthetic stars at 4 positions 1.13” away from the Y dwarf at position angles of 45°, 135°, 225° and 315° (i.e. pixel positions (40,40), (40,120), (120,40) & (120,120) in the sub-image). This radial separation from the Y dwarf is small enough that the injected systems have the same sky background as the actual Y dwarf, and far enough away that they are uncontaminated by the Y dwarf. (The exception to this is the W1541 data which has a bright star that contaminated the (120,120) position, so it was moved to an offset of (130,100)). The synthetic binaries were injected with radial separations of 1,2,3, .. 10 pixels at positions angles of 0–360° in steps of 45°, and with magnitude differences (mag) corresponding to flux ratios of 1.00–0.05. In total we injected 2280 synthetic binary systems into each Y dwarf image.
After the injection of artificial binaries, we used DAOPHOT to fit both single and binary models (generally following the analysis used by Aberasturi et al., 2014). We made an initial guess for the position of the primary (by detecting a peak identified in the region of the injected stars and fitting to it as a single star) and the secondary (by detecting a peak in the residual image obtained after subtracting the first object detected), and then used DAOPHOT to fit for both a single and a binary model. An illustration of this process is shown in Fig. 2.
The relative statistical significance of the single-star and binary-star fits was assessed using the one-sided F-test
| (1) |
where and are the usually defined for each model fit, and and are the degrees of freedom for a single and binary model fit. The latter were computed using the following expressions:
| (2) |
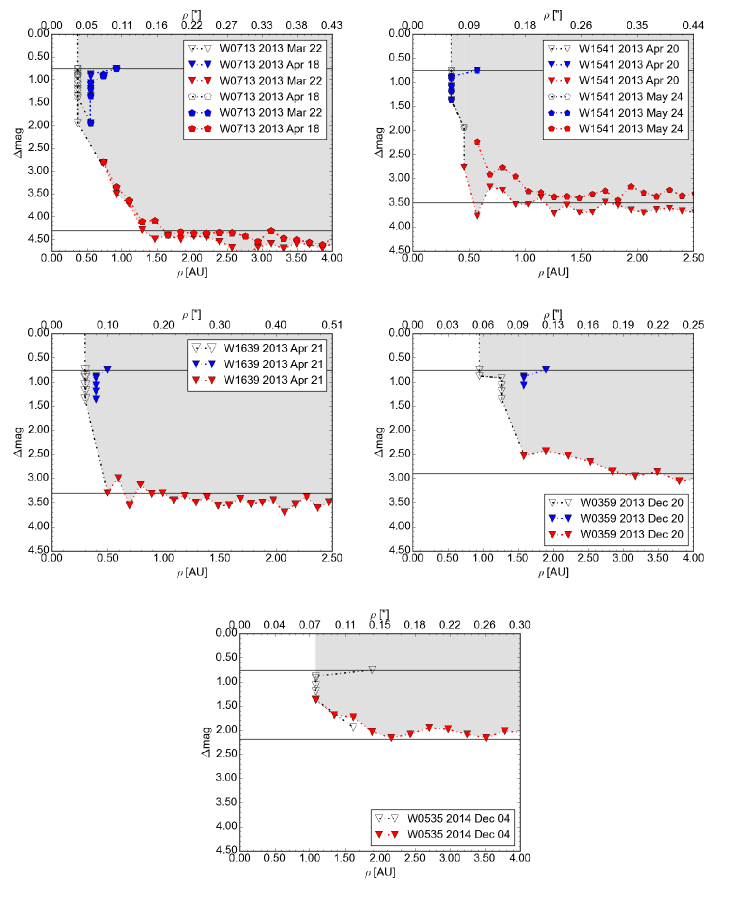
where are the “effective pixels” involved in each fit (essentially a normalised measure of the number of pixels meaningfully involved in each fit - see Aberasturi et al. (2014)) and N is the number of parameters for the model (3 for a single star and 6 for a binary). A significance level () of 0.05 was required to pass this test – i.e we are required to have more than 95% confidence that the binary model is preferred over the single star model. We then use the 2280 synthetic binary systems to determine the separations and magnitude-differences at which 50% and 90% of injected binaries were recovered with 95% confidence. These results are plotted in Fig. 3 for each independent observation, with grey symbols showing the 50% confidence curves and blue symbols showing the 90% confidence curves. A counter-intuitive feature of these curves (also seen by Aberasturi et al., 2014) is that equal-luminosity binaries are slightly harder to detect than slightly non-equal luminosity binaries.
| Short name | S/N | S/N |
|---|---|---|
| (ref star) | ||
| W0713 | 200 | 166.67 |
| W1541 | 58.82 | 76.92 |
| W1639 | 76.92 | 52.63 |
| W0535 | 21.28 | 29.41 |
| W0359 | 37.04 | 18.52 |
Note. — Estimate of the S/N ratios obtained for the Y dwarfs and reference stars displayed in Fig. 1.
3.2.2 Photon-Counting
The artificial star injection simulations above show that (in general) binary companions up to 1.5 magnitudes fainter than the primary can be detected to within one half of an image FWHM. To explore the sensitivity of our data to wider (and fainter) companions, we compute the flux a hypothetical companion would need to have in order to be detected with S/N=3 (or equivalently photometric uncertainty 0.33 mag) at a series of annular radii from the brown dwarf (following the analyses performed by Gelino et al., 2011). To estimate these limits we constructed a set of 50 annuli with 1 pixel of width and radius between 3 & 50 pixels from the brown dwarfs. We computed the standard deviation of the pixel values in each annulus (). Then, we estimated the flux F a companion would have from the standard equations for the magnitude uncertainty,
| (3) |
| (4) |
where C is a constant equal to 1.0857, G is the gain of the detector (see Table 2), is 0.33, the magnitude error for detection limits at 3 over the sky, A is the area of the aperture for the detection of the companion ( pixels ) and Na is the number of pixels in the sky annulus.
| (5) |
The flux F of the hypothetical secondary was then converted to a magnitude () using the standard equation
| (6) |
and the magnitude difference was computed as the difference between and the magnitude of the target (). DAOPHOT is occasionally unable to determine a reliable modal sky value. When this happens we simply discount that and its trial radii. The resulting separation- and magnitude-difference-limits are shown in Fig. 3 as red symbols.
3.3. Results
The regions of magnitude-difference versus separation space ruled out by these observations are shown in Fig. 3, with Table 4 summarizing some key features of these diagrams – namely the largest separation allowed for an unresolved equal-luminosity binary, and the largest magnitude difference ruled out by these data.
As a general rule, the artificial star injection technique is more powerful at small radial separations, where the Y dwarf is imaged with good S/N. In this case an accurate model of the PSF is critical for determining the ability to resolve two closely separated targets. The photon-counting technique readily extends to large separations, and so estimates the faintest companion that our data can rule out. Our artificial injection simulations with a recovery fraction of 90% allow us to strongly conclude that none of these Y dwarfs are equal-mass/equal-luminosity binaries with separations larger than 0.5-1.9 AU. These limits can be slightly extended for a less-confident recovery fraction of 50% to 0.3-1.9 AU. Our best data is for W0713 and it shows no evidence for binarity to limits mag = 4.4 mag at separations beyond 1.7 AU (0.18).
from PSF injecting and photon–counting techniques.
| Short | UT Date | NPSF11footnotemark: | mag22footnotemark: | 33footnotemark: | 44footnotemark: | 55footnotemark: | ||||
|---|---|---|---|---|---|---|---|---|---|---|
| name | () | (AU) | () | (AU) | () | (AU) | ||||
| 2013 Mar 22 | 4.28 | 0.14 | 1.29 | 0.04 | 0.37 | 0.10 | 0.92 | |||
| W0713 | 13 | |||||||||
| 2013 Apr 18 | 4.39 | 0.18 | 1.66 | 0.04 | 0.37 | 0.10 | 0.92 | |||
| 2013 Apr 20 | 3.53 | 0.16 | 0.91 | 0.06 | 0.34 | 0.10 | 0.57 | |||
| W1541 | 10 | |||||||||
| 2013 May 24 | 3.28 | 0.18 | 1.03 | 0.06 | 0.34 | 0.08 | 0.48 | |||
| W1639 | 2013 Apr 21 | 18 | 3.30 | 0.08 | 0.47 | 0.06 | 0.30 | 0.10 | 0.49 | |
| W0359 | 2013 Dec 20 | 6 | 2.84 | 0.18 | 2.84 | 0.06 | 0.95 | 0.12 | 1.90 | |
| W0535 | 2014 Dec 20 | 19 | 2.16 | 0.16 | 2.16 | 0.14 | 1.89 | - | - | |
Note. — 1 – Number of stars used to create the the point-spread function model. 2 – Magnitude difference limits computed by the photon counting method. 3 – Limits in separation between the primary and the secondary at the magnitude difference limit in arcsec and astronomical units respectively computed by the photon counting method. 4 – Limits in separation for an equal-mass/equal-luminosity binary (magnitude difference of 0.75 mag) computed by the PSF injection method (for 50% of objects recovered). 5 – Limits in separation for an equal-mass/equal-luminosity binary (magnitude difference of 0.75 mag) computed by the PSF injection method (for 90% of objects recovered).
3.4. Equal mass/luminosity binaries
3.4.1 WISE 1541, WISE 0713 and WISE 1639
WISE 0713, WISE 1541 and WISE 1639 are the objects for which our GeMS images have the highest quality, and the artificial star injection simulations show, with high levels of confidence (i.e. 90%), that none of these are equal-mass/equal-luminosity binaries with separations larger than 0.5-1.9 AU. Using a weaker confidence limit on binary recovery (50%), we get only a slightly tighter range of limits on separation.
3.4.2 WISE 0535 and WISE 0359
Recently Tinney et al. (2014) have highlighted a handful of Y dwarfs that are over-luminous in JMKO and W2 (4.6 m, Wright et al., 2010) relative to cloud-free models. W0359 and W0535, in particular, were highlighted as being over-luminous by 0.6 and 1.1 mag respectively. If their over-luminosity were due to unresolved multiplicity, they would have to be nearly equal-luminosity/equal-mass binaries or triples.
The Y–dwarfs W0359 and W0535 are the faintest in our sample, and so the most challenging targets for measuring binary limits. From the artificial injection simulations, with a recovery fraction of 90%, we estimated that W0359 is not an equal-luminosity binary with a separation larger than 1.9 AU. For this object, the analysis is made more difficult by the small number of available stars in the field of view for generating a PSF.
For W0535 our data is of sufficiently poor signal-to-noise that our simulations cannot achieve 90% recovery over the separation limits studied. This is simply an outcome of the fact that the artificial star injection technique is not powerful when the signal-to-noise of the object detection is 20 as is the case for W0535. Using the more relaxed 50% recovery limit we estimate less stringent limits for the separation of a possible equal-luminosity binary companion of 1.9 AU for W0535.
If these Y dwarfs are not binaries, the more plausible explanation for their over-luminosity is the presence of clouds. As discussed by Tinney et al. (2014), the fact that some Y dwarfs show over-luminosity while others do not, could indicate different levels of cloud coverage between similar Y dwarfs or time-variable cloud coverage for the same object. Cloud coverage has already been detected on brown dwarfs. Faherty et al. (2014) have reported the presence of water ice clouds in the coolest brown dwarf known (WISE J085510.83-071442.5; Luhman, 2014), while photometric variability due heterogeneous cloud coverage has been reported in some T (Buenzli et al., 2012; Apai et al., 2013; Buenzli et al., 2015) and Y (Cushing et al., 2014a) dwarfs.
3.5. Faint companions
In general, both techniques deliver consistent results where they overlap at separations of 0.1″, with the photon counting technique extending to fainter potential companions at larger radial separations. Our best data on our brightest target (W0713) allow us to conclude that GSAOI–GeMS should able to resolve a brown dwarf companion with a contrast 4.4 mag with respect to W0713 at separations beyond 1.66 AU (0.18) (Fig. 3). For W1541 and W1639 we rule out companions up to 3.5 mag fainter than the known Y dwarf at separations beyond 0.5 AU, while for W0359 and W0535 we rule out companions with a contrast 2.0 mag with respect to the Y dwarfs at separations greater than 2 AU from the Y dwarf.
3.6. Binary fraction and Mean Separation
Observations show a decreasing binary fraction with later primary spectral type (see e.g. Duchêne & Kraus, 2013, and references therein.). A recent study of brown dwarf multiplicity (Aberasturi et al., 2014) infers an upper limit of between 16% and 25% for the binary fraction of brown dwarf companions to primaries of T5 and later. This is in agreement with previous brown dwarf multiplicity studies (Burgasser et al., 2006, 2007).
This trend in the binary fraction could be explained by either a mass dependence in the star formation process, or an observational bias. The latter is supported by the fact that multiplicity has been largely studied from resolved imaging programs, which are limited in resolution. Burgasser et al. (2007) noted that the peak in the binary angular separation distribution was coincident with the resolution limit of Hubble Space Telescope and ground–based adaptive optics facilities, and suggested an undiscovered population of tight binaries (a 1 AU).
There is scarce evidence for tight binary systems with mid–T to late–T dwarf primaries– observed separations typically lie between 2 to 15 AU (Aberasturi et al., 2014). However, recently Dupuy et al. (2015) have extended multiplicity statistics into smaller separations by reporting a tight sub–stellar binary at the T/Y transition with a separation of 0.93 AU.
In our sample of five Y dwarfs, we did not find evidence for companions down to separation limits of 0.3-1.9 AU, which is in agreement with the binary fraction estimates by Aberasturi et al. (2014). However, our sample is not large enough to confirm whether the decreasing binary fraction with later spectral type primaries is a real trend or an observational bias.
In addition, we do not discount the possibility that some of the Y dwarfs of our sample harbor tighter binaries than our data can resolve, as the mean separation of known binaries also drops as a function of primary type. Very low–mass binaries are expected to be more bound as the gravitational potential well of each component drops as a function of the primary type (Close et al., 2003, 2007; Burgasser et al., 2003).
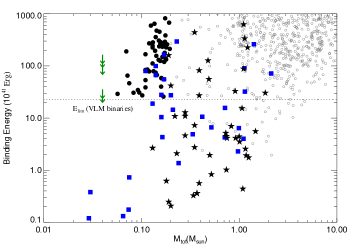
In Fig. 4 we compare the estimated binding energy of our targets (for the assumption that they are unresolved binaries), with known binary systems collected in Faherty et al. (2011) assuming near equal-mass companions of 20 MJup (from Dupuy & Kraus, 2013) for our targets. The objects of our sample fall within the binding energy limitation set by known tight low-mass (Mtot 0.2 M⊙) multiples (the dotted line in the figure).
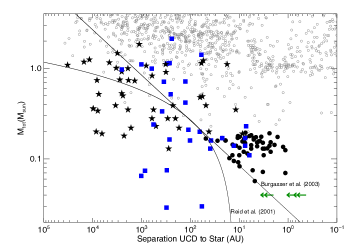
Fig. 5 shows the Mtot versus separation for the same companion systems described in Fig. 4, along with the maximum separations allowed to keep the binary system stable, as suggested by both Reid et al. (2001) and Burgasser et al. (2003). In both cases, these empirical limits were derived from the binary systems known at that time. As has been noted by Dhital et al. (2010) and Faherty et al. (2010), these cutoffs break down for more massive and widely separated systems as well as very young ( 10 Myr) systems. Nonetheless, the trends predicted by (Reid et al., 2001) and (Burgasser et al., 2003) provide a means to extrapolate the properties observed for more massive binary systems, to the lower masses relevant for our Y dwarf observations. This suggests that the upper-limits we observe for binary separation in our five Y dwarfs are not inconsistent (based on binding energy and stability arguments) with the binary separations seen at larger masses.
Finally, although no companions to these Y dwarfs were discovered, we have reached limiting angular separations as small as 0.04. GSAOI–GeMS therefore, is an excellent instrument to expand multiplicity statistics of the coldest brown dwarfs.
4. Summary and Conclusions
We have observed five WISE brown dwarfs with the Gemini GeMS Multi-Conjugate Adaptive Optics System to identify ultra-cool companions and have implemented two methods to compute sensitivities as a function of separation and luminosity. Combining the results computed by two different techniques we conclude:
-
•
We detect no binary companions to the five Y dwarfs observed.
-
•
None of these Y dwarfs are equal-mass/equal-luminosity binaries with separations larger than 0.5-1.9 AU. Our best data are for W1541, where artificial star injection (at a recovery fraction of 90%), shows no evidence of an equal-mass/equal-luminosity binary at separations down to 0.5 AU (0.08).
-
•
GSAOI-GeMS would be able to detect binary companions as much as 4.4 mag fainter than the known Y dwarf at separations beyond 0.08.
Although no binary companions to Y dwarfs were detected, these data probe an interesting range of orbital separations for these nearby Y dwarfs and demonstrated the power of GSAOI-GeMS for this science.
References
- Aberasturi et al. (2014) Aberasturi, M., Burgasser, A. J., Mora, A., et al. 2014, AJ, 148, 129
- Apai et al. (2013) Apai, D., Radigan, J., Buenzli, E., et al. 2013, ApJ, 768, 121
- Bouy et al. (2006) Bouy, H., Moraux, E., Bouvier, J., et al. 2006, ApJ, 637, 1056
- Buenzli et al. (2012) Buenzli, E., Apai, D., Morley, C. V., et al. 2012, ApJ, 760, LL31
- Buenzli et al. (2015) Buenzli, E., Saumon, D., Marley, M. S., et al. 2015, ApJ, 798, 127
- Burgasser et al. (2003) Burgasser, A. J., Kirkpatrick, J. D., Reid, I. N., et al. 2003, ApJ, 586, 512
- Burgasser et al. (2006) Burgasser, A. J., Kirkpatrick, J. D., Cruz, K. L., et al. 2006, ApJS, 166, 585
- Burgasser et al. (2007) Burgasser, A. J., Reid, I. N., Siegler, N., et al. 2007, Protostars and Planets V, 427
- Carrasco et al. (2012) Carrasco, E. R., Edwards, M. L., McGregor, P. J., et al. 2012, Proc. SPIE, 8447, 84470N
- Close et al. (2003) Close, L. M., Siegler, N., Freed, M., & Biller, B. 2003, ApJ, 587, 407
- Close et al. (2007) Close, L. M., Zuckerman, B., Song, I., et al. 2007, ApJ, 660, 1492
- Cushing et al. (2011) Cushing, M. C., Kirkpatrick, J. D., Gelino, C. R., et al. 2011, ApJ, 743, 50
- Cushing et al. (2014) Cushing, M. C., Kirkpatrick, J. D., Gelino, C. R., et al. 2014, AJ, 147, 113
- Cushing et al. (2014a) Cushing, M., Hardegree-Ullman, K., & Trucks, J. 2014, American Astronomical Society Meeting Abstracts 223, 425.08
- Delfosse et al. (2004) Delfosse, X., Beuzit, J.-L., Marchal, L., et al. 2004, Spectroscopically and Spatially Resolving the Components of the Close Binary Stars, 318, 166
- d’Orgeville et al. (2012) d’Orgeville, C., Diggs, S., Fesquet, V., et al. 2012, Proc. SPIE, 8447, 84471Q
- Dhital et al. (2010) Dhital, S., West, A. A., Stassun, K. G., & Bochanski, J. J. 2010, AJ, 139, 2566
- Duchêne & Kraus (2013) Duchêne, G., & Kraus, A. 2013, ARA&A, 51, 269
- Dupuy et al. (2009) Dupuy, T. J., Liu, M. C., & Ireland, M. J. 2009, ApJ, 692, 729
- Dupuy & Kraus (2013) Dupuy, T. J., & Kraus, A. L. 2013, Science, 341, 1492
- Dupuy et al. (2015) Dupuy, T. J., Liu, M. C., & Leggett, S. K. 2015, ApJ, 803, 102
- Duquennoy & Mayor (1991) Duquennoy, A., & Mayor, M. 1991, A&A, 248, 485
- Gelino et al. (2011) Gelino, C. R., Kirkpatrick, J. D., Cushing, M. C., et al. 2011, AJ, 142, 57
- Faherty et al. (2010) Faherty, J. K., Burgasser, A. J., West, A. A., et al. 2010, AJ, 139, 176
- Faherty et al. (2011) Faherty, J. K., Burgasser, A. J., Bochanski, J. J., et al. 2011, AJ, 141, 71
- Faherty et al. (2014) Faherty, J. K., Tinney, C. G., Skemer, A., & Monson, A. J. 2014, ApJ, 793, LL16
- Kirkpatrick et al. (2011) Kirkpatrick, J. D., Cushing, M. C., Gelino, C. R., et al. 2011, ApJS, 197,19
- Kirkpatrick et al. (2012) Kirkpatrick, J. D., Gelino, C. R., Cushing, M C., et al. 2012, ApJ, 753, 156
- Kirkpatrick et al. (2013) Kirkpatrick, J. D., Cushing, M. C., Gelino, C. R., et al. 2013, ApJ, 776, 128
- Koerner et al. (1999) Koerner, D. W., Kirkpatrick, J. D., McElwain, M. W., & Bonaventura, N. R. 1999, ApJ, 526, L25
- Konopacky (2013) Konopacky, Q. M. 2013, Mem. Soc. Astron. Italiana, 84, 1005
- Konopacky et al. (2010) Konopacky, Q. M., Ghez, A. M., Barman, T. S., et al. 2010, ApJ, 711, 1087
- Leggett et al. (2015) Leggett, S. K., Morley, C. V., Marley, M. S., & Saumon, D. 2015,ApJ, 799, 37
- Liu et al. (2011) Liu, M. C., Delorme, P., Dupuy, T. J., et al. 2011, ApJ, 740, 108
- Liu et al. (2012) Liu, M. C., Dupuy, T. J., Bowler, B. P., Leggett, S. K., & Best, W. M. J. 2012, ApJ, 758, 57
- Luhman et al. (2011) Luhman, K. L., Burgasser, A. J., & Bochanski, J. J. 2011, ApJ, 730, L9
- Luhman (2014) Luhman, K. L. 2014, ApJ, 781, 4
- Martín et al. (1998) Martín, E. L., Basri, G., Brandner, W., et al. 1998, ApJ, 509, L113
- McGregor et al. (2004) McGregor, P., Hart, J., Stevanovic, D., et al. 2004, Proc. SPIE, 5492, 1033
- Morley et al. (2012) Morley, C. V., Fortney, J. J., Marley, M. S., et al. 2012, ApJ, 756, 172
- Neuhäuser et al. (2002) Neuhäuser, R., Brandner, W., Alves, J., Joergens, V., & Comerón, F. 2002, A&A, 384, 999
- Pinfield et al. (2014) Pinfield, D. J., Gromadzki, M., Leggett, S. K., et al. 2014, MNRAS, 444, 1931
- Reid & Gizis (1997) Reid, I. N., & Gizis, J. E. 1997, AJ, 113, 2246
- Reid et al. (2001) Reid, I. N., Gizis, J. E., Kirkpatrick, J. D., & Koerner, D. W. 2001, AJ, 121, 489
- Schneider et al. (2015) Schneider, A. C., Cushing, M. C., Kirkpatrick, J. D., et al. 2015, ApJ, 804, 92
- Reid et al. (2008) Reid, I. N., Cruz, K. L., Burgasser, A. J., & Liu, M. C. 2008, AJ, 135, 580
- Stetson (1987) Stetson, P. B. 1987, PASP, 99, 191
- Tinney et al. (2012) Tinney, C. G., Faherty, J. K., Kirkpatrick, J. D., et al. 2012, ApJ, 759, 60
- Tinney et al. (2014) Tinney, C. G., Faherty, J. K., Kirkpatrick, J. D., et al. 2014, ApJ, 796, 39
- Todorov et al. (2014) Todorov, K. O., Luhman, K. L., Konopacky, Q. M., et al. 2014, ApJ, 788, 40
- Wright et al. (2010) Wright, E. L., Eisenhardt, P. R. M., Mainzer, A. K., et al. 2010, AJ, 140, 1868