Microwave Type III Pair Bursts in Solar Flares
Abstract
Solar microwave type III pair burst is composed of normal and reverse-sloped (RS) burst branches with oppositely fast frequency drifts. It is the most sensitive signature of the primary energy release and electron accelerations in flares. This work reported 11 microwave type III pair events in 9 flares observed by radio spectrometers in China and the Czech Republic at frequency of 0.80 - 7.60 GHz during 1994 - 2014. These type III pairs occurred in flare impulsive and postflare phases with separate frequency in range of 1.08 - 3.42 GHz and frequency gap 10 - 1700 MHz. The frequency drift increases with the separate frequency (), the lifetime of each burst is anti-correlated to , while the frequency gap is independent to . In most events, the normal branches are drifting obviously faster than the RS branches. The type III pairs occurring in flare impulsive phase have lower separate frequency, longer lifetime, wider frequency gap, and slower frequency drift than that occurring in postflare phase. And the latter always has strong circular polarization. Further analysis indicates that near the flare energy-release sites the plasma density is about cm-3 and temperature higher than K . These results provide new constraints to the acceleration mechanism in solar flares.
1 Introduction
One of the most important task of solar physics is to understand the origin of solar energetic particles which concerns several key problems: where is the acceleration site? what factors do dominate the acceleration process? what signals do these particles produce? how does the energy release? how do these particles propagate and interact with the ambient plasmas? Solar radio type III burst is a kind of transient event of strong emission with fast negative or positive frequency drift. The observed type III bursts usually occur at decimeter, meter and longer wavelengths with negative frequency drifts (e.g., Lin & Hudson 1971, Kane 1981, Huang et al. 2011) which are called normal type III bursts. They are interpreted as caused by energetic electrons streaming through the background plasma at speed of about 0.1 - 0.9 ( is the light speed) along the open coronal magnetic field. Therefore, they are believed to be the excellent tracer of energetic electron beams in the corona (e.g., Lin & Hudson 1971, Lin et al. 1981, Christe et al. 2008, Chen et al. 2013, Reid & Ratcliffe 2014, etc.).
Sometimes, radio type III bursts have positive frequency drifts at decimeter or shorter wavelengths, called microwave type III bursts in previous publications (Stahli & Benz 1987, Sawant et al. 1994, Mészárosová et al. 2008). We call them uniformly reverse-slope (RS) type III bursts. They are explained as caused by energetic electron beams propagating from the accelerated site downward to denser plasma by plasma emission(PE) or electron cyclotron maser emission (ECME, Aschwanden & Benz 1997, Bastian et al. 1998). Since the RS type III bursts are mainly occurring in decimeter and centimeter wavelengths which produced very closed to the primary energy release site of solar flares, RS type III bursts may reveal the intrinsic properties beneath the acceleration site (Altyntsev et al. 2007).
Occasionally, radio type III pairs were also observed (Huang et al. 1998, Ning et al. 2000, Ma et al., 2008, Karlický 2014). A type III pair is composed of two type III burst branches beginning almost at the same time, one is a normal type III burst with negative frequency drift and the other is a RS type III burst with positive frequency drift. The normal branch can track the upgoing energetic electron beam, and the RS branch can track the downward electron beam (Robinson & Benz 2000). The type III pairs can be regarded as a sensitive tool to diagnose the physical conditions around the flare energy-release site where magnetic reconnection and particle acceleration takes place. For example, the separate frequency between the normal and RS branches may pinpoint the acceleration site and demarcate the electron density. The frequency gap, frequency drift, and burst lifetime may reveal the intrinsic nature of the primary energy release processes in solar flares (Aschwanden & Benz 1997, Sakai et al. 2005, Altyntsev et al. 2007, Li et al. 2011).
Generally, an ideal type III pair is just composed of a normal branch and a corresponding RS branch simultaneously (Aschwanden et al. 1993, Huang et al. 1998, Ning et al. 2000). However, the actual conditions are always complex, including irregular magnetic structures, repeatedly electron acceleration, free-free absorption, and rapid changes in the source regions (Benz et al. 1992, Meshalkina et al. 2004). Practically and generally, observations always show a group of normal type III bursts at low frequency band and a group of RS type III bursts at higher frequency band occur in same time interval (Aschwanden et al. 1997, Ma et al. 2008). It is difficult to clarify their one-to-one corresponding relationships. We call this complex assembly a type III pair train. It may be associated to a group of upward electron beams and a group of downward beams producing repeatedly and propagating in the background plasmas.
Aschwanden et al. (1993) reported two radio type III pair events with separate frequencies between the normal and RS branches at 620 and 750 MHz, respectively. Then they collected several type III pairs and found that separate frequency ranges in 220 - 910 MHz with average of about 500 MHz (Aschwanden & Benz 1997). They proposed that acceleration takes place in a low-density region above a denser soft X-ray flare loop. Later, Huang et al. (1998) reported a type III pair with separate frequency up to 1.71 GHz. Ma et al. (2008) found that separate frequencies scattered in a much wider range and pointed out that in different flares the acceleration regions may locate at a large range of heights. Are other properties of acceleration region different from flare to flares?
This work presents a systematic investigation of solar microwave type III pairs including events collected in the previous literature and recently observed in two radio spectrometers located in China and the Czech Republic. Section 2 shows the main observed properties of type III pairs. Theoretical discussions are in Section 3. Finally, conclusions are summarized in Section 4.
2 Observations
2.1 Observation Data and Parameters
In this work, the microwave type III pairs are observed by the Chinese Solar Broadband Radio Spectrometers at Huairou (SBRS) and Ondřejov radiospectrograph in the Czech Republic (ORSC).
SBRS is a group of advanced solar radio broadband spectrometers located in Huairou, China (Fu et al. 1995, 2004, Yan et al. 2002), including three parts: 1.10 - 2.06 GHz (cadence ms, frequency resolution MHz), 2.60 - 3.80 GHz ( ms, MHz), and 5.20 - 7.60 GHz ( ms, MHz). It receives total flux of solar radio emission with dual circular polarization (left- and right-handed circular polarization, LCP and RCP, respectively).
ORSC locates at Ondřejov, the Czech Republic. It receives solar radio total flux at frequencies of 0.80 - 5.00 GHz. ms. MHz at frequency of 0.80 - 2.00 GHz and MHz at frequency of 2.00 - 5.00 GHz (Jiřička et al. 1993).
From observations of SBRS and ORSC at frequencies of 0.80 - 7.60 GHz, we identified totally 11 microwave type III pair events in 9 flares (Table 1). Some of them are mentioned in previous literature (Huang et al. 1998, Ning et al. 2000, Ma et al. 2008, Karlický 2014). Here, we do not consider a few events that are mentioned by Ma et al. (2008), because they are not clearly visible on the observed radio spectrograms.
It is necessary to define parameters describing type III pairs. They are including:
(1) Flare start time (), start time of the host flare recorded at soft X-ray emission (SXR) observed by GOES.
(2) Type III time (), start time of the radio type III pair or type III pair train.
(3) Burst lifetime (), time interval between the start and end of an individual type III burst.
(4) Frequency bandwidth (), frequency range between the start and end of each type III burst with emission intensity exceeding 3 above the background emission. is mean square deviation of the background emission.
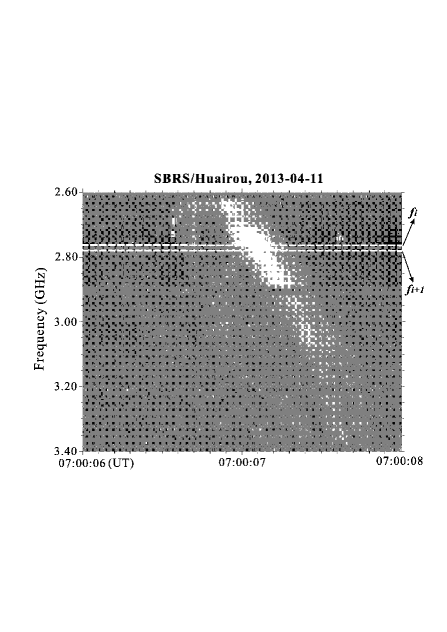
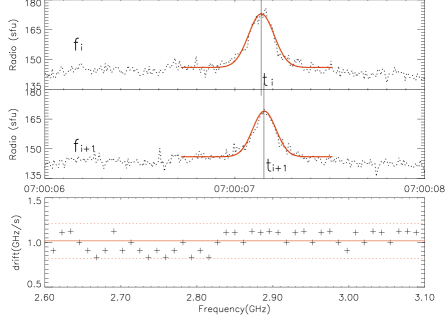
(5) Frequency drift (), defined as the slope of type III burst on the spectrogram. It can be derived by using cross-correlation of the emission profiles at each two adjacent frequency channels. Here we make least squared Gaussian fitting curve at each frequency channel to avoid noise fluctuations of the original observational data. For each two adjacent frequency channels ( and ), the frequency drift is: . and are times of maxima at Gaussian fitting curves at the corresponding frequencies. For each type III burst we obtain average frequency drift and its standard deviation (). can be regarded as error bar. Fig. 1 shows an example of a type III burst. Here, GHz s-1, and GHz s-1. The result is expressed in GHz s-1. Using this method, frequency drifts can be measured in the normal and RS branches of type III pairs, respectively.
The relative frequency drift () is . is central frequency of the type III burst.
(6) Separate frequency (). For simple type III pair, it can be obtained by reverse extending the normal and RS branches to a crossing point where the frequency is . Similar definition is in Tan (2013) to describe small-scale microwave bursts. For type III pair train, as there is no clear one-by-one relationship between normal branches and the RS branches, can be determined from the frequency at the watershed line (or the middle line) between the normal and RS type III branches. Usually, is a variable of time. We define as temporal change of separate frequency.
(7) Frequency gap (), the difference of starting frequencies between the normal and RS branches. As for type III pair trains, is the averaged bandwidth between starting frequencies of the normal and RS type III groups.
We also try to attribute a type III pair event with a certain solar flare. A type III pair is related to a flare when it takes place in the flaring duration. The flaring duration begins at the start of a GOES SXR flare and ends when there is no obvious decrease on the GOES SXR profile. It is possible for some events, such as the X3.4 flare on 2006 December 13, that lasts for more than 2 hours (Tan et al. 2010).
In following sections, several typical type III pair events are introduced at first, and then statistical results are presented.
2.2 Typical Type III Pair Events
2.2.1 Type III Pairs in the impulsive phase of a Hard X-ray Burst on 2011 September 26
Fig. 2 presents a type III pair train at frequency of 0.80 - 2.00 GHz observed by ORSC during 06:21:30 - 06:22:00 UT on 2011 September 26. Here, we marked 5 identified individual RS bursts and 3 identified individual normal bursts. The normal branches start from about 1.30 GHz and extends below 0.80 GHz with average frequency drift about -5.50 GHz s-1 ( s-1), while the RS branches start from about 1.50 GHz and extends beyond 2.00 GHz with average frequency drift of 0.5 GHz s-1 ( s-1). The middle line between the normal and RS branches located at about 1.42 - 1.47 GHz. That is to say, varied from 1.42 GHz to 1.47 GHz with an average of 1.44 GHz. is about -4.2 MHz s-1. The frequency gap is about 200 MHz. The burst lifetime of each individual type III burst ranges from 0.14 s to 1.10 s with average about 0.50 s. The whole type III pair train lasts for about 22 s (Fig. 2).
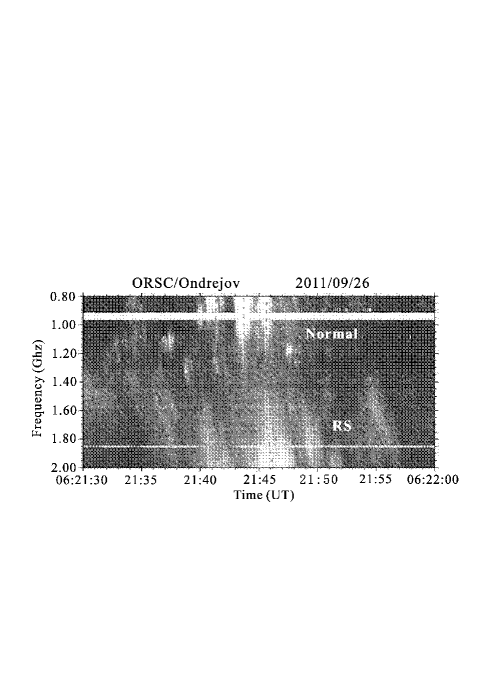
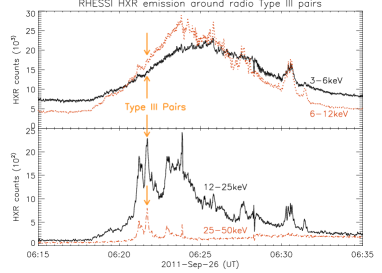
At the same time RHESSI has perfect hard X-ray (HXR) observations. The right panel of Fig. 2 presents HXR profiles at energies of 3 - 6 keV, 6 - 12 keV, 12 - 25 keV and 25 - 50 keV, which shows that there is an obviously strong burst during 06:18 - 06:31 UT just around the above radio type III pair train. The microwave type III pair train took place just at the flare impulsive phase (yellow arrow in right panel of Fig. 2). The type III pair train occur just when a strong non-thermal HXR spike occurs at energy of 12 - 25 keV and 25 - 50 keV. There is a strong corresponding relation between the type III pair train and the non-thermal HXR burst.
2.2.2 Type III Pairs with Super Wide Frequency Gaps in a Flare on 2014 April 04
Fig. 3 presents a type III pair train observed at frequency of 0.80 - 5.00 GHz in OSRC during 13:48:17 - 13:48:21 UT on 2014 April 04. The left-upper panel shows the normal branches start at about 1.60 GHz and extend to below 0.80 GHz with average frequency drifts of -2.8 GHz s-1 (s-1). Almost at the same time, the RS branch starts at about 3.40 GHz and extends to near 4.9 GHz with average frequency drift of 3.6 GHz s-1 (s-1). The lifetime is in a range of 0.3 - 0.7 s with average of about 0.5 s. The whole type III pair train lasts for about 3 s.
The right panel of Fig. 3 presents profiles of GOES SXR emission at 1 - 8 Å and the derived temperature in the related C8.3 flare. Here, the plasma temperature is derived from the ratio of GOES SXR emission at wavelengths of 1 - 8Å and 0.5 - 4Å(Thomas et al. 1985). The flare starts at 13:34 UT, peaks at 13:48 UT and ends at 13:56 UT (located at N14E26 in active region NOAA12027). The type III pairs occur at 13:43 UT, i.e., 9 min after the flare start and 5 min before the flare maximum. This means that the type III pairs take place in the flare impulsive phase.
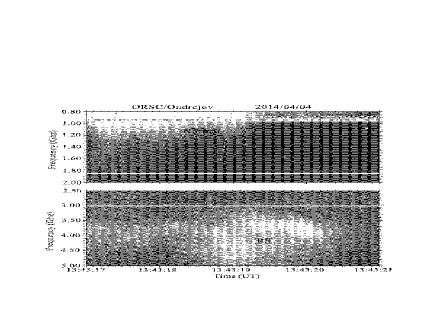

The most interesting of the above type III pair train is its super wide frequency gap. Fig. 3 indicates that the frequency gap starts from about 1.60 GHz, ends at about 3.30 GHz, and the gap is about 1.70 GHz, much wider than the other events reported in the previous publications (Aschwanden et al. 1997, Ma et al. 2008). We attribute this event to a type III pair event just because the normal and RS branches took place almost simultaneously in a short period (about 4 s) at the early impulsive phase of the C8.3 flare. On the other hand, we have scrutinized the multi-wavelength EUV images of AIA/SDO and found that there was no clear evidence to show any bursts occurring in different loops in above duration which ruled out the possibility that the above normal and RS type III bursts might generate in different acceleration sites from different coronal loops.
The temperature profile shows the above type III pairs occurred just at the time of maximum temperature which implies that the maximum temperature may play an important role in the formation of the super wide frequency gap.
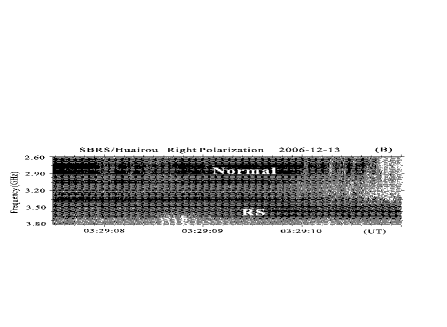
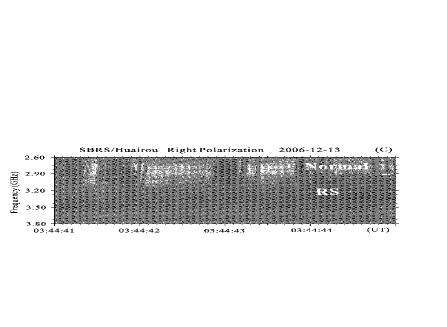
2.2.3 Several Type III Pair Events in Postflare Phase on 2006 December 13
Sometimes, microwave type III pairs occurred in the postflare phase. Fig. 4 presents three microwave type III pair trains at frequency of 2.60 - 3.80 GHz in the postflare phase of a long-duration powerful X3.4 flare on 2006 December 13. All of them are strongly right-handed circular polarization overlapping on a long-duration broadband type IV continuum. The flare starts at 02:14 UT, peaks at 02:40 UT and ends at 02:57 UT at SXR emission. The microwave burst lasts to even after 04:45 UT (see right-bottom panel of Fig. 4). In fact, the flare active region NOAA 10930 is an isolated one on solar disk accompanying microwave bursts with many kinds of fine structures, such as quasi-periodic pulsations, spikes, and type III bursts, etc. (Tan et al. 2007, 2010).

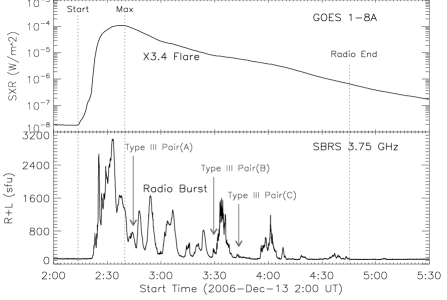
Panel (A) of Fig. 4 shows a type III pair train occurring at 02:45 UT, near the flare maximum. The normal branches start from 2.90 GHz and extend to below 2.60 GHz with an extremely fast frequency drift of -14.50.6 GHz s-1. The burst lifetime is in a range of 140 - 180 ms with average of about 160 ms. The RS branches start from 2.95 - 2.92 GHz and extend to 3.3 - 3.6 GHz with average frequency drift of about 8.60.8 GHz s-1, the burst lifetime is 0.1 - 0.3 s with average of about 0.2 s. The whole type III pair train lasts for about 3 s. The separate frequency decreases slowly from 2.93 GHz to 2.91 GHz, -5 MHz s-1, and the frequency gap is about 50 MHz.
Panel (B) shows another type III pair train occurring around 03:29 UT, about 49 min after the flare maximum. The normal branches start at about 3.30 - 3.40 GHz and extend to below 2.60 GHz with negative frequency drift of about -13.10.80 GHz s-1. The burst lifetime is in a range of 60 - 120 ms with average of about 100 ms. The RS branches start at about 3.50 - 3.60 GHz and extend beyond 3.80 GHz with 1.50.16 s-1, the burst lifetime is 40 - 60 ms with average of about 50 ms. This train lasts for about 3.5 s. The separate frequency increases slowly from 3.40 GHz to 3.44 GHz, 10 MHz s-1, and the frequency gap is about 260 MHz.
Panel (C) shows a type III pair train occurring at about 03:45 UT, far from the flare maximum and still in the postflare decay phase. Its separate frequency is about 2.90 GHz and with a very small frequency gap of about 10 MHz. The burst lifetime of the normal branches is 50 - 80 ms (averaged 70 ms). The event lasts for about 4 s. The relative frequency drifts of the normal and RS branches are -3.80.44 s-1 and 3.20.26 s-1, respectively. The separate frequency is nearly a constant of 2.90 GHz during the type III pairs. This train behaves as absorption structure which is analyzed by Chen & Yan (2008).
The right-bottom panel of Fig. 4 presents the comparison between SXR intensities and the microwave emission at frequency of 3.75 GHz. Each train took place just at a short microwave burst showed as arrows. Therefore, we proposed that the above three type III pair trains were related to the X3.4 flare. At the same time, we also found that most RS branches emission are relatively weaker than the corresponding normal branches in the above three type III pair trains.
2.3 Statistic Properties
Table 1 and Table 2 list 11 microwave type III pair events. Among them, three events (19940105, 20110215, and 20140404) composed of single normal branch and single RS branch. The other 8 events are type III pair trains composing of normal groups and RS burst groups. We make a statistical analysis in this section.
Browsing active regions of the host flares related to the type III pairs we find that all the flares tend to locate near the center of solar disk. For example, the X3.4 flare associated with several type III pair events on 2006 December 13 is located in S06W21. All other host flare active regions are located from east 35∘ to west 25∘ and from north 30∘ to south 21∘ on the solar disk. The host flares include from extremely powerful (X-class) to rather weak ones (C-class) and from long-duration flares (e.g., X3.4 flare on 2006-12-13 lasts for more than 2 hours) to very short duration flares (e.g., C8.3 flare in 2014-08-01 lasts for only 10 min).
| Event | 1994-01-05 | 1998-04-15 | 2012-02-12 | 2011-09-26 | 2012-07-02 | 2014-04-04 | 2014-08-01 |
|---|---|---|---|---|---|---|---|
| Flare Class | M1.0(a) | C8(a) | M8.3(b) | HXR burst(b) | M5.6(b) | C8.3(b) | M2.0(b) |
| Location | — | N30W25 | N21E07 | N12E22 | S17E06 | N14E26 | S09E35 |
| (UT) | 06:45 | 07:37 | 11:19 | 06:18 | 10:43 | 13:34 | 14:43 |
| (UT) | 07:02 | 07:47 | 11:27 | 06:25 | 10:52 | 13:48 | 14:49 |
| (UT) | 06:52 | 07:42 | 11:24 | 06:21 | 10:50 | 13:43 | 14:47 |
| (s) | 1.60 | 0.80 | 0.15 | 0.50 | 0.50 | 0.50 | 1.10 |
| Pol | weak | weak | (strong) | (weak) | (weak) | (weak) | (weak) |
| (GHz) | 1.25 | 1.62 | 0.99 | 1.10 | 2.35 | 1.20 | 1.03 |
| (MHz) | 500 | 120 | 180 | 600 | 700 | 800 | 350 |
| (GHz/s) | -0.70.2 | -0.80.2 | -0.60.1 | -5.50.49 | -1.60.3 | -2.80.8 | -0.40.2 |
| () | -0.60.16 | -0.50.12 | -0.60.1 | -5.00.45 | -0.70.13 | -2.30.67 | -0.40.2 |
| (GHz) | 1.85 | 1.84 | 1.15 | 1.75 | 4.15 | 3.85 | 1.85 |
| (MHz) | 300 | 120 | 100 | 500 | 1500 | 700 | 300 |
| (GHz/s) | 0.50.2 | 0.60.2 | 0.50.1 | 0.50.11 | 2.80.4 | 3.61.0 | 0.60.2 |
| () | 0.30.11 | 0.30.16 | 0.40.08 | 0.30.06 | 0.70.1 | 0.90.26 | 0.30.10 |
| (GHz) | 1.71 | 1.73 | 1.08 | 1.44 | 3.00 | 2.40 | 1.45 |
| (MHz/s) | — | 3.0 | -3.5 | 4.2 | -9.0 | — | 0 |
| (MHz) | 140 | 10 | 35 | 200 | 1000 | 1700 | 500 |
| ( K) | 1.08 | 1.12 | 1.51 | 1.60 | 1.79 | 1.26 | 1.27 |
| (m-3) | 0.90 | 0.92 | 1.4 | 0.64 | 2.8 | 1.8 | 0.65 |
Note. — : observed by SBRS, : observed by ORSC, : flare start time, : the time of flare maximum, : type III time, : burst lifetime, Pol: circular polarization, and : central frequency, and : frequency bandwidth, and : frequency drifts, and : relative frequency drifts, : separate frequency, : temporal change of separate frequency, : frequency gap, : plasma temperature, : plasma density.
| Event | 2006-12-13A | 2006-12-13B | 2006-12-13C | 2011-02-15 |
|---|---|---|---|---|
| Flare Class | X3.4(a) | X3.4(a) | X3.4(a) | X2.2(a) |
| Location | S06W21 | S06W21 | S06W21 | S20W10 |
| (UT) | 02:14 | 02:14 | 02:14 | 01:46 |
| (UT) | 02:40 | 02:40 | 02:40 | 01:56 |
| (UT) | 02:45 | 03:29 | 03:45 | 02:03 |
| (s) | 0.16 | 0.10 | 0.07 | 0.25 |
| Pol | strong | strong | strong | strong |
| (GHz) | 2.75 | 2.98 | 2.75 | 2.80 |
| (MHz) | 300 | 750 | 300 | 200 |
| (GHz/s) | -14.50.6 | -13.10.8 | -10.51.2 | -0.90.2 |
| () | -5.30.22 | -4.40.29 | -3.80.44 | -0.30.07 |
| (GHz) | 3.28 | 3.68 | 3.00 | 3.00 |
| (MHz) | 650 | 250 | 200 | 100 |
| (GHz/s) | 8.60.8 | 5.60.6 | 9.70.8 | 1.50.4 |
| () | 2.60.24 | 1.50.16 | 3.20.27 | 0.50.14 |
| (GHz) | 2.92 | 3.42 | 2.90 | 2.93 |
| (MHz/s) | -5.0 | 10.0 | 0 | — |
| (MHz) | 50 | 260 | 10 | 30 |
| (K) | 1.85 | 1.45 | 1.38 | 1.68 |
| (m-3) | 10.5 | 14.4 | 10.3 | 10.6 |
Note. — same as Table 1
The most important parameter of type III pairs is the separate frequency which is related to the height and plasma density of the acceleration region. However, it is different from flare to flares because of different magnetic field conditions, energy release mechanism, and particle acceleration processes. These processes are possibly related to the burst lifetime, frequency drift, and frequency gap. Therefore, the correlations between the separate frequency and the other parameters may reveal some regular variations. Fig. 5 presents these correlations where dotted lines are created by least-squared linear fitting. The correlate coefficients are marked beside the fitting lines. From the analysis, we found following regular variations:
(1) All microwave type III pairs occurred in impulsive and postflare phase after the flare onset. Aschwanden & Benz (1995) proposed that the particle acceleration might occur from the preflare phase, and therefore the type III pairs can be observed in this phase. However, our work shows that no type III pair occurred in preflare phase, but some microwave type III pairs appeared in the postflare phase.
(2) The parameters of type III pairs distribute in a large range. The lifetime is 0.07 - 1.60 s, separate frequency is 1.08 - 3.42 GHz which is much higher and wider than the previous reported results (Aschwanden et al. 1997, Ning et al. 2000, etc.), and frequency gap is 10 MHz - 1.70 GHz, frequency drift is 0.4 - 14.5 GHz s-1 and the corresponding relative frequency drift is 0.3 - 5.3 s-1.
(3) The peculiar property is that normal branches drift faster than the RS branches in most type III pairs. The average relative frequency drift is -1.78 s-1 (faster) for normal branches and 1.04 s-1 (slower) for RS branches. Only two among the 11 events have faster drifting RS branches than the normal ones.
(4) Although the separate frequency distributes in a large rage, its temporal variation is very slow in each type III pair train. is in a small range from -9.0 MHz s-1 to 10 MHz s-1. Sometimes it is even close to zero ( closes to a constant, e.g., the last event in the X3.4 flare on 2006 Dec 13).
(5) The burst lifetime is anti-correlated obviously to the separate frequency at confidence level (panel 1).
(6) Frequency drifts increase with the separate frequencies. The frequency drift of normal branches is positively related to separate frequency at confidence level (panel 2) while RS branches also have a similar correlation at a lower confidence level (panel 3).
(7) Frequency gap is independent to the separate frequency (panel 4).
(8) The type III pair events occurring in flare impulsive phase are different obviously than those occurring in the postflare phase. Type III pair events in flare impulsive phase (Table 1) have separate frequencies at 1.08 - 3.00 GHz (average 1.83 GHz), burst lifetime 0.15 - 1.60 s (average 0.81 s), large frequency gaps 10 - 1700 MHz (average 512 MHz), and slow relative frequency drifts (average 0.83 s-1 for normal and 0.51 s-1 for RS branches, respectively). All type III pairs with super wide frequency gaps ( MHz) are occurring in the flare impulsive phase and very close to the flare maximum. Fig. 3 shows that the type III pair with super wide frequency gap occurs near the flare maximum temperature. The other type III pairs with frequency gap of 500 MHz also occurred very close to the maximum temperature. This fact implies that the state of temperature may play important role in the formation of type III pairs. As a comparison, type III pairs in postflare phases (Table 2) are related to some powerful flares (X-class). They have higher separate frequencies at 2.90 - 3.42 GHz (average 3.04 GHz), smaller frequency gaps 10 - 260 MHz (average 87.5 MHz), very short lifetime 0.07 - 0.25 s (average 0.15 s), and fast relative frequency drifts (average 3.45 s-1 for normal branches and 1.95 s-1 for RS branches, respectively). All the four events have strong circular polarization.

Among the 11 events, there are observations of polarization in 6 event obtained by SBRS, while the other 5 OSRC-observed events have no observations of polarization. Here we use a similarity of the OSRC-observed events and SBRS-observed events to deduce their polarizations. Because the observed type III pairs here with known weak polarization have long lifetimes ( 0.50 s), while the type III pairs with known strong polarization have short lifetimes ( 0.3 s). When 0.5 s we suppose its polarization is strong, and when 0.5 s its polarization is assumed to be weak. Table 1 lists the status of polarization in each type III pair event. We find that the type III pairs in postflare phase are strong circular polarizations. Among the 7 type III pair events in impulsive phase, only one event has strong polarization (20120212).
However, as our statistical sample only contains 11 events, the above results are rather approximative. They are scattering in a wide range. Therefore, the results mentioned here just provide a preliminary sketchy statistical regularities.
3 Theoretical Discussion
Generally, it is believed that microwave type III pairs are signatures of bi-directional energetic electron beams which may pinpoint acceleration sites in solar flares. The magnetic reconnection may take place in a cusp configuration above and very close to the top of flaring loop similarly as the Masuda-like flare (Masuda et al. 1994, etc.), or in the current sheet above and beyond flare loops triggered by the tearing-mode instability (Kliem et al. 2000, etc). Electrons are accelerated in the reconnection site, propagate upward or downward, and produce normal or RS type III bursts. Therefore, the observations of microwave type III pairs may provide the most fundamental information of the flare energy-release region where the magnetic reconnection, particle acceleration, and the primary energy release occur.
The short lifetimes and very high brightness temperatures of microwave type III bursts indicate that the emission should be coherent processes. The first possible mechanism is electron cyclotron maser emission (ECM, Melrose & Dulk 1982, Tang et al. 2012) which requires a strong background magnetic field: . is electron gyro-frequency and is plasma frequency. As the type III pairs here occurred at frequency of 0.9 - 4.5 GHz, which requires magnetic fields G, generally too strong to occur in the flare energy-release site. The second possible mechanism is plasma emission (PE, Zheleznyakov & Zlotnik 1975) which is generated from the coupling of two excited plasma waves at frequency of 2 (second harmonic PE), or the coupling of an excited plasma wave and a low-frequency electrostatic wave at frequency of about (fundamental PE). As PE has no strong magnetic field constraints, it is much easy to be the favorite mechanism of microwave type III bursts.
In PE mechanism, the emission frequency can be expressed,
| (1) |
is the harmonic number, is the fundamental PE while is the second harmonic PE. Generally, the fundamental PE has strong circular polarization, while the second harmonic PE always has relatively weak circular polarization. Because the separate frequency () of the microwave type III pairs is possibly related to the plasma emission near the acceleration site, here the plasma density can be estimated from Equation (1):
| (2) |
The results are listed in Table 1 showing densities in range of (0.64 - 2.8) m-3 in impulsive phase and (1.03 - 1.44) m-3 in the postflare phase, respectively. These densities are about one order of magnitude higher than that deduced by Aschwanden & Benz (1997). This fact indicates that the acceleration possibly takes place in the lower corona and upper chromosphere.
The plasma emission is generated when electron beams fly off the acceleration site and propagate upward or downward in the ambient plasma. However, because of Coulomb collisions between the electron beam and ambient plasma, an electron beam with velocity of producing a microwave burst should have lifetime (Benz et al. 1992),
| (3) |
Here, the unit of is m s-1. Using Equation (2) and (3) we may explain why the burst lifetime is anti-correlated to the separate frequency of thee type III pair events.
The plasma temperature can be derived from the ratio of SXR intensity at the two energy band observed by GOES after subtracting the background from Solar Software (SSW, Thomas et al. 1985). The right panel of Fig. 3 shows the temporal relation between the type III pairs and the temperature in the flare energy-release site. Table 1 lists the temperature in each microwave type III pair event, which is in a range of (1.06 – 1.85) K, much hotter than the general coronal plasma (at the magnitude of million K). However, it is necessary to note that the above temperature is only related to the hot flaring loops which is possible different from the real source region of type III pair bursts. We adopt it just as an approximation to the source regions of type III pairs.
The frequency drift of microwave type III bursts can be derived from Equation (1):
| (4) |
And the relative frequency drift is,
| (5) |
is the plasma density scale length. or means the density increasing or decreasing along the beam propagating direction (). is the scale time of plasma density variation. or means the density increasing or decreasing with respect to time. is the velocity of the electron beam.
Equation (4) and (5) indicate that frequency drift is composed of two parts. The first part is related to the temporal change of plasma density () around the flare energy-release site due to plasma flows (such as chromospheric evaporation, reconnecting flows, and or MHD oscillations). The second part is related to the plasma density gradient. When the electron beams propagate in the background plasma it will trigger the Langmuir waves and produce plasma emission in different frequencies at different locations.
Altyntsev et al. (2007) and Meshalkina et al. (2012) applied the one-dimensional scan observation at two different frequency channels, and estimated that the temporal change of plasma density contributed 4 GHz and 6 GHz to the frequency drifts in two microwave type III bursts, respectively. However, in our work we found that most microwave type III pairs have frequency drifts 4 GHz . Only 3 among the 11 events have absolute frequency drift 4 GHz , see in Table 1. Actually, in the framework of plasma emission mechanism the separate frequency () reflects the plasma density in the flare energy-release site, and the temporal variation of may reveal the plasma density change during the microwave type III burst pair trains. Table 1 listed the temporal change of separate frequency, most of them are very slow, and even close to zero. Among the 11 type III pair events, the maximum is occurred in the event on 2006 December 13 which is about 10 MHz s-1, and s-1. Then s-1. The observation shows that the relative frequency drift () is from 0.3 s-1 to 5.3 s-1, which is three orders bigger than that caused by the plasma density temporal variation. It seems that the plasma density temporal variation does not contribute to the formation of frequency drift in type III pairs as much as in microwave type III bursts reported by Altyntsev et al. (2007) and Meshalkina et al. (2012). The plasma density gradient dominates the frequency drifts of type III pairs. Therefore, we have the relation, and . With these approximations, the velocity can be expressed,
| (6) |
The frequency gap () between the normal and RS branches is seldom mentioned in previous literature. This work shows that the observed results of are ranging from 10 MHz to 1700 MHz, and different from event to events. Then, what factors do dominate the frequency gap? Li et al. (2011) simulated the generation and propagation of type III bursts based on the assumption of power-law model (PL, Allen 1947) and offset power-law model (OPL, Aschwanden & Benz 1995), respectively. They find that frequency gaps may be very large ( MHz) when electron beams propagate in offset power-law plasma, and relatively small ( MHz) in power-law plasma. It seems that the frequency gap may be related to the distribution of plasma density. According to PE mechanism, the frequency gap means a density difference between start sites of normal and RS type III bursts. With density scale length , a space length can be derived:
| (7) |
can be regarded as an estimation of the length of acceleration regions. The electrons are accelerated in this region and get a relatively high energy, then trigger microwave type III bursts outside this region. It is possible that is only an upper limit of the acceleration region. Panel (4) of Fig. 5 show that frequency gap has no dependence on the separate frequency. This fact implies that the length of acceleration region is possibly irrelevant to the plasma density. It is possible that the particle acceleration mechanism is the main factor to dominate the frequency gap.
Equation (6) and (7) imply that is a key factor for determining the electron beam velocity and the source dimension length. It depends on the plasma density gradient. The microwave type III pairs are generated very close to the flare energy-release site where the magnetic field is an important factor. Considering magnetic field, free-free absorption (Dulk 1985, Stahli & Benz 1987), and plasma mechanism, Tan et al. (2015) proposed a set of formulas to estimate the magnetic field and near the magnetic reconnection site and the electron beams energy from the observations of microwave type III bursts,
| (8) |
and are the lower and upper limits of the magnetic field, respectively. As for type III pairs, there are two lower limits (, ) and two upper limits (, ). The median of the four values can be the best estimator of magnetic field near the start site of the electron beams:
| (9) |
| (10) |
| (11) |
Here, is the radius expressing the divergence of magnetic field lines. Applying this method to the type III pair trains of 2006 December 13, we found that the magnetic field is from 53.617.0 G to 87.427.2 G, the energy of the downward electron beams is 42 - 64 keV which is much similar to that of the upward electron beams. The length of acceleration region is about 18 - 733 km. As lack of imaging observations and is unknown, we did not make the similar estimations in other type III pair events listed in Table 1 and 2.
4 Conclusions
This work reports 11 microwave type III pair events observed by two radio spectrometers at frequency range of 0.80 - 7.60 GHz in 9 solar flares during 1994 - 2014. In the following, we present our conclusions which may provide new constraints in understanding of the origin of solar eruptions and the energetic particles:
(1) All microwave type III pairs occurred after flare onset, distributed in flare impulsive and postflare phases. No type III pair is observed in preflare phase so far. This fact is different from the existing model (Aschwanden & Benz 1995).
(2) The parameters of microwave type III pairs are distributed in a wide ranges, e.g. the separate frequency is 1.08 - 3.42 GHz, the frequency gap is 10 - 1700 MHz, and frequency drifts is 0.4 - 14.5 GHz s-1. The temporal change of separate frequency is very small, and the separate frequency is near a constant in each type III pair train. The most peculiar is that, in most cases, the normal type III branches drift obviously faster than the RS branches. These parameters are different from previous literature (Aschwanden et al. 1997, Ning et al. 2000, etc.). These facts imply that flare primary energy release and electron acceleration may take place in a wider space range.
(3) There are obvious differences between type III pairs occurring in flare impulsive phase and those occurring in postflare phase. Among the 11 type III pair events, 7 events occurred in flare impulsive phases and the other 4 events occurred in postflare phases. The former have relatively low separate frequency, long lifetime, large frequency gap, and slower frequency drift. The latter have relatively higher separate frequency, shorter lifetime, narrower frequency gap, and faster frequency drift, and strong circular polarization.
(4) The frequency drift increases with the separate frequency, the lifetime of each individual burst is anti-correlated to the separate frequency, while the frequency gap between the normal and RS branches of type III pair seems to be independent to the separate frequency.
(5) The plasma density around the flare energy-release sites is about cm-3. The SXR observations show the temperature near source regions are about K, much hotter than the quiet coronal plasma.
Using the new method of Tan et al. (2015) we may estimate the magnetic field and plasma density near the acceleration regions and energy of the electron beams from the observation of microwave type III pairs. Here the imaging observation at the corresponding frequency is necessary. This work demonstrates that broadband spectral imaging observations at microwave range are crucial for understanding the primary energy release and particle accelerations in solar flares. Combining with studies of other spectral fine structures (Huang et al., 2007, Altyntsev et al. 2007, etc.) and imaging observations (Yan et al. 2009), the intrinsic natures of solar flares can be revealed.
References
- Allen (1947) Allen, C. W.: 1947, MNRAS, 107, 426
- Altyntsev (2007) Altyntsev, A. T., Grechnev, V. V., & Meshalkna, N. S.: 2007, SoPh, 242, 111
- Aschwanden (1993) Aschwanden, M. J., Benz, A. O., & Schwartz, R.A.: 1993, ApJ, 417, 790
- Aschwanden (1995) Aschwanden, M. J., & Benz, A. O.: 1995, ApJ, 438, 997
- Aschwanden (1997) Aschwanden, M. J., & Benz, A. O.: 1997, ApJ, 480, 825
- Bastian (1998) Bastian, T. S., Benz, A. O., & Gary, D. E.: 1998, ARAA, 36, 131
- Benz (1992) Benz, A. O., Magun, A., Stehling, W., & Su, H: 1992, SoPh, 141, 335
- Chen (2008) Chen, B., & Yan, Y. H.: 2008, ApJ, 689, 1412
- Chen (2013) Chen, B., Bastian, T.S., White, S.M., & et al.: 2013, ApJL, 763, 21
- Christe (2008) Christe, S., Krucker, S., Lin, R. P.: 2008, ApJ, 680, 149
- Dulk (1985) Dulk, G. A.: 1985, ARAA, 23, 169
- Fu (1995) Fu, Q. J., Qin, Z. H., Ji, H. R., & et al: 1995, SoPh, 160, 97
- Fu (2004) Fu, Q. J., Ji, H. R., Qin, Z. H. & et al.: 2004, SoPh, 222, 167
- Huang (1998) Huang, G. L., Qin, Z. H., Yan, G., Fu, Q. J., & Liu, Y. Y.: 1998, ApSS, 259, 317
- Huang (2007) Huang, J., Yan, Y.H, & Liu, Y.Y.: 2007, Adv Space Res., 39, 1439
- Huang (2011) Huang, J., Demoulin, P., Pick, M., & et al.: 2011, ApJ, 729, 107
- Jiricka (1993) Jiřička, K., Karlický, M., Kepka, O., & Tlamicha, A.: 1993, SoPh, 147, 203
- Kane (1981) Kane, S. R.: 1981, ApJ, 247, 1113
- Karlicky (2014) Karlický, M.: 2014, RAA, 14, 753
- Kliem (2000) Kliem, B., Karlický, M., & Benz, A. O.: 2000, AA, 360, 715
- Li (2011) Li, B., Cairns, I.H., Yan, Y.H., & Robinson, P.A.: 2011, ApJL, 738, 9
- Lin (1971) Lin, R. P., & Hudson, H. S.: 1971, SoPh, 17, 412
- Lin (1981) Lin, R. P., Potter, D. W., Gurnett, D. A., & Scarf, F. L.: 1981, ApJ, 251, 364
- Ma (2008) Ma, Y., Wang, D. Y., Xie, R. X., Wang, M., & Yan, Y. H.: 2008, ApSS, 318, 87
- Masuda (1994) Masuda, S., Kosugi, T., Hara, H., Tsuneta, S., & Ogawara, Y.: 1994, Nature, 371, 495
- Meszarosova (2008) Mészárosová, H., Karlický, M., Sawant, H.S., et al.: 2008, AA, 484, 529
- Melrose (1982) Melrose, D.B., & Dulk, G.A.: 1982, ApJ, 259, 844
- Meshalkina (2004) Meshalkina, N. S., Altyntsev, A.T., Sych, R.A., Chernov, G.P., & Yan, Y.H.: 2004, SoPh, 221, 85
- Meshalkina (2012) Meshalkina, N. S., Altyntsev, A.T., Zhdanov, D.A., & et al: 2012, SoPh, 280, 537
- Ning (2000) Ning, Z. J., Fu, Q. J., & Lu, Q. K.: 2000, SoPh, 194, 137
- Reid (2014) Reid, H. A. S., & Ratcliffe, H.: 2014, RAA, 14, 773
- Robinson (2000) Robinson, P. A., & Benz, A. O.: 2000, SoPh, 194, 345
- Sakai (2005) Sakai, J. I., Kitamoto, T., Saito, S.: 2005, ApJ, 622, 157
- Sawant (1994) Sawant, H. S., Fernandes, F. C., & Neri, J. A. C.F.: 1994, ApJS, 90, 689
- Stahli (1987) Stahli, M., Benz, A. O.: 1987, AA, 175, 271
- Tan (2007) Tan, B. L., Yan, Y.H., Tan, C. M., & Liu, Y.Y.: 2007, ApJ, 671, 964
- Tan (2010) Tan, B. L., Zhang, Y., Tan, C. M., & Liu, Y.Y.: 2010, ApJ, 723, 25
- Tan (2013) Tan, B. L.: 2013, ApJ, 773, 165
- Tan (2015) Tan, B. L., Karlický, M., Mészárosová, H., & Huang, G.L.: 2015, RAA, accepted
- Tang (2012) Tang, J. F., Wu, D.J., & Yan, Y. H.: 2012, ApJ, 745, 134
- Thomas (1985) Thomas R.J., Starr R., & Crannell C.J., 1985, SoPh, 95, 323
- Yan et al (2002) Yan, Y.H., Tan, C.M., & Xu, L., et al., 2002, Sci. Chin. A Suppl., 45, 89
- Yan et al. (2009) Yan, Y. H., Zhang, J., & Wang, W., et al.: 2009, EMP, 104, 97
- Zheleznyakov (1975) Zheleznyakov, V.V., & Zlotnik, E.YA.: 1975, SoPh, 44, 461