The 7Be ii Resonance Lines in Two Classical Novae V5668 Sgr and V2944 Oph
Abstract
We report spectroscopic observations of the resonance lines of singly ionized 7Be in the blue-shifted absorption line systems found in the post-outburst spectra of two classical novae – V5668 Sgr (Nova Sagittarii 2015 No. 2) and V2944 Oph (Nova Ophiuchi 2015). The unstable isotope, 7Be, should has been created during the thermonuclear runaway (TNR) of these novae and decays to form 7Li within a short period (a half-life of 53.22 days). Confirmations of 7Be are the second and the third ones following the first case found in V339 Del by Tajitsu et al. (2015). The blue-shifted absorption line systems in both novae are clearly divided into two velocity components, both of which contain 7Be. This means that the absorbing gases in both velocity components consist of products of TNR. We estimate amounts of 7Be produced during outbursts of both novae and conclude that significant 7Li should have been created. These findings strongly suggest that the explosive production of 7Li via the reaction 3He(,)7Be and subsequent decay to 7Li occurs frequently among classical novae and contributes to the process of the Galactic Li enrichment.
Subject headings:
stars: individual(V5668 Sgr (catalog ), V2944 Oph (catalog )); (stars:) novae, cataclysmic variables – nucleosynthesis, abundances; Galaxy: evolution – abundances1. Introduction
Lithium (Li) is a key element in the study of the chemical evolution of the universe because it likely has been produced in various sites and events – Big Bang nucleosynthesis, interactions between energetic cosmic rays and interstellar matter, evolved low-mass stars, novae, and supernova explosions. The observed Li evolutionary curve has a plateau for young Galactic ages ( 2.5 Gyr) followed by a steep rise. This indicates that a relatively low-mass stellar component with long lifetimes is a major source of Li in the recent universe (Romano et al. 1999, 2001; Prantzos 2012). Some low-mass evolved stars have indeed been found to have Li-enriched surfaces (e.g., Melo et al. 2005). However, there has been no observational confirmation that such stars supply Li to interstellar medium. Li contained in stellar surface could easily be depleted by convection, because Li should be destroyed inside stars where temperature is higher than 2.5 million K.
Novae, which evolve from low-mass binaries, are expected to be one of the candidates for Li suppliers in the recent universe, because they experience explosive nucleosynthesis and mass-loss simultaneously. Cameron & Fowler (1971) made the first theoretical study of Li production in novae. They predicted that the radioactive isotope of beryllium, 7Be, produced via the reaction 3He(, )7Be during the TNR in the accumulated thin gas layer on the surface of a white dwarf (WD). The produced 7Be will be blown away from the surface of a WD by the outburst wind, then decays to form 7Li in the cooler interstellar environment within a short time (a half-life of 53.22 days). In the 1990s, details of this process, which is called as the Cameron-Fowler process, were studied by theoretical analyses (Boffin et al. 1993; Hernanz et al. 1996; José & Hernanz 1998).
Recently, we have reported the detection of 7Be in the post-outburst UV spectra of the classical nova V339 Del (Tajitsu et al. 2015). Because the resonance doublet lines of Be ii are located at 3130 Å where the telluric absorption mainly caused by ozone severely obstructs observations from ground-based telescopes, quantitative studies of the stellar Be abundances have been enabled in 1990s by the advent of 8-10 m class telescopes on high mountains. They are equipped with high-resolution spectrographs having high sensitivities in the near-UV region [e.g., Boesgaard et al. 1999 (Keck i telescope); Primas et al. 2000 (VLT)]. Extensive analyses of stellar Be abundances were conducted for large samples of metal-poor stars (Boesgaard et al. 2011) and solar analogs (Takeda et al. 2011). In the case of V339 Del, we found that the absorption lines of Be ii were purely originating from 7Be instead of the stable 9Be. Therefore, it was the first observational confirmation of the Cameron-Fowler process in classical novae. The 7Be was found in highly blue-shifted (radial velocities, 1000 km s-1) absorption lines, which are assumed to correspond to nova ejecta blown off from the surface of a WD by the outburst wind. Through the direct comparison of absorption strengths between 7Be ii and Ca ii, we estimated that the 7Be abundance in the ejecta of V339 Del could be higher than the pre-existing theoretical prediction (José & Hernanz 1998). Izzo et al. (2015) reported the presence of the Li i 6708 line in the blue-shifted absorption line system in the early phase (7–13 days after the outburst) spectra of V1369 Cen (Nova Centauri 2013). The overabundance of Li in this nova amounts to the order of with respect to the solar photospheric composition.
Now it is quite interesting to know how commonly this 7Be (=7Li) production occurs among various types of classical novae and evaluate their contribution to the Li evolution in the Galaxy. Prompted by these interests, we have performed high resolution spectroscopic observations of two Galactic novae discovered in March 2015 – V5668 Sgr and V2944 Oph, during their early decline phases.
V5668 Sgr (Nova Sagittarii 2015 No. 2 = PNV J183657002855420) was discovered as a bright 6.0 magnitude (unfiltered) source by John Seach on 2015 March 15.634 UT and announced in the American Association of Variable Star Observers (AAVSO) Alert Notice (Waagen 2015a). The nova recorded its optical maximum () on March 21.67 UT (MJD=57102.67). Its optical magnitudes stayed close to the maximum ( – 6.5) for about 80 days, then showed a rapid decline by dust formation (Banerjee et al. 2015a, b; Gehrz et al. 2015). The possible candidates of the progenitor were found in the USNO-B1.0 catalogue (Monet et al. 2003) within 6″ from the nova (USNO-B1.0 0610-078494.3, B1=17.17, R1=16.82, R2=16.42, I=15.55mag; USNO-B1.0 0610-0784923, R1=14.36, B2=13.62, R2=13.65, I=15.08 mag), and in the Galaxy Evolution Explorer (; Martin et al. 2005) catalogue of NUV (1171–2831 Å) sources 3″.6 from the nova ( J183656.8-285539, NUV=17.323 mag) (Waagen 2015a). From a spectroscopic observation obtained immediately after the discovery, Williams et al. (2015) reported that it is an Fe ii type nova according to the classification introduced by Williams (1992).
V2944 Oph (Nova Ophiuchi 2015 = PNV J172913501846120) was discovered as a 12.2 magnitude (unfiltered) source by Yukio Sakurai on 2015 March 29.766 UT (Waagen 2015b). After its discovery, the nova showed a gradual rise to its optical maximum at on April 14.75 UT (MJD = 57126.75). Then, it showed a quick decline to 11.5 within the following few days, and stayed at for 80 days. In the USNO-B1.0 catalogue, a possible candidate of the progenitor was found as a 18 magnitude star at the position of the nova (Waagen 2015b). Its spectrum during the pre-maximum phase showed He/N type characteristics (Danilet et al. 2015). However, Munari et al. (2015) concluded that it is an Fe ii type nova by spectroscopic observations carried out during the maximum and early decline phase. Munari & Walter (2016) presented observations of the time evolution in line profiles during the pre-maximum phase, and pointed out the presence of pre-existing circumstellar materials around the nova. They concluded that the companion in the nova system is not a main sequence dwarf as in most novae but an evolved sub-giant.
In this paper, we report the detection of strong 7Be absorption lines in these two novae. In Section 2, we describe our high resolution spectroscopic observations and data analysis. The results from our observations are described in Section 3. The 7Be abundances estimated from our observed data are presented in Section 4. A brief discussion and conclusions are given in Section 5.
2. Observations
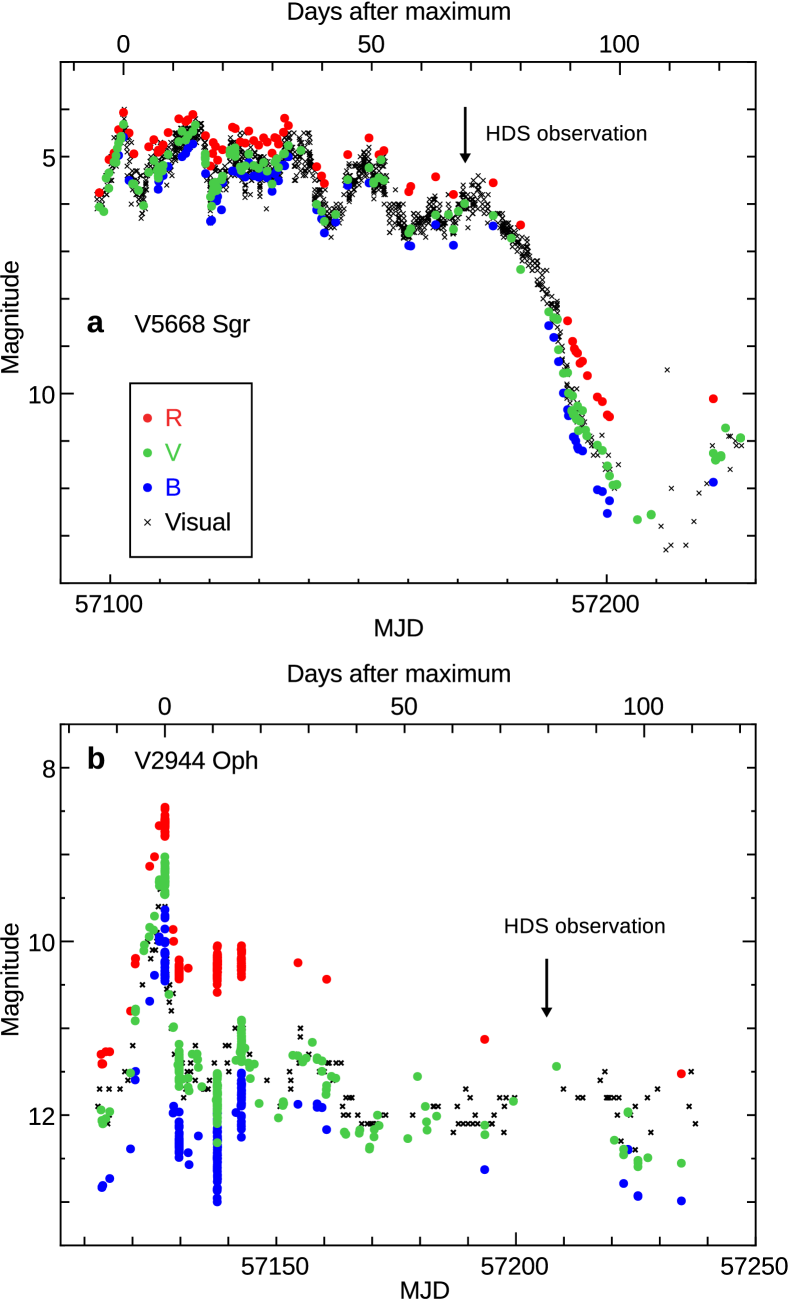
The post-outburst spectra of the two classical novae were obtained using the High Dispersion Spectrograph (HDS) (Noguchi et al. 2002) of the 8.2-m Subaru Telescope on 2015 May 29 (V5668 Sgr; +69 d after the optical maximum) and July 3 (V2944 Oph; +80 d), respectively. Figure 1 shows the AAVSO light curves of two novae with the epochs of our HDS observations. In the case of V5668 Sgr, our observation was just before the start of the rapid decline in optical magnitudes by dust formation. For each nova, we obtained spectra under 3 configurations of the spectrograph, which cover the wavelength regions from 3030 to 4630 Å, from 4110 to 6860 Å, and from 6670 to 9360 Å. Spectral resolving power was set to and 45000 with 0″.6 (0.3 mm) and 0″.8 (0.4 mm) slit widths, respectively. The details of observations are reported in Table 1. Data reduction was carried out using the IRAF software in a standard manner. The non-linearity in the detectors are corrected by the method described in Tajitsu et al. (2010). The typical residual of wavelength calibration performed using Th-Ar comparison spectrum is smaller than Å for each spectrograph configuration. Spectrophotometric calibration was performed using the spectrum of Sgr (, B2V) obtained nearly at the same altitude of the nova on the same nights. All spectra were converted to the heliocentric scale. Correction for interstellar extinction has not been applied. The line identifications were carried out using the atomic line database of Kramida et al. (2014). We also used the line list of Kurucz & Bell (1995) for some weak transitions of Fe-peak elements.
| Date | UTaafootnotemark: | MJD | Exposure | Range | Resolution |
| 2015 | (h m) | (s) | (Å) | ||
| V5668 Sgr | |||||
| May 29 | 10 43 | 57,171.447 | 600 | 4110-6860 | 60,000 |
| (+69 d)bbfootnotemark: | 12 03 | 57,171.502 | 3,600 | 3030-4630 | 60,000 |
| 13 57 | 57,171.581 | 300 | 6670-9360 | 60,000 | |
| V2944 Oph | |||||
| Jul 03 | 6 55 | 57,206.289 | 900 | 6670-9360 | 45,000 |
| (+80 d)ccfootnotemark: | 7 10 | 57,206.299 | 900 | 4110-6860 | 45,000 |
| 7 44 | 57,206.322 | 5,400 | 3030-4630 | 45,000 | |
3. Results
The post-outburst spectra of V5668 Sgr (+69 d) and V2944 Oph (+80 d), which are displayed in Figure 2 and Figure 3, respectively, show very similar spectral characteristics. They contain a series of strong broad emission lines originating from H i Balmer series and some other permitted transitions originating from Fe ii. As in the case of V339 Del described in Tajitsu et al. (2015), most of these broad emission lines are accompanied by blue-shifted multiple absorption lines, whose radial velocities correspond to – km s-1. Many blue-shifted absorption lines of Ti ii, Cr ii, and Fe ii are found in the near UV region.
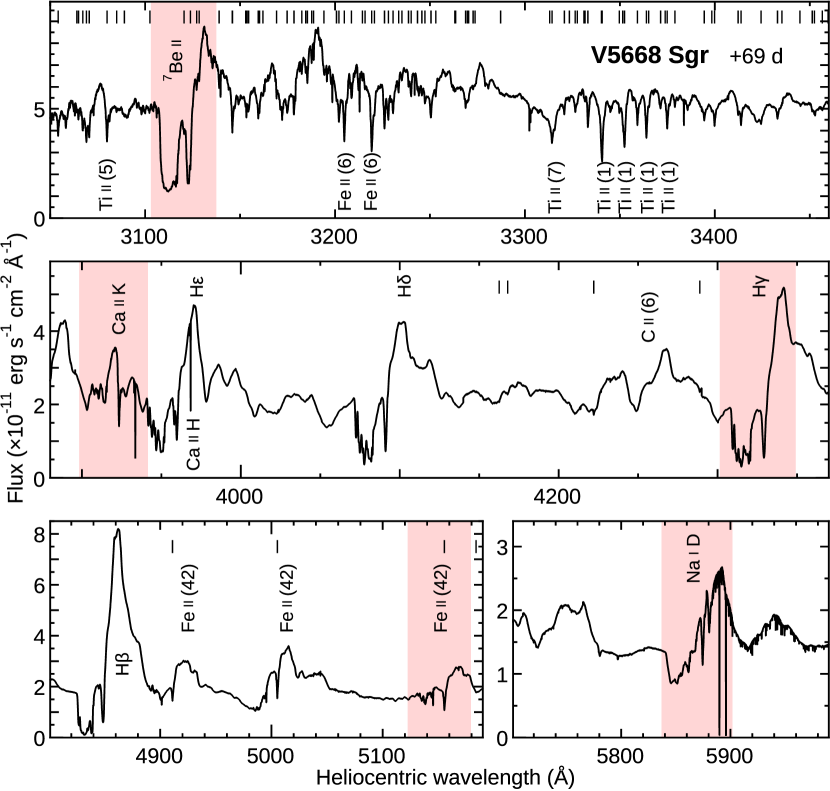
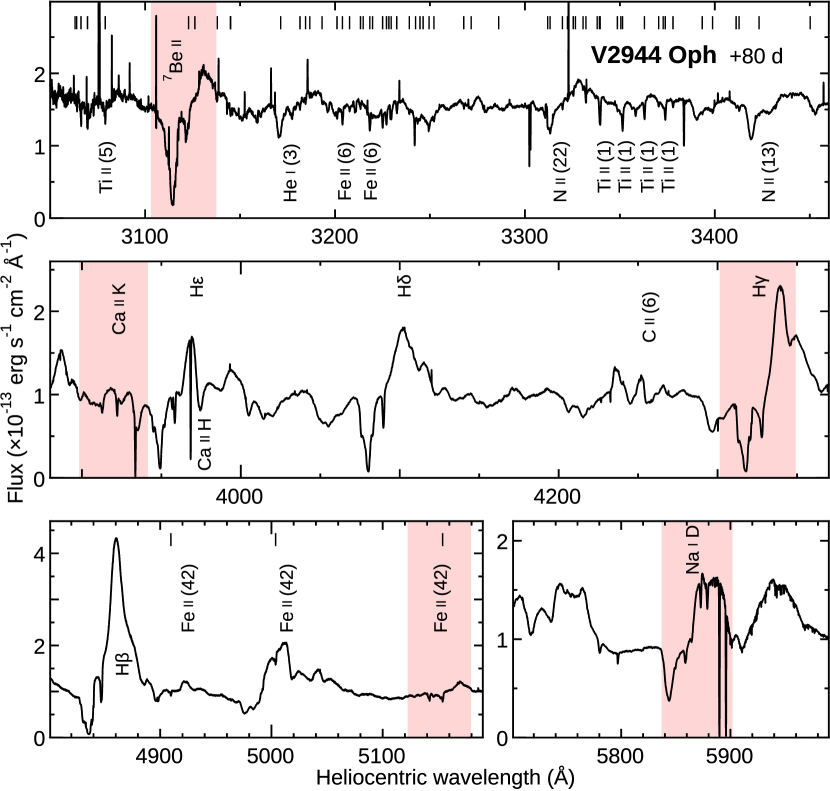
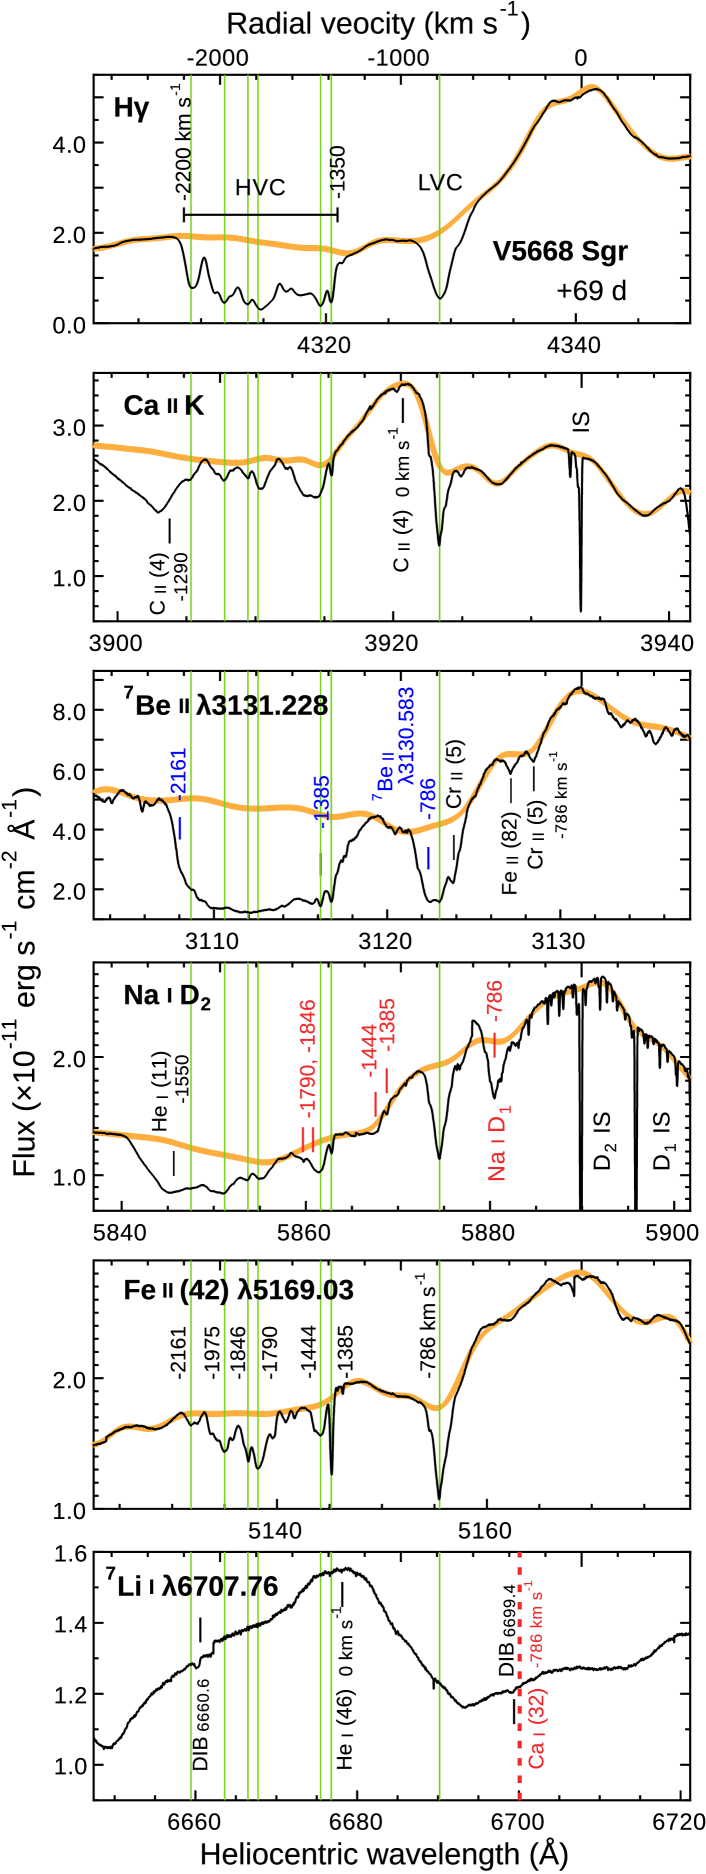
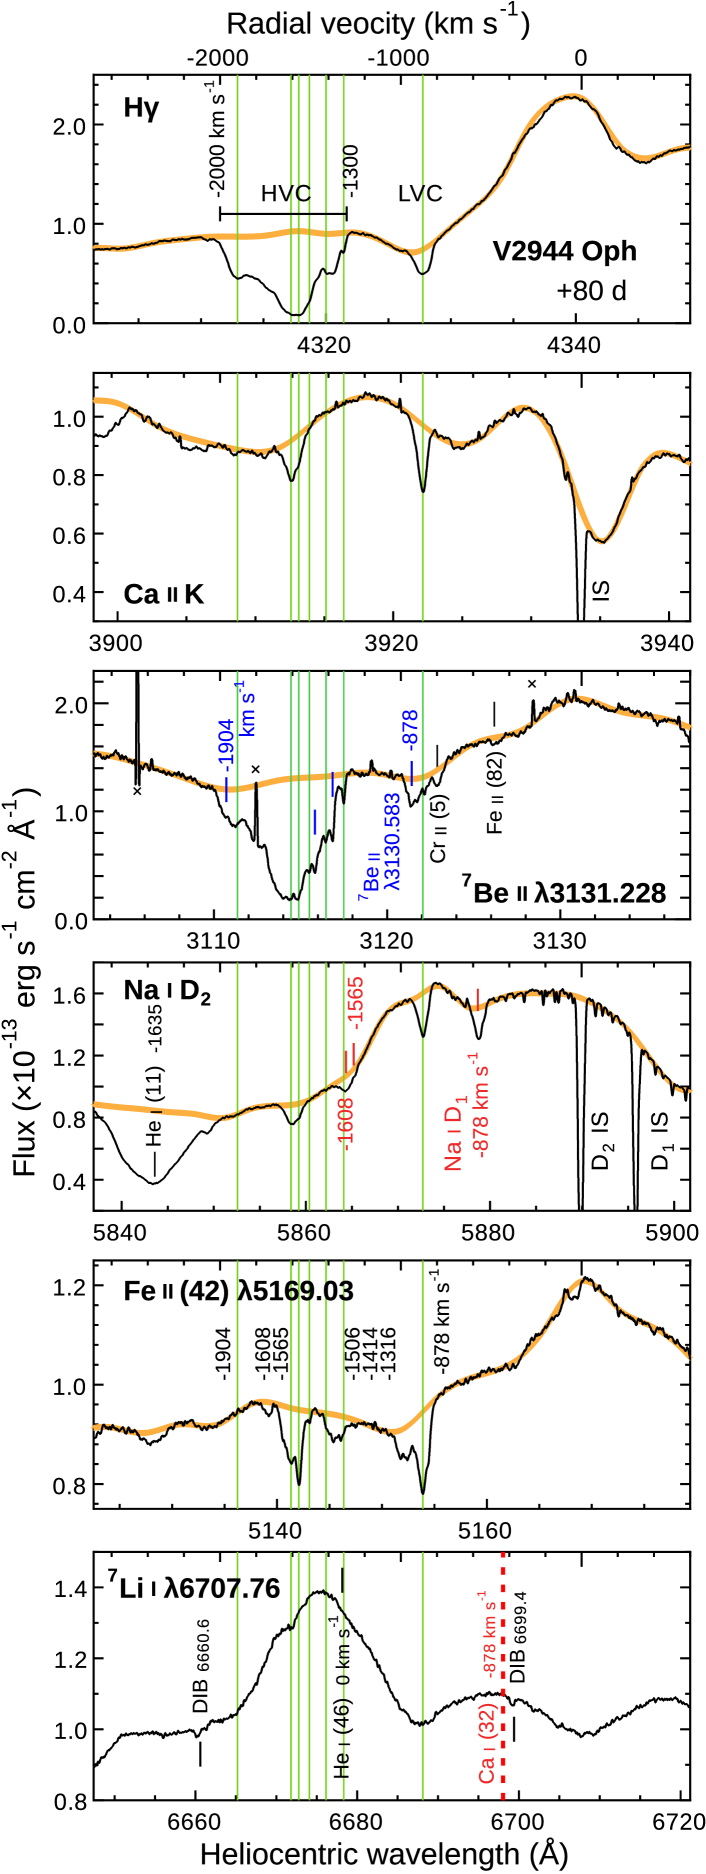
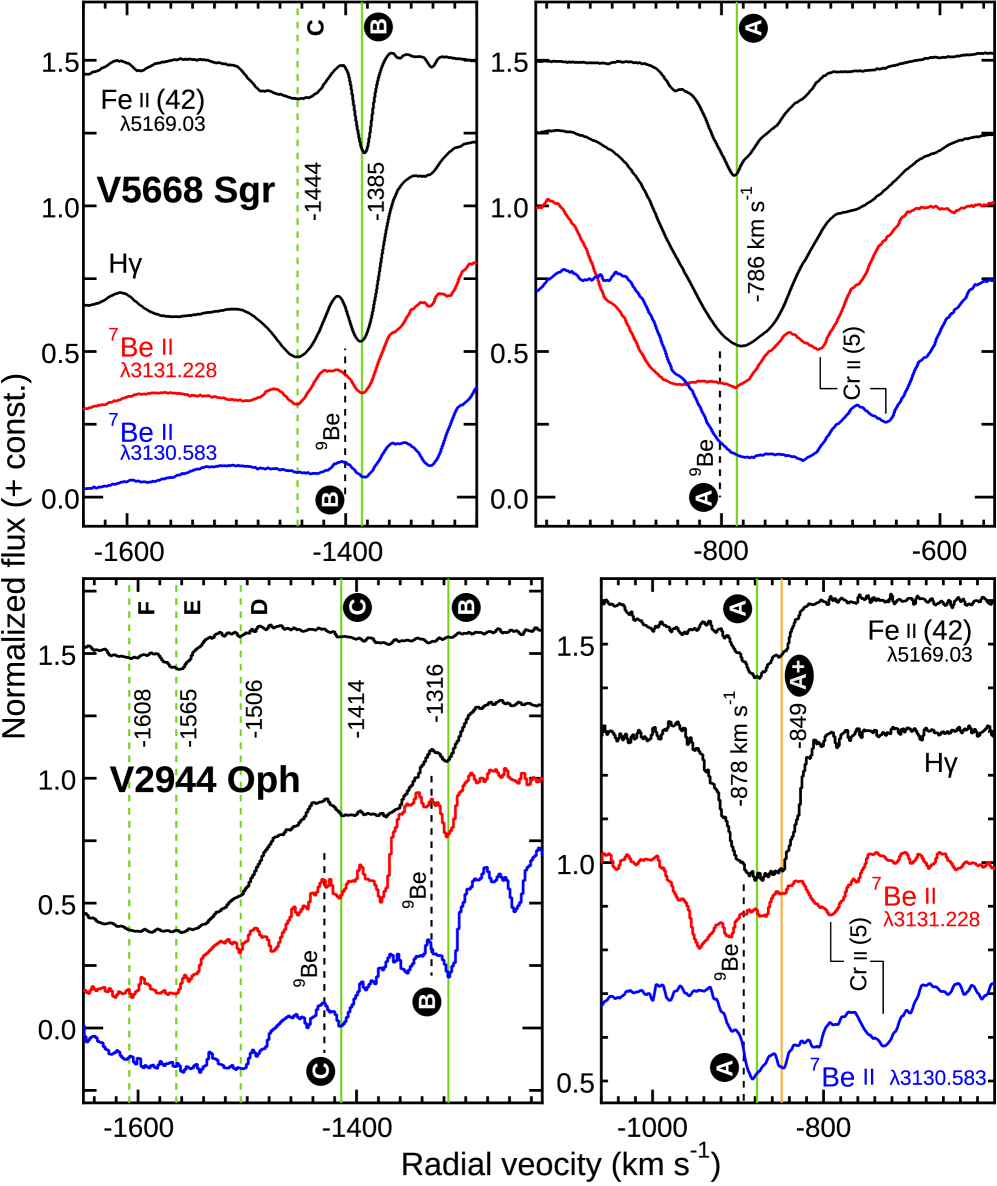
Figure 4 displays the enlarged views of the spectrum of V5668 Sgr in the vicinities of the H, Ca ii K, 7Be ii 3131.228, Na i D2, Fe ii (the multiplet number 42; Moore 1959) 5169.03, and Li i lines, on the velocity scale. The blue-shifted absorption lines of the H line is clearly found to be divided into two components; the low velocity component (LVC) is a single sharp absorption line at a relatively low km s-1, and the high velocity component (HVC) contains a series of sub-components spreading between km s-1. The radial velocities of each sub-component are measured at the absorption dips in the Fe ii (42) and H line, and indicated with vertical lines in the figure. The sharp absorption of the LVC can be easily identified in all lines in the figure. These LVC lines originating from singly ionized Fe-peak elements (Fe ii, Ti ii, Cr ii, Mn ii, and Ni ii) dominate the spectrum in the UV range as in the case of V339 Del from +38 to +48 d. All of the identified transitions originate from levels of low excitation potentials (the lower energy level of the transition, 3.1 eV). The absorption strengths of the HVC vary among different transitions. All of six sub-components in the HVC can be identified in the H and Fe ii (42) lines, although some of them are weaker or missing in Ca ii and Na i lines. In the UV range, only the sub-components at and km s-1 of the HVC can be identified in the strong lines originating from Fe-peak elements.
Figure 5 presents the spectrum of V2944 Oph displayed in the same way as in Figure. 4. The spectrum of this nova shows quite similar characteristics to that of V5668 Sgr. It also shows the blue-shifted absorption systems divided into two velocity components; the LVC at km s-1 and the HVC between km s-1. At least six sub-components can be identified in the HVC as shown by vertical lines in the figure.
As shown in the bottom panels of Figure 4 and 5, we cannot find any counterparts of blue-shifted absorption line systems of the 7Li i 6708 in spite of the high signal-to-noise ratios of the spectra ( and at 6690 Å in V5668 Sgr and V2944 Oph, respectively). There is also no counterpart of the Ca i (32) 6718 in the spectra of both novae, although this line has been detected together with the Li i 6708 line in the first three weeks spectra of V1369 Cen (Izzo et al. 2015). The Ca i 4227 and K i 7699 lines do not have any counterparts in the LVC and the HVC in both observed novae. These observations imply that the ejected gas had been heated into so hot state that almost all Li and Ca atoms are ionized in the circumstance during epochs of our HDS observations.
Figure 6 displays the enlarged radial velocity profiles of Fe ii, H, and the 7Be ii “doublet” lines in both novae. Although the 7Be ii 3130.583, 3131.228 doublet lines are coalesced each other, the dips of each line can be partially identified. In V5668 Sgr, two absorption dips (A and B) are clearly found in all lines. In V2944 Oph, two dips (B and C) of the 7Be ii doublet coincide with those of H. The dip A of 7Be ii 3131.228 (the weaker component of the doublet) in the LVC in this nova is unclear due to the poor signal-to-noise ratio, which is partly disturbed by cosmic ray hits on the spectrum. A sub-component in the LVC at km s-1 (the dip A+) is found in the Fe ii and both 7Be ii lines. We can find no alternative candidates of identifications for these dips from line lists of Fe-peak elements. Because no dips corresponding to the 9Be ii doublet [the isotopic shift; Å (Yan et al. 2008)] can be found, we conclude that the absorption systems at 3110 – 3125 Å in both novae are purely originating from 7Be ii as in the case of V339 Del. The dips of the 7Be ii doublet become hard to be identified toward the flat bottoms of the HVC in both novae. This indicates that the absorption of 7Be ii is saturated, while the intensities at the flat bottoms remain 25 and 15 % of the continua in V5668 Sgr and V2944 Oph, respectively. In V5668 Sgr, the HVCs of the Balmer lines show wavy bottom shapes. This difference indicates that the 7Be ii absorption is stronger than the Balmer lines at this velocity range.
It is interesting to see the similarity in the velocity profiles of the blue-shifted absorption systems in both novae. Some of classical novae also have similar blue-shifted absorption systems with two distinct velocity components – the narrow LVC and the broad HVC (e.g., Nova LMC 2005, V2574 Oph in Williams et al. 2008), which are known as the “principal” and the “diffuse enhanced” systems in post-maximum nova spectra (McLaughlin 1960; Munari 2014). V1369 Cen at +13 d also has two velocity components at and (Izzo et al. 2015). One remarkable point found in this study is that 7Be is detected in both the LVC and the HVC. This means that both of the absorption systems consist of nova ejecta which have experienced TNR. The characteristics of the LVCs in V5668 Sgr and V2944 Oph closely coincide with those of the Transient Heavy Element Absorption (THEA) found by Williams et al. (2008) in post-outburst spectra of classical novae. They assumed that these THEAs are produced by pre-outburst ejecta coming from the secondary star. Considering our results on the 7Be detection, however, it is natural to assume that the THEAs are produced by nova ejecta which have experienced TNR.
| V5668 Sgr | V2944 Oph | ||||||||
|---|---|---|---|---|---|---|---|---|---|
| Lines | aafootnotemark: | 7Be iibbfootnotemark: | (Å)ccfootnotemark: | aafootnotemark: | 7Be iibbfootnotemark: | (Å)ccfootnotemark: | |||
| Ti ii (67) | 3106.246 | 3098.11 | — | 0.003 | 3097.16 | — | 0.006 | ||
| Ti ii (67) | 3117.676 | (3109.51) | HVC | — | (3109.51) | HVC | — | ||
| Cr ii (5) | 3118.646 | (3110.48) | HVC | (0.054 0.026) | (3109.52) | HVC | (0.037 0.020) | ||
| Ti ii (67) | 3119.825 | (3111.65) | HVC | — | (3110.69) | HVC | — | ||
| Cr ii (5) | 3120.359 | (3112.18) | HVC | (0.071 0.034) | (3111.23) | HVC | (0.049 0.030) | ||
| Cr ii (5) | 3120.497 | (3112.32) | HVC | (0.052 0.025) | (3111.36) | HVC | (0.036 0.020) | ||
| Cr ii (5) | 3128.692 | 3120.49 | — | 0.013 0.003 | 3120.49 | — | 0.006 | ||
| Cr ii (5) | 3132.053 | 3123.85 | LVC | 0.067 0.015 | 3123.85 | — | 0.045 0.015 | ||
| Cr ii (5) | 3136.681 | 3128.46 | — | 0.045 0.015 | 3128.46 | — | 0.006 | ||
The 7Be ii absorption may be contaminated by LVCs originating from other Fe-peak elements. We set requirements for major contaminants as eV and , and select candidates for contaminants as listed in Table 2. Only some Cr ii (5) lines are found to be the main contaminants to the LVC and the HVC of the 7Be ii doublet. In V5668 Sgr, the dip of the Cr ii (5) 3132.053 is clearly identified within the 7Be ii LVC (Fig. 6 upper-right panel). In the 7Be ii HVC, no Cr ii (5) lines can be identified because of the strong saturation effect. However, their equivalent widths () can be estimated using measured equivalent widths of nearby unblended Cr ii lines belonging to the same multiplets. We estimate that the combined contributions of these contaminants are less than 5% of the total equivalent widths of the 7Be ii absorption in both the LVC and the HVC in V5668 Sgr. In the case of V2944 Oph, we find that only the Cr ii (5) 3132.053 is present besides the LVC of the 7Be ii doublet. We estimate that the combined contribution of contaminants in the HVC in this nova is similar to or less than that in V5668 Sgr.
| HVC | LVC | ||||||
|---|---|---|---|---|---|---|---|
| Object | Day | ||||||
| V5668 Sgr | +69 d | ||||||
| V2944 Oph | +80 d | ||||||
| V339 Del | +47 d | ||||||
| 1103 km s-1 | |||||||
| 1268 km s-1 | |||||||
4. 7Be abundance
We placed “best-effort” local continua around each line ( km s-1) on the complex, undulating spectra of two novae by the fitting with a high-order (15 – 25) spline function to measure the equivalent widths of the absorption lines. Although the 7Be ii doublet cannot be resolved, its total equivalent widths, s, in the LVC and the HVC are measured. After subtracting the combined effects of contaminations discussed above, we tabulate the resulting in Table 3. The errors of are estimated from the signal-to-noise ratios of the neighboring-continuum. They do not include the uncertainties in the continuum placements.
The abundances of 7Be in nova ejecta is estimated following the same procedure as used in Tajitsu et al. (2015). We compare the equivalent widths of Ca ii K () and 7Be ii (, respectively) in the LVC, which show a simpler structure than the HVC. Here, we need the following assumptions; (1) both the 7Be ii and Ca ii lines are not saturated, (2) the covering factor of the absorbing gas cloud to the background illuminating source has no wavelength dependence. We notice that the LVC feature of 7Be ii at km s-1 of V5668 Sgr might be saturated. The bottom of the 7Be ii lines in the LVC almost reaches to that in the HVC, where its flat profile suggests that the absorption is saturated. The corresponding LVC component of the Ca ii K line in V5668 Sgr is shallow and the line appears to be unsaturated. The abundance of 7Be in V5668 Sgr obtained under such a condition should be taken as a lower limit.
Following Spitzer (1998, Equation (3)-(48)), the ratio of column number densities, , can be written as
| (1) | |||||
Using data of the and the listed in Table 3, the column density ratios, , derived in the LVC of V5668 Sgr and V2944 Oph are and , respectively. These ratios are close to that found in V339 Del at +47 d.
The ionization states of each species are keys to convert the above ratios into atomic abundances. We assume that the most of 7Be is in the singly ionized state, because it still stays in hot ejecta. We also assume that Ca is in the singly ionized state. The absence of Ca i lines in the blue-shifted absorption line systems supports this assumption. The difference in the second ionization potential (Be: 18.21 eV, Ca: 11.87 eV) may lead to different balances between the second and the third ionized ions and this may be a source of an error in determining the abundances. We tried but failed to detect absorption lines of doubly ionized ions of Fe-peak elements, which have intermediate second ionization potentials, consulting Kramida et al. (2014). Absorption lines of Fe iii are observed in optical range spectra of B-type stars (Thompson et al. 2008). This may support the assumption that all of 7Be and Ca contained in the LVC are in the singly ionized state. Adopting this assumption, the mass fraction of 7Be to the sum of all constituent mass components, 7Be ii, can be presented as: 7Be7Be iiCa iiCa. We have obtained 7BeCa for V5668 Sgr and for V2944 Oph. These values correspond to logarithmic overabundances of Li by +6.2 dex and +5.7 dex with respect to the solar photospheric abundance (Asplund et al. 2009). As in the case of V339 Del, the Li abundances in ejecta of both nova explosions are comparable to or even higher than those of Ca. Because the results presented here are based on the observations 75 – 100 days after their outbursts, the amount of 7Be freshly produced in the TNR could be 3 – 4 times larger than our measurements.
We note that these abundances are obtained only using a limited fraction of the nova ejecta giving rise to the LVC absorption. They do not necessarily represent the abundances in the whole materials erupted from these novae. Furthermore, when the 7Be ii lines are saturated, the above values should be treated carefully. Therefore, the derived 7Be abundances in this study might involve large uncertainties. However, the above result implies that classical novae are indeed playing an important role in the process of the Galactic Li enrichment.
To produce 7Be via the reaction 3He(, )7Be, the total number of 3He atoms in the accreted gas before TNR should be larger than or equal to that of freshly produced 7Be atoms in nova ejecta. This means that the number ratios, , in the accreted gases of V5668 Sgr and V2944 Oph are and , respectively. If we adopt the solar abundance ratio between He and Ca (; Asplund et al. 2009), the lower limits of the number ratios between 3He and 4He, , in the accreted gases of V5668 Sgr and V2944 Oph should amount to and %, respectively. These isotopic ratios are close to that found in the solar system (= 0.0166%; Asplund et al. 2009). Hernanz et al. (1996) pointed out that 3He destruction via the reaction 3He(3He, 2)4He occurs concurrently with 3He(, )7Be during TNR. They noted that the 3He destruction via 3He(3He, 2)4He is less pronounced in CO novae than in ONe novae. Because both V5668 Sgr and V2944 Oph are found to be CO novae (see the next section), we guess that the process of 3He destruction should be ineffective and that most of 3He in the accreted gases have been converted into 7Be in both novae.
5. Discussion and conclusions
The detection of 7Be in the post-outburst spectra of V5668 Sgr and V2944 Oph strongly suggests that the explosive production of 7Be is a popular phenomenon among classical novae. The light curves of both novae show slower evolution than that of V339 Del in which the rapid decline were observed in +40 d. Adopting the relation between the time-scaling factor of the light curve and the WD mass (e.g., Hachisu & Kato 2006, 2015), the WD masses of both novae are lower than that of V339 Del. It is natural to assume that both novae have CO WDs as in the case of V339 Del. Therefore, we infer that the explosive Li production via the Cameron-Fowler process occurs frequently at least among CO novae.
It is interesting to notice that we have found LVC and HVC absorptions of the Na i D lines in V5668 Sgr and V2944 Oph, while no trace of blue-shifted absorptions of the Na i D lines were detected in V339 Del (Tajitsu et al. 2015). We find no absorption features corresponding to Li i 6708, K i 7699, and Ca i 4227 in both V5668 Sgr and V2944 Oph as well as in V339 Del. Izzo et al. (2015) found blue-shifted absorptions of H and Na i D lines in V1369 Cen at two velocities ( and km s-1) on spectra obtained during early phase after the outburst (7 to 13 days). They identified Li i 6708, K i 7699, Ca i 6718 and Ca i 4227 in the lower velocity component. These apparent spectral differences, such as detection or no-detection of absorptions of the Na i D or Ca i lines, should reflect differences in physical conditions (most probably the ionization state) in the absorbing clouds. On the other hand, the presence of 7Be both in the LVC and the HVC strongly indicates that the absorbing clouds in both velocity components consist of materials which have experienced TNR.
The abundance of Li obtained by Izzo et al. (2015) from the Li i 6708 is lower than the 7Be (= Li) abundances obtained in the present study. There had been no report in literature of detection of the Li i 6708 line among post-outburst novae before Izzo et al. (2015). Because the Li i 6708 is located in the easily accessible red spectral region, the paucity of observational information may imply that ejecta of post-outburst novae rarely permits the physical condition in which neutral Li can survive. However, it will be interesting to carry out long term monitoring observations of post-outburst spectra of novae including both 7Be and Li lines and examine the consistency of derived Li abundances. Further observations of the 7Be ii line in various types of classical novae will help to quantify roles of novae as the source of Li in the current universe.
References
- Asplund et al. (2009) Asplund, M., Grevesse, N., Sauval, A. J., & Scott, P. 2009, ARA&A, 47, 481
- Banerjee et al. (2015a) Banerjee, D. P. K., Ashok, N. M., & Srivastava, M. 2015a, The Astronomer’s Telegram, 7299, 1
- Banerjee et al. (2015b) Banerjee, D. P. K., Ashok, N. M., Venkataraman, V., & Srivastava, M. 2015b, The Astronomer’s Telegram, 7303, 1
- Boesgaard et al. (1999) Boesgaard, A. M., Deliyannis, C. P., King, J. R., et al. 1999, AJ, 117, 1549
- Boesgaard et al. (2011) Boesgaard, A. M., Rich, J. A., Levesque, E. M., & Bowler, B. P. 2011, ApJ, 743, 140
- Boffin et al. (1993) Boffin, H. M. J., Paulus, G., Arnould, M., & Mowlavi, N. 1993, A&A, 279, 173
- Cameron & Fowler (1971) Cameron, A. G. W., & Fowler, W. A. 1971, ApJ, 164, 111
- Danilet et al. (2015) Danilet, A. B., Holoien, T. W.-S., Wagner, R. M., et al. 2015, The Astronomer’s Telegram, 7339, 1
- Gehrz et al. (2015) Gehrz, R. D., Evans, A., Woodward, C. E., et al. 2015, The Astronomer’s Telegram, 7862, 1
- Hachisu & Kato (2006) Hachisu, I., & Kato, M. 2006, ApJS, 167, 59
- Hachisu & Kato (2015) —. 2015, ApJ, 798, 76
- Hernanz et al. (1996) Hernanz, M., Jose, J., Coc, A., & Isern, J. 1996, ApJ, 465, L27
- Izzo et al. (2015) Izzo, L., Della Valle, M., Mason, E., et al. 2015, ApJ, 808, L14
- José & Hernanz (1998) José, J., & Hernanz, M. 1998, ApJ, 494, 680
- Kramida et al. (2014) Kramida, A., Yu. Ralchenko, Reader, J., & and NIST ASD Team. 2014, NIST Atomic Spectra Database (ver. 5.2), [Online]. Available: http://physics.nist.gov/asd [2015, July 23]. National Institute of Standards and Technology, Gaithersburg, MD.
- Kurucz & Bell (1995) Kurucz, R., & Bell, B. 1995, Atomic Line Data (R.L. Kurucz and B. Bell) Kurucz CD-ROM No. 23. Cambridge, Mass.: Smithsonian Astrophysical Observatory, 1995., 23
- Martin et al. (2005) Martin, D. C., Fanson, J., Schiminovich, D., et al. 2005, ApJ, 619, L1
- McLaughlin (1960) McLaughlin, D. B. 1960, in Stellar Atmospheres, ed. J. L. Greenstein (The University of Chicago Press), 585–652
- Melo et al. (2005) Melo, C. H. F., de Laverny, P., Santos, N. C., et al. 2005, A&A, 439, 227
- Monet et al. (2003) Monet, D. G., Levine, S. E., Canzian, B., et al. 2003, AJ, 125, 984
- Moore (1959) Moore, C. E. 1959, A Multiplet Table of Astrophysical Interest: NBS Technical Note No. 36, Reprinted Version of the 1945 edition (US Department of Commerce)
- Munari (2014) Munari, U. 2014, in Astronomical Society of the Pacific Conference Series, Vol. 490, Stella Novae: Past and Future Decades, ed. P. A. Woudt & V. A. R. M. Ribeiro, 183
- Munari et al. (2015) Munari, U., Ochner, P., Siviero, A., Dallaporta, S., & Valisa, P. 2015, The Astronomer’s Telegram, 7367, 1
- Munari & Walter (2016) Munari, U., & Walter, F. M. 2016, MNRAS, 455, L57
- Noguchi et al. (2002) Noguchi, K., Aoki, W., Kawanomoto, S., et al. 2002, PASJ, 54, 855
- Prantzos (2012) Prantzos, N. 2012, A&A, 542, A67
- Primas et al. (2000) Primas, F., Molaro, P., Bonifacio, P., & Hill, V. 2000, A&A, 362, 666
- Romano et al. (1999) Romano, D., Matteucci, F., Molaro, P., & Bonifacio, P. 1999, A&A, 352, 117
- Romano et al. (2001) Romano, D., Matteucci, F., Ventura, P., & D’Antona, F. 2001, A&A, 374, 646
- Spitzer (1998) Spitzer, L. 1998, Physical Processes in the Interstellar Medium
- Tajitsu et al. (2010) Tajitsu, A., Aoki, W., Kawanomoto, S., & Narita, N. 2010, Publ. Natl. Astron. Obs. Japan, 13, 1
- Tajitsu et al. (2015) Tajitsu, A., Sadakane, K., Naito, H., Arai, A., & Aoki, W. 2015, Nature, 518, 381
- Takeda et al. (2011) Takeda, Y., Tajitsu, A., Honda, S., et al. 2011, PASJ, 63, 697
- Thompson et al. (2008) Thompson, H. M. A., Keenan, F. P., Dufton, P. L., et al. 2008, MNRAS, 383, 729
- Waagen (2015a) Waagen, E. O. 2015a, AAVSO Alert Notice, 512
- Waagen (2015b) —. 2015b, AAVSO Alert Notice, 516
- Williams et al. (2008) Williams, R., Mason, E., Della Valle, M., & Ederoclite, A. 2008, ApJ, 685, 451
- Williams (1992) Williams, R. E. 1992, AJ, 104, 725
- Williams et al. (2015) Williams, S. C., Darnley, M. J., & Bode, M. F. 2015, The Astronomer’s Telegram, 7230, 1
- Yan et al. (2008) Yan, Z.-C., Nörtershäuser, W., & Drake, G. W. F. 2008, Physical Review Letters, 100, 243002