11email: sdhawan@eso.org 22institutetext: Excellence Cluster Universe, Technische Universität München, Boltzmannstrasse 2, D-85748, Garching, Germany 33institutetext: Physik Department, Technische Universität München, James-Franck-Strasse 1, D-85748 Garching bei München 44institutetext: Aix Marseille Université, CNRS, LAM (Laboratoire d’Astrophysique de Marseille) UMR 7326, 13388 Marseille, France
A reddening-free method to estimate the mass of Type Ia supernovae
The increase in the number of Type Ia supernovae (SNe Ia) has demonstrated that the population shows larger diversity than has been assumed in the past. The reasons (e.g. parent population, explosion mechanism) for this diversity remain largely unknown. We have investigated a sample of SNe Ia near-infrared light curves and have correlated the phase of the second maximum with the bolometric peak luminosity. The peak bolometric luminosity is related to the time of the second maximum (relative to the B light curve maximum) as follows : .
masses can be derived from the peak luminosity based on Arnett’s rule, which states that the luminosity at maximum is equal to instantaneous energy generated by the nickel decay. We check this assumption against recent radiative-transfer calculations of Chandrasekhar-mass delayed detonation models and find this assumption is valid to within 10% in recent radiative-transfer calculations of Chandrasekhar-mass delayed detonation models.
The vs. relation is applied to a sample of 40 additional SNe Ia with significant reddening ( 0.1 mag) and a reddening-free bolometric luminosity function of SNe Ia is established. The method is tested with the mass measurement from the direct observation of rays in the heavily absorbed SN 2014J and found to be fully consistent.
Super-Chandrasekhar-mass explosions, in particular SN 2007if, do not follow the relations between peak luminosity and second IR maximum. This may point to an additional energy source contributing at maximum light.
The luminosity function of SNe Ia is constructed and is shown to be asymmetric with a tail of low-luminosity objects and a rather sharp high-luminosity cutoff, although it might be influenced by selection effects.
Key Words.:
supernovae:general – supernovae: individual: 2014J, 2006X, 2007if1 Introduction
Type Ia supernovae (SNe Ia) exhibit diverse observable properties. In addition to the spectral and colour differences, the peak luminosity of SNe Ia range over several factors (e.g. Suntzeff 1996, 2003; Li et al. 2011). The amount of 56Ni, derived from the bolometric luminosity, (Contardo, Leibundgut & Vacca 2000) and the total ejecta mass (Stritzinger et al. 2006; Scalzo et al. 2014) also show a wide dispersion. The distribution provides insight into the possible progenitor channels and explosion mechanisms for SNe Ia (see Hillebrandt & Niemeyer 2000; Livio 2000; Truran, Glasner, & Kim 2012).
The uncertainty in the reddening correction directly impacts the ability to derive accurate bolometric luminosities and masses derived from the peak luminosity. The total to selective absorption () appears systematically and significantly lower in the SN hosts than the canonical Milky Way value of 3.1. Nobili & Goobar (2008) use a large sample of nearby SNe Ia to derive an average which is significantly lower than 3.1. Taking into account spectroscopic features that correlate with luminosity, Chotard et al. (2011) found an of which is consistent with the Milky Way value. However, objects with high extinction are seen to have an unusually low (Phillips et al. 2013; Patat et al. 2015). Due to interstellar dust a correction for reddening in the Milky Way and the host galaxy needs to be applied. Our goal is to establish a relation between the bolometric peak luminosity and the mass independent of reddening.
The Near Infrared (NIR) light curve morphology of SNe Ia is markedly different from that in the optical. In particular, the light curves start to rebrighten about 2 weeks after the first maximum, resulting in a second peak. Recent studies (e.g. Biscardi et al. 2012; Dhawan et al. 2015) found that more luminous SNe Ia reach the second maximum in NIR filters at a later phase. This was predicted by Kasen (2006) who also indicated that the phase of the second maximum (designated in the following as and measured relative to the -band light curve maximum) should be a function of the mass in the explosion. We expect that the phase of the second NIR maximum can be used to determine bolometric peak luminosity and the amount of synthesized in the explosion.
In the following, we investigate the link between the peak bolometric luminosity () and the phase of the second maximum in the NIR light curves (). We use a sample of nearby SNe Ia with low host-galaxy extinction (described in Section 2) to determine and then employ different methods to derive (Section 3). This relation can then be used to derive and for all SNe Ia with a measured , since the timing parameter is free of reddening corrections and allows us to include heavily reddened objects. We check our derivation against independent measurements of with the nearby SN 2014J in M82 and SN 2006X (Section 4). With the reddening independent method we can establish the luminosity function of SNe Ia at maximum and also derive the distribution of nickel masses among SN Ia explosions (Section 5). We finish by discussing the implications of this determination of the distribution in the conclusions (Section 6).
2 Data
Our SN Ia sample is constrained to objects, which have NIR observations at late times ( days after B maximum) with well-sampled optical and NIR light curves to construct a (pseudo-)bolometric light curve and measure . The main source of near-infrared photometry of SNe Ia is the Carnegie Supernova Project (CSP; Contreras et al. 2010; Burns et al. 2011; Stritzinger et al. 2011; Phillips 2012; Burns et al. 2014). We add to this sample objects from the literature. We only included SNe Ia with observations near maximum from to filters. The full description of the selected SNe Ia can be found in Dhawan et al. (2015).
The sample of low-reddening SNe Ia is defined to circumvent the uncertainties of host galaxy extinction. The 18 objects are presented in Table 1. We use values from the literature. Only objects with mag were included. Since we consider only objects, which display the second maximum in their NIR light curves this implies that most low-luminosity SNe Ia, especially SN 1991bg-like objects were excluded.
At maximum light the UV-optical-IR integrated luminosity represents 90% of the true bolometric luminosity (Blondin, Dessart, & Hillier 2015). We constructed bolometric light curves for objects with sufficient photometry near maximum light in the optical and the NIR. The filter data was excluded since only few SN Ia have well-sampled light curves. We calculated the fraction of the flux emitted in for a few well-observed SNe Ia with sufficient data and determined it to be around of the UVOIR luminosity at maximum. The exclusion of the -flux results in only a minor uncertainty in the final UVOIR luminosity.
Prior to the derivation of a bolometric flux for the low extinction sample (see Table 3) we apply a correction for the measured extinction following Cardelli, Clayton & Mathis (1989). The assumed distances and their references can be found in Table 1.
| SN | Reference | |||||||
| (d) | (d) | (d) | ( erg/s) | |||||
| SN2002dj | 32.93 0.30 | 0.010 0.003 | P08 | … | 23.0 0.9 | 1.25 0.26 | ||
| SN2002fk | 32.59 0.15 | 0.035 0.003 | C14 | … | 25.8 0.3 | 1.42 0.23 | ||
| SN2005M | 35.01 0.09 | 0.027 0.002 | B14 | … | 1.19 0.20 | |||
| SN2005am | 32.85 0.20 | 0.043 0.002 | B14 | 19.7 0.7 | 1.10 0.20 | |||
| SN2005el | 34.04 0.14 | 0.098 0.001 | B14 | 24.3 0.7 | 1.01 0.11 | |||
| SN2005eq | 35.46 0.07 | 0.063 0.003 | B14 | 25.1 0.1 | 1.32 0.20 | |||
| SN2005hc | 36.50 0.05 | 0.028 0.001 | B14 | … | 1.36 0.30 | |||
| SN2005iq | 35.80 0.15 | 0.019 0.001 | B14 | 25.0 0.1 | 1.07 0.21 | |||
| SN2005ki | 34.73 0.10 | 0.027 0.001 | B14 | 20.5 1.7 | 1.03 0.27 | |||
| SN2006bh | 33.28 0.20 | 0.023 0.001 | B14 | 21.0 0.6 | 0.86 0.15 | |||
| SN2007bd | 35.73 0.07 | 0.029 0.001 | B14 | … | … | 1.22 0.13 | ||
| SN2007on | 31.45 0.08 | 0.010 0.001 | B14 | 14.1 1.4 | 0.60 0.09 | |||
| SN2008R | 33.73 0.16 | 0.062 0.001 | B14 | … | 0.53 0.10 | |||
| SN2008bc | 34.16 0.13 | 0.225 0.004 | B14 | 31.0 1.4 | 1.24 0.19 | |||
| SN2008gp | 35.79 0.06 | 0.104 0.005 | B14 | 34.4 0.7 | 1.29 0.14 | |||
| SN2008hv | 33.84 0.15 | 0.028 0.001 | B14 | 21.9 0.5 | 1.08 0.16 | |||
| SN2008ia | 34.96 0.09 | 0.195 0.005 | B14 | 19.2 0.9 | 1.13 0.14 | |||
| SN2011fe | 28.91 0.20 | 0.021 0.001 | P13 | … | 24.3 0.6 | 1.10 0.15 | ||
| E(B-V) references: P08: Pignata et al. (2008); C14: Cartier et al. (2014) B14:Burns et al. (2014);P13: Patat et al. (2013) | ||||||||
3 Results
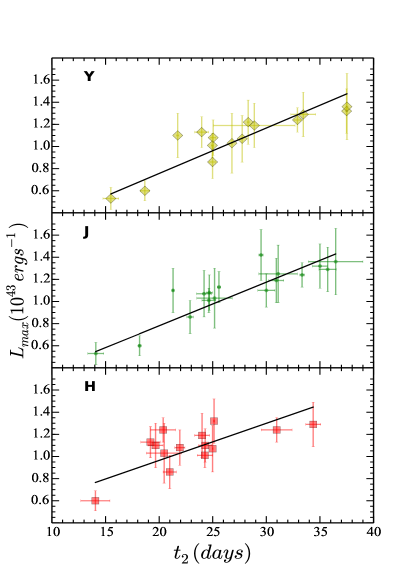
Based on our previous work (Dhawan et al. 2015), where we found strong correlations between various derived parameters of SNe Ia with in the and filters, we argued that the bolometric maximum luminosity should also correlate with . The sample of low-reddening SNe Ia described in Section 2 is used to establish the relation between and . The parameter has the advantage that is is essentially independent of reddening and distance (relative to the calibration sample). With such a relation we will be in a position to derive the luminosity function of SNe Ia at maximum.
3.1 Correlation between and
Figure 1 displays a strong correlation between for the and filter light curves and the bolometric (UVOIR) luminosity (determined by fitting a spline interpolation to the UVOIR light curve) with Pearson coefficients and , respectively for the low-reddening sample. A much weaker trend is observed in the filter light curve with 0.60.
The slope of the vs. relation appears to flatten for objects with 27 d. This is most prominent in the band. However, we would require a larger sample to confirm this trend amongst the most luminous objects.
We fit a simple linear relation to the data
| (1) |
which leads to the entries in Table 2 (for filters). The corresponding fits are shown in Figure 1. We compare our observed values to the and from the DDC models of Blondin et al. (2013). Model spectra and light curves published in Blondin et al. (2013) based on delayed detonation explosions show similar correlations to those described herein.
In the interest of a clean low extinction sample, we have removed 7 objects with but total . Interestingly, several of the excluded objects are amongst the most luminous SNe Ia in the sample. Even after the removal of these 7 objects we do not derive a significant correlation for the band light curves from our sample. It will have to be seen, whether future data will reveal a correlation or whether the light curves are not as sensitive to the nickel mass as the other NIR filters. The relations are identical for the full and restricted sample within the uncertainties listed in Table 2. We combine the relations from the two bands for extrapolating the values of in the following analysis. We assume the band estimate to be equivalent to the value in the band and calculate the slope and intercept with the photometry of both filters, which leads to improved statistics.
| Filter | ||
|---|---|---|
| Y | ||
| J | ||
| H |
3.2 Deriving from
| SN | err () | err (rise time) | (fixed rise) | err () | err (rise time) | ||
|---|---|---|---|---|---|---|---|
| (M☉ ) | (M☉ ) | (M☉ ) | (M☉ ) | (M☉ ) | (M☉ ) | (M☉ ) | |
| SN2002dj | 0.59 0.16 | 0.12 | 0.10 | 0.63 0.16 | 0.13 | 0.10 | 0.61 0.13 |
| SN2002fk | 0.68 0.16 | 0.11 | 0.12 | 0.71 0.17 | 0.12 | 0.12 | 0.76 0.13 |
| SN2005M | 0.59 0.14 | 0.10 | 0.10 | 0.60 0.14 | 0.10 | 0.10 | 0.59 0.11 |
| SN2005am | 0.47 0.13 | 0.08 | 0.10 | 0.55 0.14 | 0.10 | 0.10 | 0.52 0.11 |
| SN2005el | 0.45 0.10 | 0.05 | 0.09 | 0.51 0.11 | 0.06 | 0.09 | 0.48 0.07 |
| SN2005eq | 0.67 0.15 | 0.10 | 0.11 | 0.66 0.15 | 0.10 | 0.11 | 0.67 0.11 |
| SN2005hc | 0.69 0.19 | 0.15 | 0.12 | 0.68 0.19 | 0.15 | 0.12 | 0.71 0.16 |
| SN2005iq | 0.48 0.13 | 0.09 | 0.09 | 0.54 0.14 | 0.11 | 0.09 | 0.51 0.10 |
| SN2005ki | 0.45 0.14 | 0.11 | 0.09 | 0.51 0.17 | 0.14 | 0.09 | 0.49 0.14 |
| SN2006bh | 0.37 0.10 | 0.06 | 0.08 | 0.43 0.11 | 0.08 | 0.07 | 0.40 0.07 |
| SN2007bd | 0.55 0.13 | 0.06 | 0.11 | 0.61 0.12 | 0.07 | 0.10 | 0.59 0.10 |
| SN2007on | 0.23 0.06 | 0.03 | 0.05 | 0.30 0.07 | 0.05 | 0.05 | 0.28 0.05 |
| SN2008R | 0.20 0.06 | 0.04 | 0.05 | 0.27 0.07 | 0.05 | 0.05 | 0.25 0.06 |
| SN2008bc | 0.60 0.14 | 0.09 | 0.11 | 0.62 0.15 | 0.10 | 0.11 | 0.63 0.11 |
| SN2008gp | 0.62 0.13 | 0.06 | 0.11 | 0.65 0.11 | 0.07 | 0.09 | 0.64 0.09 |
| SN2008hv | 0.48 0.11 | 0.07 | 0.09 | 0.54 0.12 | 0.08 | 0.09 | 0.52 0.09 |
| SN2008ia | 0.50 0.12 | 0.06 | 0.10 | 0.57 0.11 | 0.07 | 0.09 | 0.55 0.09 |
| SN2011fe | 0.50 0.12 | 0.07 | 0.10 | 0.55 0.12 | 0.08 | 0.09 | 0.52 0.10 |
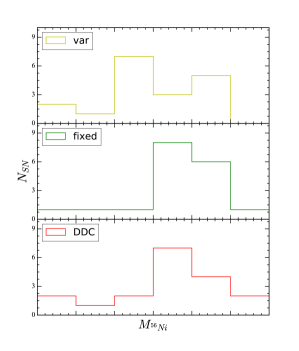
We present three different methods to derive from , namely using Arnett’s rule with an individual rise time for each SN Ia, using Arnett’s rule with an assumed constant rise time applied to all SNe Ia and by calculating from delayed detonation models with different yields (Blondin et al. 2013). Arnett’s rule states that at maximum light the bolometric luminosity equals the instantaneous rate of energy input from the radioactive decays. Any deviations from this assumption are encapsulated in a parameter below. It is quite possible that depends on the explosion mechanism and shows some variation between explosions (Branch 1992; Khokhlov, Mueller, & Hoeflich 1993). These early papers found rather large ranges with depending on the exact explosion model and the amount of assumed mixing Branch (1992); Khokhlov, Mueller, & Hoeflich (1993). More recently Blondin et al. (2013) found a range of within 10% of 1 for delayed detonation models. These models are not applicable for low-luminosity SNe Ia. Should systematically depend on explosion characteristics then the derived nickel masses may suffer from a systematic drift not captured in our treatment. These uncertainties must be taken into account for the interpretation of the derived 56Ni mass.
3.2.1 Arnett’s rule with individual rise times
Arnett’s rule states that the luminosity of the SN at peak is given by the instantaneous rate of energy deposition from radioactive decays inside the expanding ejecta (Arnett 1982; Arnett et al. 1985).
This is summarized as (Stritzinger et al. 2006):
| (2) |
where is the rate of energy input from 56Ni and 56Co decays at maximum, is the rise time to bolometric maximum and accounts for deviations from Arnett’s Rule. The energy output from 1 M☉ of is ():
| (3) |
We use the relation for estimates using different rise times in the filter for each SN following,
| (4) |
from Scalzo et al. (2014) which covers the – parameter space of Ganeshalingam, Li, & Filippenko (2011). Like Scalzo et al. (2014) we apply a conservative uncertainty estimate of days. The bolometric maximum occurs on average 1 day before (Scalzo et al. 2014).
3.2.2 Arnett’s rule with a fixed rise time
Originally was determined from for a fixed rise time of 19 days for all SNe Ia (Stritzinger et al. 2006). Similar to these analyses we propagate an uncertainty of 3 days to account for the diversity in the rise times.
The peak luminosity then becomes (Stritzinger et al. 2006)
| (5) |
3.2.3 Interpolating using delayed detonation models
We interpolate the relation between (in a given filter set, u H in this case) and found from a grid of Chandrasekhar mass delayed detonation models of Blondin et al. (2013) to derive a mass from the observed peak luminosity for the sample presented in Table 1. The resulting mass estimates are presented in the bottom panel of Figure 2. For all but the least luminous of these models, is within 10 of 1 (Blondin et al. 2013).
3.3 Comparison of different methods
In Figure 2, we plot the distributions of the , inferred for the low-reddening sample, from the different methods.
Similar to previous studies we find that there is a large distribution in the values for the sample in Table 1. We note a over a factor of 2 difference between the lowest and highest values (a factor of 3 for the variable rise time formalism). Unlike previous studies, this sample doesn’t include faint, 91bg-like objects, since their NIR light curves do not display a second maximum. These objects are found to have a much lower 0.1 (Stritzinger et al. 2006; Scalzo et al. 2014) from their peak luminosities. There is clearly a majority of objects with nickel masses between 0.4 and 0.7 with extensions to higher and lower masses. A further difference can be seen in Fig. 2 where the mass distribution between the case of individual and the fixed rise times is slightly different due to the fact that observed rise times often are shorter than the assumed 19 days.
The individual errors clearly dominate over the differences between the methods and the results are not influenced by the chosen method. There appears a small systematic offset between the masses derived from DDC models and the ones with Arnett’s rule and fixed rise time. The masses from the DDC models are about 0.05 smaller, however, well within the overall uncertainties, which are typically around 0.15 (Tab. 3).
For SN2011fe Pereira et al. (2013) report a rise time of 16.58 days. Using this rise time, we obtain an of 0.49 M☉ which is a 0.06 M☉ shift from the value using a 19 d rise. This shift is smaller than the uncertainty on the mass. For the low-reddening sample we note that the average difference between the fixed rise and variable rise formalisms is 0.04 M⊙.
For the following analysis, we calculate the using . By substituting the relation derived between and (equation (1) and equation (3)), we obtain
| (6) |
We mostly will use the fixed rise time formalism in the following analysis, although in special cases, we will also make use of the more accurately known rise time.
4 Test with well observed SNe Ia
Dust in the host galaxy and the Milky Way makes the determination of the peak luminosity uncertain. Many nearby SNe Ia have shown marked deviations in the host galaxy dust properties from those observed in the Milky Way mostly favouring a smaller value (Goobar 2008; Phillips et al. 2013). The extinction corrections are notoriously uncertain and directly affect our ability to measure peak bolometric luminosities of SNe Ia. Since is independent of reddening, we can use the derived correlation to determine the peak luminosity and estimate the mass for heavily reddened SNe Ia.
We test this relation on SN 2014J, which has a direct ray detection from the decay chain (Churazov et al. 2014; Diehl et al. 2015). Using the best fit relation for the reddening-free sample, we obtain for a days and a rise time of 19 days. Since the error on the rise time is taken as 3 days, we expect the error on to decrease with a less conservative error estimate on . Goobar et al. (2015) used Palomar Transient Factory (PTF) and Kilodegree Extremely Little Telescope (KELT) data to measure the rise time of SN 2014J. They find days. We place a conservative error estimate of 1 day and evaluate the which has a lower error bar than from the fixed rise time formalism.
The direct measurement of for SN 2014J through the ray detection gives an independent and fairly secure estimate of the nickel mass. Churazov et al. (2014) derive . Diehl et al. (2015) find a slightly lower mass of .
| (inferred) | Method | Reference | |
|---|---|---|---|
| 0.62 | 0.13 | ray lines | Churazov et al. (2014) |
| 0.56 | 0.10 | ray lines | Diehl et al. (2015) |
| 0.37 | Bolometric light curve =1.7 mag | Churazov et al. (2014); Margutti et al. (2014) | |
| 0.77 | Bolometric light curve =2.5 mag | Churazov et al. (2014); Goobar et al. (2014a) | |
| 0.64 | 0.13 | NIR second maximum | this work (combined fit) |
| 0.60 | 0.10 | NIR second maximum measured rise | this work |
A detailed comparison of the derived masses is given in Table 4. The difficulty of the extinction correction and the advantage of the method presented here are obvious. The uncertainty in the ray determination is due to the weakness of the signal and leads to slightly different interpretations. The very good correspondence between the direct measurement and our relation of the second maximum in the NIR light curves is encouraging.
As a second case, we determine the bolometric peak luminosity and the nickel mass based on to the heavily extinguished SN 2006X. Wang et al. (2008) derived a peak luminosity for this SN from multi-band photometry and a correction for dust absorption in the host galaxy. They determined a bolometric peak luminosity for SN 2006X of erg s-1, which compares well with our measurement of erg s-1. Wang et al. (2008) determined , which should be compared to found from using the fixed rise time formalism. The measured rise time for SN 2006X is d, which leads to M⊙.
| SN | (inferred) | (Lit. Val.) | Percent Difference | Reference 111The references for the measurements are RL92: Ruiz-Lapuente & Lucy (1992), S06a: Stritzinger et al. (2006), S06b: Stritzinger et al. (2006), St05: Stehle et al. (2005), ER06: Elias-Rosa et al. (2006), L09: Leloudas et al. (2009), W08: Wang et al. (2008), S10: Scalzo et al. (2010) | |
|---|---|---|---|---|---|
| (d) | (M☉ ) | (M☉ ) | |||
| SN 1986G | 16.4 1.4 | 0.33 0.08 | 0.38 0.03 | 15.15 | RL92 |
| SN 1998bu | 29.9 0.4 | 0.58 0.12 | 0.57 | 1.7 | S06b |
| SN 1999ac | 27.0 2.0 | 0.53 0.12 | 0.67 0.29 | 26.4 | S06a |
| SN 2001el | 31.2 0.7 | 0.62 0.12 | 0.40 0.38 | 33.8 | S06a |
| SN 2002bo | 28.9 0.7 | 0.56 0.12 | 0.52 | 7.1 | St05 |
| SN 2003cg | 30.2 1.5 | 0.59 0.13 | 0.53 | 10.1 | ER06 |
| SN 2003hv | 22.3 0.1 | 0.43 0.11 | 0.40 0.11 | 6.9 | L09 |
| SN 2006X | 28.2 0.5 | 0.57 0.11 | 0.50 0.05 | 12.2 | W08 |
| SN 2007if | 32.3 0.8 | 0.65 0.16 | 1.6 0.1 | 158.3 | S10 |
Table 5 presents several additional highly reddened SNe Ia, which had a previous determination of the nickel mass. The for these objects were calculated in the same way as for SN 2014J and SN 2006X.
From Table 5, we can see that 1986G has a lower value of than the other heavily reddened objects. This is consistent with the observed optical decline rate and lower band luminosity (Phillips et al. 1987). Using nebular spectra, Ruiz-Lapuente & Lucy (1992) calculate the for SN 1986G and find a value of M☉ . This is fully consistent with the estimate from .
Scalzo et al. (2014) give M for SN 2005el and SN 2011fe. The comparison for SN 2011fe shows M☉ from the NIR light curves, whereas Scalzo et al. (2014) find M☉ . The difference is mostly in the adopted value of , 1.2 in Scalzo et al. (2014) compared to 1 in this study. Rescaling the value from Scalzo et al. (2014) to =1, we obtain = 0.50 0.08 M☉ , which is fully consistent with our value. Pereira et al. (2013) report nickel masses for SN 2011fe for different values of . Their nickel mass for =1 is M☉ , nearly identical to our determination. For SN 2005el, Scalzo et al. (2014) obtain an of 0.52 0.12 M⊙. Scaled to an , this gives = 0.62. We find = 0.51 0.11 M⊙, which is broadly consistent with the value found in Scalzo et al. (2014).
From the comparisons in Table 5, we conclude that there is good agreement between our values and those published in the literature. For SN 2001el we see that the error in the estimate from is substantially smaller than from the bolometric light curve.
One significant outlier is SN 2007if. This was presented as a super-Chandrasekhar-mass explosion (Scalzo et al. 2010) with a total luminosity of erg s-1. The reddening from the host galaxy is somewhat unclear. There is no indication of Na foreground absorption, while the colour evolution and the Lira law would indicate some reddening. Any reddening would only increase the luminosity and the derived nickel mass based on Arnett’s rule. The estimate from for SN 2007if is significantly lower than the mass estimate through the bolometric peak luminosity by Scalzo et al. (2010). If we recalculate the from the bolometric light curve presuming no extinction from the host galaxy, we obtain = 1.6 M⊙. This is a factor of 2 larger than our estimate. We discuss this supernova in Section 6.
5 The luminosity function of SNe Ia at maximum
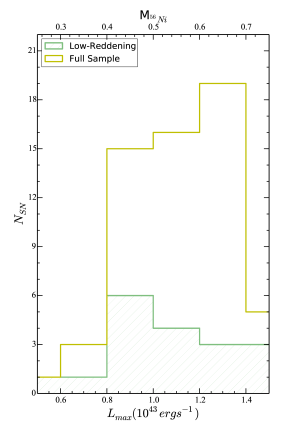
We are now in a position to derive for all SNe Ia with a reliably measured (as given in Tables 1 and 6) and establish the bolometric luminosity function of SNe Ia at maximum light. For objects in the low-reddening sample, we use the determined from and the best-fit linear relation (green histogram in Figure 3). Since the phase of the second maximum in the near infrared is independent from the reddening we can derive the reddening-free distribution of the luminosity function of SNe Ia (Fig. 3). We show here the histogram of 58 SNe Ia as derived from the and light curves. The luminosity scale is based on the calibration sample of low-reddening objects (Section 3).
The luminosity function of SNe Ia is clearly not symmetric. The luminosity range spans slightly over a factor of 2. We find no obvious difference between the full sample and the low-reddening sample used to calibrate the relation between and . If anything the calibration sample has a flatter distribution with most SNe around erg s-1, while the full sample includes more luminous objects. This could be an effect of the magnitude limit of the searches. The exact biases in our sample are difficult to define as it is not volume limited.
.
The bolometric luminosity function can be compared to the filter luminosity function derived by Li et al. (2011) based on 74 SNe Ia including the low-luminosity objects missing in our sample. The Li et al. (2011) magnitude-limited luminosity function (their Fig. 10) peaks at an absolute magnitude of with a few objects above and a tail to fainter objects down to . This is also reflected in our luminosity function (Fig.3), where we observe a clear peak at with some more luminous objects and a tail to fainter objects. The range is also comparable to the one found by Li et al. (2011).
In the next step we derive the distribution of for all SNe Ia with sufficient infrared light curve data using equation 6 and a fixed rise time and . Table 6 and Fig. 3 present the SN Ia nickel mass function.
| SN | ||||
|---|---|---|---|---|
| (M☉ ) | ( erg/s) | |||
| 1980N | 0.42 | 0.10 | 0.84 | 0.21 |
| 1981B | 0.63 | 0.13 | 1.26 | 0.21 |
| 1986G | 0.33 | 0.07 | 0.66 | 0.18 |
| 1998bu | 0.58 | 0.12 | 1.16 | 0.20 |
| 1999ac | 0.53 | 0.12 | 1.05 | 0.20 |
| 1999ee | 0.68 | 0.15 | 1.36 | 0.21 |
| 2000E | 0.62 | 0.14 | 1.24 | 0.22 |
| 2000bh | 0.65 | 0.14 | 1.30 | 0.22 |
| 2001bt | 0.55 | 0.12 | 1.10 | 0.20 |
| 2001cn | 0.58 | 0.13 | 1.19 | 0.20 |
| 2001cz | 0.67 | 0.14 | 1.33 | 0.22 |
| 2001el | 0.61 | 0.13 | 1.22 | 0.21 |
| 2002bo | 0.56 | 0.11 | 1.12 | 0.21 |
| 2003cg | 0.64 | 0.13 | 1.19 | 0.22 |
| 2003hv | 0.43 | 0.10 | 0.84 | 0.17 |
| 2004ey | 0.57 | 0.14 | 1.14 | 0.20 |
| 2004gs | 0.43 | 0.11 | 0.85 | 0.18 |
| 2004gu | 0.71 | 0.17 | 1.42 | 0.23 |
| 2005A | 0.56 | 0.13 | 1.12 | 0.18 |
| 2005al | 0.49 | 0.13 | 0.97 | 0.21 |
| 2005na | 0.64 | 0.15 | 1.28 | 0.22 |
| 2006D | 0.49 | 0.13 | 0.98 | 0.19 |
| 2006X | 0.57 | 0.11 | 1.13 | 0.19 |
| 2006ax | 0.62 | 0.15 | 1.24 | 0.21 |
| 2006et | 0.64 | 0.16 | 1.27 | 0.22 |
| 2006gt | 0.39 | 0.09 | 0.77 | 0.18 |
| 2006hb | 0.41 | 0.11 | 0.81 | 0.19 |
| 2006kf | 0.47 | 0.12 | 0.94 | 0.19 |
| 2007S | 0.71 | 0.16 | 1.41 | 0.22 |
| 2007af | 0.57 | 0.14 | 1.16 | 0.20 |
| 2007as | 0.47 | 0.14 | 0.94 | 0.25 |
| 2007bc | 0.55 | 0.14 | 1.09 | 0.20 |
| 2007bm | 0.54 | 0.13 | 1.08 | 0.20 |
| 2007ca | 0.66 | 0.16 | 1.29 | 0.22 |
| 2007if | 0.65 | 0.16 | 1.30 | 0.22 |
| 2007jg | 0.53 | 0.14 | 1.06 | 0.20 |
| 2007le | 0.61 | 0.15 | 1.21 | 0.20 |
| 2007nq | 0.46 | 0.13 | 0.92 | 0.20 |
| 2008C | 0.63 | 0.16 | 1.26 | 0.23 |
| 2008fp | 0.62 | 0.13 | 1.24 | 0.21 |
| 2014J | 0.64 | 0.13 | 1.28 | 0.22 |
6 Discussion and Conclusion
Using the relation derived from the low-reddening sample we extrapolate an value for 58 SNe Ia objects having a measured . The estimate of , along with this relation, provides a method to deduce the bolometric peak luminosity, independent of a reddening estimate, distance measurement (relative to the calibration of our low-absorption sample) and without requiring multi-band photometry. We hence have established a reddening-free luminosity function of SNe Ia at peak (Fig. 3).
We established an intrinsic luminosity function and mass distribution for all SNe Ia with a measurement (Tab. 6). The distribution of has a standard deviation of 0.2 erg s-1 and has a standard deviation of 0.11 M⊙. Scalzo et al. (2014) find a similar distribution of with a of 0.16 M⊙. We test our method on SN 2014J, a heavily reddened SN Ia in the nearby galaxy M82 and find good agreement between the estimates from the ray observations (Churazov et al. 2014; Diehl et al. 2015, see Table 4). Faint, 91bg-like SNe Ia, which show typically lower luminosities (Filippenko et al. 1992; Leibundgut et al. 1993), do not display a second maximum in their NIR light curves and are not in our sample. Therefore, the true dispersion, in peak luminosity and , for SN Ia will likely be larger than what is derived here. Stritzinger et al. (2006) find a dispersion of a factor of 10, since their sample included peculiar SNe Ia like SN 1991bg and SN 1991T.
Our reddening-free estimate of the can be compared to independent mass estimates, e.g. from the late-time ( 200 d) pseudo-bolometric light curve. It should also be possible to determine the amount of radiation emitted outside the UVOIR region of the spectrum at late phases and a bolometric correction (e.g. Leloudas et al. 2009). There are very few objects for which both NIR data to measure and nebular phase pseudo-bolometric observations are present, making a quantitative comparison for a sample of objects extremely difficult. Thus, we strongly encourage more late-time observations of SN Ia.
The observed and distributions directly connect to the physical origin of the diversity amongst SNe Ia. A possible explanation is the difference in the explosion mechanism. Pure detonations of WDs (Arnett 1969) were seen to be unfeasible since they burn the entire star to iron group elements and do not produce the intermediate mass elements (IMEs) observed in SN Ia spectra. Pure deflagrations (e.g. Travaglio et al. 2004) can reproduce observed properties of SNe with 0.4 M⊙. Deflagration models however, cannot account for SNe with higher and hence, cannot explain the entire distribution in Figure 3.
Delayed-detonation models (e.g. Khokhlov 1991; Woosley 1990) are more successful in producing higher M. In this explosion model a subsonic deflagration expands the white dwarf to create low densities for IMEs to be produced in a supersonic detonation phase which is triggered at a deflagration-to-detonation transition density ().
Recent 1D studies by Blondin et al. (2013) confront a suite of Chandrasekhar mass () delayed detonation models with observations for SNe with a range of peak luminosities. They find a very good agreement of their models with photometric and spectroscopic observations at maximum. The range of produced by their models corresponds well with the observations in Figure 3, making these models a strong candidate to explain the observed diversity.
explosion models can possibly account for the observed distribution in M. Recent studies (e.g. van Kerkwijk, Chang, & Justham 2010) on the other hand posit sub-Chandrasekhar mass explosions as a progenitor scenario for SNe Ia (for e.g., see Woosley & Weaver 1994). This scenario is attractive since it can account for the progenitor statistics from population synthesis (see Livio 2000; Ruiter et al. 2013). Moreover, studies like Stritzinger et al. (2006) and Scalzo et al. (2014) find a significant fraction of SNe Ia to have 1.4 M⊙, providing observational evidence for the sub- progenitor scenario. We compare the luminosity function in Figure 3 to the one obtained by Ruiter et al. (2013), using their violent merger models. They present a relation between primary white dwarf mass () and peak brightness for a grid of sub- models. For objects in the lowest two bins of our luminosity distribution, the corresponds to 1 to 1.1 ⊙. For the highest luminosity objects, the models indicate an of 1.28 M⊙. Thus, the luminosity function corresponds to a range of sub-Chandrasekhar , which provides further evidence for the plausibility of sub- explosions as a progenitor scenario. The mass distribution (Fig. 3) is comparable to the yields from the models of Sim et al. (2010). Our and distributions do not allow us to distinguish which explosion mechanism is responsible for the observed variety.
We note that our sample includes one peculiar, super- event, SN 2007if (Scalzo et al. 2010), with an estimated 0.16 M☉ using our technique. This is significantly lower than the value estimated in Scalzo et al. (2010) of 1.6 0.1 M⊙. The estimate for this object is not exceptionally high, indicating a substantial but not exceptional amount of (similar to 91T-like SNe). One of the possible reasons for this discrepancy could be that the peak luminosity is not just a product of decay. This idea has been entertained in theoretical models for these super- SN Ia. The models advocate a scenario of ejecta interaction with circumstellar material (CSM; see Hachinger et al. 2012; Dado & Dar 2015). There is also an indication of a shell interaction in this supernova (Scalzo et al. 2010) and if this interaction results in increased peak luminosity then the mass through Arnett’s rule would be overestimated. It could well be that additional energy is emitted in these super- objects. A significant, but not extreme, amount of produced in the explosion along with interaction with the CSM could then explain the observed properties, e.g. lower ejecta velocities ( 9000 km s-1) and high peak luminosity. In Hachinger et al. (2012), the lower limit on is 0.6 M☉ which agrees well with our estimate.
The literature for such super- objects with NIR light curves is still limited. Using the data in Taubenberger et al. (2011) for SN 2009dc, we obtain a (J) of 31.7 6.2 d which corresponds to an of . Taubenberger et al. (2013) also argue for less extreme based on late phase photometry and spectroscopy, although they prefer a comparatively higher (1 ) than our inferred value. One possible reason could be that the high ejecta densities lead to an earlier onset of the recombination wave than expected for normal Ia’s and hence an earlier than is expected for a given mass. This would lead to an inference of lower from for super- SNe.
If we assume that the inferred mass from indicate the core for all SNe Ia the peak luminosity of super– SNe Ia would be boosted by an additional energy source, like shell interaction within the explosion. A good indicator could be the late bolometric decline phase and luminosity. This comparison would be much closer to the determitation of the second peak than the peak bolometric luminosity.
Larger samples of well-observed SNe (e.g. Friedman et al. 2015) will help in improving the statistics of such a study. Future investigations with a detailed comparison between observations and a suite of sub- detonation models will help shed more light on the nature of the progenitor scenario and explosion mechanism of SN Ia. Moreover, future theoretical studies of peculiar, super- SNe will help in deciphering the nature of these extreme explosions.
Acknowledgements.
This research was supported by the DFG Cluster of Excellence ʻOrigin and Structure of the Universe’. B.L. acknowledges support for this work by the Deutsche Forschungsgemeinschaft through TRR33, The Dark Universe. We all are grateful to the ESO Visitor Programme to support the visit of S. B. to Garching. We would like to thank Rahman Amanullah for providing published photometry of SN2014J in the near infrared.References
- Arnett (1969) Arnett W. D., 1969, Ap&SS, 5, 180
- Arnett (1982) Arnett W. D., 1982, ApJ, 253, 785
- Arnett et al. (1985) Arnett W. D., Branch D., Wheeler J. C., 1985, Nature, 314, 337
- Biscardi et al. (2012) Biscardi I., et al., 2012, A&A, 537, A57
- Blondin et al. (2013) Blondin S., Dessart L., Hillier D. J., Khokhlov A. M., 2013, MNRAS, 429, 2127
- Blondin, Dessart, & Hillier (2015) Blondin S., Dessart L., Hillier D. J., 2015, MNRAS, 448, 2766
- Branch (1992) Branch D., 1992, ApJ, 392, 35
- Burns et al. (2011) Burns C. R., et al., 2011, AJ, 141, 19
- Burns et al. (2014) Burns C. R., et al., 2014, ApJ, 789, 32
- Cardelli, Clayton & Mathis (1989) Cardelli J. A., Clayton G. C., Mathis J. S., 1989, ApJ, 345, 245
- Cartier et al. (2014) Cartier R., et al., 2014, ApJ, 789, 89
- Chotard et al. (2011) Chotard N., et al., 2011, A&A, 529, L4
- Churazov et al. (2014) Churazov E., et al., 2014, Nature, 512, 406
- Churazov et al. (2015) Churazov E., et al., 2015, ApJ, 812, 62
- Contardo, Leibundgut & Vacca (2000) Contardo G., Leibundgut B., Vacca W. D., 2000, A&A, 359, 876
- Contreras et al. (2010) Contreras C., et al., 2010, AJ, 139, 519
- Dado & Dar (2015) Dado S., Dar, A., 2015, ApJ, 809, 32
- Dhawan et al. (2015) Dhawan S., Leibundgut B., Spyromilio J., Maguire K., 2015, MNRAS, 448, 1345
- Diehl et al. (2015) Diehl R., et al., 2015, A&A, 574, A72
- Elias-Rosa et al. (2006) Elias-Rosa N., et al., 2006, MNRAS, 369, 1880
- Filippenko et al. (1992) Filippenko A. V., et al., 1992, AJ, 104, 1543
- Friedman et al. (2015) Friedman A. S., et al., 2015, ApJS, 220, 9
- Ganeshalingam, Li, & Filippenko (2011) Ganeshalingam M., Li W., Filippenko A. V., 2011, MNRAS, 416, 2607
- Goobar (2008) Goobar A., 2008, ApJ, 686, L103
- Goobar et al. (2014a) Goobar A., et al., 2014, ApJ, 784, L12
- Goobar et al. (2015) Goobar A., et al., 2015, ApJ, 799, 106
- Hachinger et al. (2012) Hachinger S., Mazzali P. A., Taubenberger S., Fink M., Pakmor R., Hillebrandt W., Seitenzahl I. R., 2012, MNRAS, 427, 2057
- Hillebrandt & Niemeyer (2000) Hillebrandt W., Niemeyer J. C., 2000, ARA&A, 38, 191
- Kasen (2006) Kasen D., 2006, ApJ, 649, 939
- Khokhlov (1991) Khokhlov A. M., 1991, A&A, 245, 114
- Khokhlov, Mueller, & Hoeflich (1993) Khokhlov A., Mueller E., Höflich P., 1993, A&A, 270, 223
- Leibundgut et al. (1993) Leibundgut B., et al., 1993, AJ, 105, 301
- Leloudas et al. (2009) Leloudas G., et al., 2009, A&A, 505, 265
- Li et al. (2011) Li W., et al., 2011, MNRAS, 412, 1441
- Livio (2000) Livio M., 2000, in: Type Ia Supernovae, Theory and Cosmology, ed. J. C. Niemeyer& J. W. Truran, Cambridge: Cambridge University Press, 33
- Margutti et al. (2014) Margutti R., Parrent J., Kamble A., Soderberg A. M., Foley R. J., Milisavljevic D., Drout M. R., Kirshner R., 2014, ApJ, 790, 52
- Mazzali et al. (2007) Mazzali P. A., Röpke F. K., Benetti S., Hillebrandt W., 2007, Science, 315, 825
- Nadyozhin (1994) Nadyozhin D. K., 1994, ApJS, 92, 527
- Nobili & Goobar (2008) Nobili S., Goobar A., 2008, A&A, 487, 19
- Patat et al. (2013) Patat F., et al., 2013, A&A, 549, A62
- Patat et al. (2015) Patat F., et al., 2015, A&A, 577, A53
- Pereira et al. (2013) Pereira R., et al., 2013, A&A, 554, A27
- Phillips (2012) Phillips M. M., 2012, PASA, 29, 434
- Phillips et al. (1987) Phillips M. M., et al., 1987, PASP, 99, 592
- Phillips et al. (2013) Phillips M. M., et al., 2013, ApJ, 779, 38
- Pignata et al. (2008) Pignata G., et al., 2008, MNRAS, 388, 971
- Ruiter et al. (2013) Ruiter A. J., et al., 2013, MNRAS, 429, 1425
- Ruiz-Lapuente & Lucy (1992) Ruiz-Lapuente P., Lucy L. B., 1992, ApJ, 400, 127
- Scalzo et al. (2010) Scalzo R. A., et al., 2010, ApJ, 713, 1073
- Scalzo et al. (2014) Scalzo R., et al., 2014, MNRAS, 440, 1498
- Sim et al. (2010) Sim S. A., Röpke F. K., Hillebrandt W., Kromer M., Pakmor R., Fink M., Ruiter A. J., Seitenzahl I. R., 2010, ApJ, 714, L52
- Stehle et al. (2005) Stehle M., Mazzali P. A., Benetti S., Hillebrandt W., 2005, MNRAS, 360, 1231
- Stritzinger et al. (2006) Stritzinger M., Leibundgut B., Walch S., Contardo G., 2006, A&A, 450, 241
- Stritzinger et al. (2006) Stritzinger M., Mazzali P. A., Sollerman J., Benetti S., 2006, A&A, 460, 793
- Stritzinger et al. (2011) Stritzinger M. D., et al., 2011, AJ, 142, 156
- Suntzeff (1996) Suntzeff N. B., 1996, in: Supernovae and supernova remnants, ed. Richard McCray & Zhenru Wang, Cambridge: Cambridge University Press, 41
- Suntzeff (2003) Suntzeff, N. B. 2003, in: From Twilight to Highlight, The Physics of Supernovae, ed. W. Hillebrandt & B. Leibundgut, Heidelberg:Springer, 183
- Taubenberger et al. (2011) Taubenberger S., et al., 2011, MNRAS, 412, 2735
- Taubenberger et al. (2013) Taubenberger S., et al., 2013, MNRAS, 432, 3117
- Travaglio et al. (2004) Travaglio C., Hillebrandt W., Reinecke M., Thielemann F.-K., 2004, A&A, 425, 1029
- Truran, Glasner, & Kim (2012) Truran J. W., Glasner A. S., Kim Y., 2012, JPhCS, 337, 012040
- van Kerkwijk, Chang, & Justham (2010) van Kerkwijk M. H., Chang P., Justham S., 2010, ApJ, 722, L157
- Wang et al. (2008) Wang X., et al., 2008, ApJ, 675, 626
- Woosley (1990) Woosley S. E., 1990, BAAS, 22, 1221
- Woosley & Weaver (1994) Woosley S. E., Weaver T. A., 1994, ApJ, 423, 371