Observations of multiple blobs in homologous solar coronal jets in closed loops
Solar Physics
keywords:
Flares, Microflares and Nanoflares; Magnetic Reconnection, Observational Signatures; Jets1 Introduction
s-intro Coronal jets are transient and collimated plasma motions accompanied by point-like or loop-like brightenings at their bottom. They were first discovered in soft X-ray (SXR) by the YOHKOH spacecraft observations (Shibata et al., 1992). With the development of solar space telescopes and the increase of spatial resolution, more and more coronal jets are observed and investigated in SXR as well as extreme-ultraviolet (EUV) wavelengths (Shimojo et al., 1996; Shimojo & Shibata, 2000; Paraschiv et al., 2015; Nisticò et al., 2015). They are located not only in coronal holes and active region (AR) boundary where open magnetic field dominates, but also in quiet regions with large-scale, closed magnetic field (Cirtain et al., 2007; Culhane et al., 2007; Zhang et al., 2012b). The typical length of jets is 10400 Mm, the width is 5100 Mm, and the apparent velocity is 101000 km s-1 (Shimojo et al., 1996). The temperature of polar jets ranges from 0.1 to 6.2 MK, with an average value of 1.8 MK. The electron number density of polar jets ranges from 0.1 to 8.0108 cm-3, with an average value of 1.5108 cm-3 (Paraschiv et al., 2015). These parameters for polar jets are much lower than those for flare-related jets where much larger amount of free energies are released (Shimojo & Shibata, 2000). It is generally accepted that coronal jets are caused by magnetic reconnection. The way of reconnection, however, depends largely on the magnetic configuration. In the two-dimensional (2D) case, new magnetic fluxes emerge from beneath the photosphere and reconnect with the pre-existing, open magnetic fields of opposite polarity, resulting in hot, collimated jets and two bright lobes at the base of jets (Heyvaerts et al., 1977; Shibata et al., 1992; Yokoyama & Shibata, 1996). Such mechanism became popular and was developed in the state-of-the-art, three-dimension (3D) magnetohydrodynamic (MHD) numerical experiments (Moreno-Insertis et al., 2008; Moreno-Insertis & Galsgaard, 2013; Archontis & Hood, 2013; Fang et al., 2014). A fraction of rotating coronal jets might be produced by the magnetic reconnection as a result of swirling motion of an embedded bipole in the photosphere (Pariat et al., 2009, 2010; Wyper & DeVore, 2015). Moore et al. (2010) classified coronal jets into the standard type and blowout type. The standard type with simpler morphology can be explained by the emerging-flux model (Shibata et al., 1992; Lim et al., 2015). The blowout type usually results from small-scale filament eruptions (Moore et al., 2013). They have cool components and show rotating and/or transverse drifting motions (Chen et al., 2012; Hong et al., 2013; Pucci et al., 2013; Schmieder et al., 2013; Zhang & Ji, 2014a; Liu et al., 2015b). However, Sterling et al. (2015) proposed that both the standard and blowout polar jets in their sample are driven by small-scale filament eruptions, which resemble the coronal mass ejections (CMEs) driven by typical filament eruptions (Lin, 2004). Sometimes, a jet recurs at the same place with the same morphology and direction of outflow, forming the so-called recurrent or homologous jets. The recurrent jets may result from recurring magnetic reconnection (Chifor et al., 2008; Innes et al., 2011; Wang & Liu, 2012; Zhang et al., 2012b; Guo et al., 2013; Chandra et al., 2015), moving magnetic features (Yang et al., 2013), continuous twisting motion of the photosphere (Pariat et al., 2010), emergence of a bipole below transequatoral loop (Jiang et al., 2013), or repeated cancellation of the pre-existing magnetic flux by the newly emerging flux (Chae et al., 1999; Chen et al., 2015; Li et al., 2015).
For the first time, Zhang & Ji (2014b) reported the discovery of recurring blobs in homologous EUV jets observed by the Atmospheric Imaging Assembly (AIA; Lemen et al., 2012) aboard the Solar Dynamics Observatory (SDO) with unprecedented temporal and spatial resolutions. Using six of the optically-thin filters (94, 131, 171, 193, 211, 335 Å) of AIA, the authors performed the Differential Emission Measure (DEM) inversion and derived the DEM profiles of the recurring blobs as a function of temperature. It is found that the bright and compact features with average size of 3 Mm are multithermal in nature with average temperature of 2.3 MK. They are ejected outwards along the jet flow at speeds of 120450 km s-1. Most of the blobs have lifetime of 2460 s before merging with the background plasma and disappearing. Such intermittent magnetic plasmoids or blobs created by magnetic reconnection have also been observed in the large-scale current sheet (CS) driven by CMEs and the small-scale CS associated with chromospheric jets (Asai et al., 2004; Lin et al., 2005; Takasao et al., 2012; Singh et al., 2012; Kumar & Cho, 2013; Lin et al., 2015). They are generally explained by the tearing-mode instability (TMI) of the thin CS where a series of magnetic islands are recurrently created during magnetic reconnection (Furth et al., 1963; Drake et al., 2006; Bárta et al., 2008; Innes et al., 2015), which makes electron acceleration more efficient and dynamic (Kliem et al., 2000). Recently, multidimensional, MHD numerical simulations of TMI have been significantly improved, thanks to the rapid advancement of powerful supercomputers. Yang et al. (2013) performed 2.5-dimensional (2.5D; ) numerical experiments to simulate the process of magnetic reconnection between the moving magnetic features and the pre-existing magnetic field. The experiments successfully reproduce the plasmoids as a result of TMI, which are consistent with the observed bright moving blobs in the chromospheric anemone jets. The plasmoids have temperatures of 0.015 MK, densities of 1.51014 cm-3, and sizes of 0.050.15 Mm. They move bidirectionally at speeds of 30 km s-1, which is close to the local Alfvén speed. After reaching the outflow regions, the plasmoids collide with the magnetic fields there and are quickly destroyed as they disappear. Using a Harris CS, Ni et al. (2015) performed 2.5D numerical simulations of magnetic reconnection in the partially ionized chromosphere by considering the radiative loss and ambipolar diffusion due to the neutral-ion collisions. The reconnection rates (0.010.03), temperature (0.08 MK), and upward outflow velocities (40 km s-1) of the plasmoids created by the plasmoid instability correspond well to their characteristic values in chromospheric jets.
Coronal jets are often associated with coronal bright points (CBPs) at their bottom (Krieger et al., 1971; Golub et al., 1974; Habbal & Withbroe, 1981; Zhang et al., 2012a; Hong et al., 2014; Alipour & Safari, 2015). As one type of long-lived (248 hr), small-scale (10′′40′′) activities with temperature (14 MK; Kariyappa et al., 2011) and density (101010 cm-3; Ugarte-Urra et al., 2005) enhancements, CBPs are also believed to be heated by magnetic reconnection in the lower corona (e.g. Priest et al., 1994; Mandrini et al., 1996; Longcope, 1998; Santos & Büchner, 2007). Likewise, the intensities of CBPs occasionally show periodic variations as a result of repeated and intermittent magnetic reconnections, with the period ranging from a few minutes to 1 hr (Strong et al., 1992; Tian et al., 2008; Kariyappa & Varghese, 2008; Zhang et al., 2012b; Ning & Guo, 2014; Samanta et al., 2015). By performing the potential-field () magnetic extrapolation, Zhang et al. (2012b) found that two neighbouring CBPs on 2007 March 16 were associated with two magnetic null points and the corresponding dome-shaped, spine-separatrix topology. Based on the magnetic configurations, they proposed that the CBP evolutions consist of quasi-periodic, impulsive flashes and gradual, weak brightening, which are caused by fast null-point reconnection and slow separatrix reconnection, respectively. Zhang et al. (2014) studied the substructures of a CBP that consisted of two lobes and showed repeated brightenings or flashes on 2009 August 2223. The two lobes brightened alternatively and the large-scale overlying coronal loop drifted in the opposite directions during the last two flashes, which is strongly indicative of interchange reconnections. The double sympathetic events to the east of the CBP with time delay of 9 minutes were further studies by Zhang & Ji (2013). The authors proposed that the likely agent of energy transport from the primary CBP to sympathetic events is thermal conduction front. However, the mechanism of jet flow could not be excluded. In this paper, we present observations of two groups of jets. The first group of six jets occurred during 16:3019:00 UT on 2014 September 10, which we call J1J6. All of these jets originated from the same primary CBP, which we call BP1. We will show that the jets flowed along closed magnetic loops. We can identify two such loops: one loop connects BP1 with another bright point, which we call BP2; the second loop connects BP1 with a different bright point, which we call BP3. The second group of jets took place during 15:5515:58 UT at the boundary of AR 11092 on 2010 August 3. The jets originated from the same primary CBP, which we call BP. We could also identify one small-scale loop that connects BP with the AR. Of particular interest is the multiple blobs in the jets. In Section \irefs-data, we describe the data analysis. Results of the two groups of jets are presented in Section \irefs-result. Discussion and summary are arranged in Section \irefs-disc and Section \irefs-sum.
2 Data analysis
s-data The jets on 2014 September 10 were observed by the Extreme-Ultraviolet Imager (EUVI) in the Sun Earth Connection Coronal and Heliospheric Investigation (SECCHI; Howard et al., 2008) package of the Solar TErrestrial RElations Observatory (STEREO; Kaiser, 2005). The ahead satellite (hereafter STA) and the behind satellite (hereafter STB) had separation angles of 167∘ and 161∘ with respect to the Sun-Earth direction. Data from STA were not available at the time of this set of jets, and these jets occurred on the far-side of the Sun from SDO. Therefore, we only observed this set of jets with STB. The four filters of EUVI (171, 195, 284, and 304 Å) have spatial resolution of 3.2′′ and cadences of 75 s, 300 s, 300 s, and 150 s, respectively. Hence, we mainly used the full-disk 171 Å and 304 Å images. Calibration of the EUVI data was performed using the standard Solar Software (SSW) program secchi_prep.pro. The deviation of STB north-south direction from the solar rotation axis was corrected. Since the intensity contrast between the jets and background quiet region was very low, we also made base-difference and running-difference images to show the jets and CBPs more clearly. The 171 Å and 304 Å images at 17:20:12 UT and 17:19:12 UT before the onset of jets are taken as the base images.
The jets on 2010 August 3 were observed by SDO/AIA in six of the EUV filters (94, 131, 171, 193, 211, 335 Å). Compared with STEREO/EUVI, AIA has much higher spatial resolution (1.2′′) and time cadence (12 s). The full-disk level_1 data were calibrated using the standard SSW program aia_prep.pro. The images in various filters were carefully co-aligned with accuracy of 0.6′′. We performed DEM inversion and studied the temperature properties of the blobs in the jets. The intensity of an optically-thin line is
| (1) |
where and stand for the minimum and maximum temperatures for the integral, represents the temperature response function of line . The definition and expression of DEM is
| (2) |
where EM stands for the total column emission measure along the LOS
| (3) |
Here, denotes the electron number density. The DEM-weighted average electron temperature along the LOS is
| (4) |
Since the jets were at the AR boundary, background subtraction should be conducted. We took the EUV images at 15:52 UT before the jets as base images and derived the base-difference images during the jets. We carried out DEM reconstructions using the base-difference intensities of the blobs in the six filters and the same program as in Zhang & Ji (2014b). To evaluate the uncertainties of the reconstructed DEM curves, 100 Monte Carlo (MC) simulations were conducted for each inversion (Cheng et al., 2012). The observational parameters are summarized in Table \ireftbl1.
| Date | Time | Instrument | Cadence | Pixel size | Location | |
|---|---|---|---|---|---|---|
| (UT) | (Å) | (second) | (arcsec) | |||
| 2014/09/10 | 16:3019:00 | STB/EUVI | 171 | 75 | 1.6 | backside |
| 2014/09/10 | 16:3019:00 | STB/EUVI | 304 | 150 | 1.6 | backside |
| 2014/09/10 | 16:3019:00 | STB/EUVI | 195, 284 | 300 | 1.6 | backside |
| 2010/08/03 | 15:5515:58 | SDO/AIA | 94335 | 12 | 0.6 | AR 11092 |
3 Results
s-result
3.1 Jets on 2014 September 10
s-910 Figure \ireffig1 shows the EUV images observed in 171 Å, 195 Å, 284 Å, and 304 Å when J2 took place. It is clear that the weak, slim jet was ejected in the northeast direction from BP1 located at (-130′′, 260′′) in the quiet region. Due to the impulsive nature of the jet and the low cadence of 284 Å, the jet was absent in 284 Å with formation temperature of 2 MK. Nevertheless, bright coronal loops are evident in 284 Å. The rectangular dashed box with size of in panel (d) represents the field-of-view (FOV) of the panels in Figures \ireffig2\ireffig7.
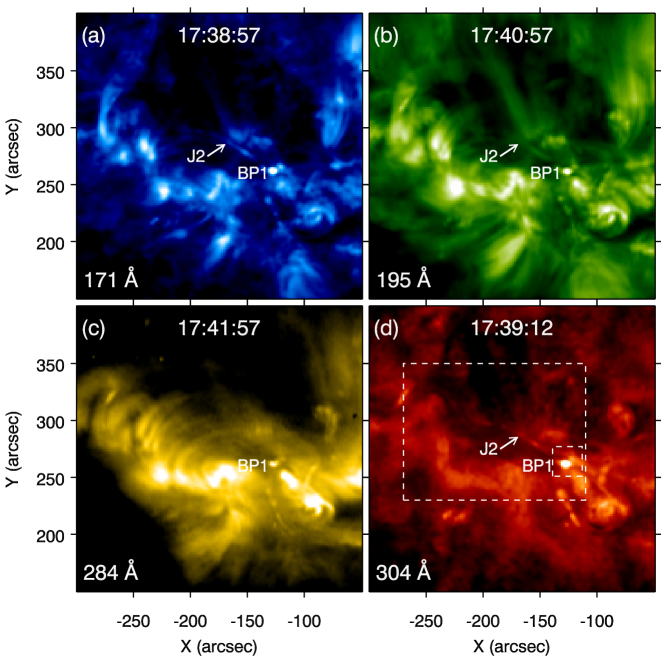
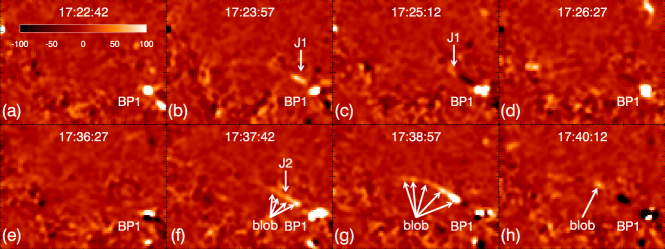
Figure \ireffig2 shows eight snapshots of the 171 Å running-difference images during J1 and J2. With the brightness of BP1 increasing, the jet (J1) was ejected outwards from BP1 in the northeast direction (see panel (b)). After 17:36 UT, J2 occurred at the same place. Interestingly, we find bright and compact features in J2. Four and five such features are identified by eye at 17:37:42 UT and 17:38:57 UT as pointed by the white arrows. In view of the extraordinary resemblance to the blobs reported by Zhang & Ji (2014b), we also take the features as blobs. The discrete, circular or elliptical blobs with sizes of 4.57.5 Mm moved along the jets, like sliding pearls along a necklace.
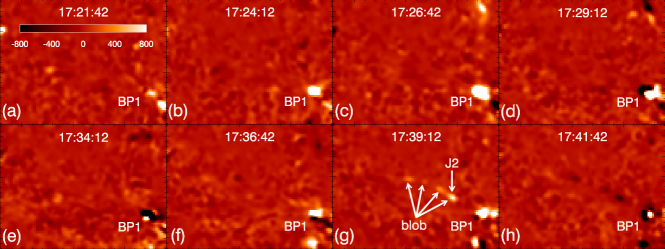
The 304 Å running-difference images during J1 and J2 are displayed in Figure \ireffig3. Due to the short lifetime of J1 and the low cadence of 304 Å, J1 was hardly identified. However, multiple blobs are distinct in 304 Å at 17:39:12 UT, as pointed by the white arrows, which is consistent with those in Figure \ireffig2(g).
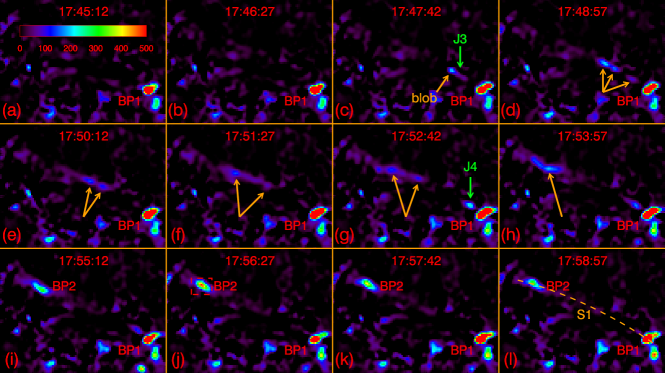
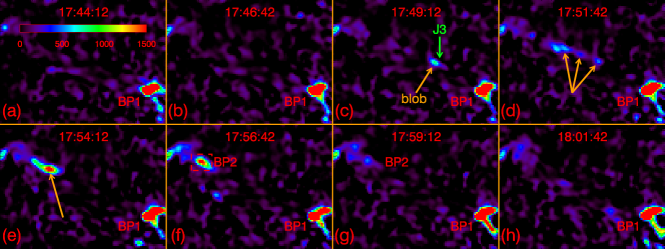
Figure \ireffig4 shows the 171 Å base-difference images during J3 and J4. Starting from 17:47 UT, the jet (J3) propagated in the northeast direction from BP1 and terminated at BP2 about 9 minutes later (see panel (j)). BP2 is located at (-237′′, 314′′), which is 120′′ away from BP1. Afterwards, the brightness of BP2 decreased gradually until it disappeared. Like J2, J3 is not coherent. It consists of blobs propagating along the jet, as pointed by the yellow arrows in panels (c)(h). The sizes of the blobs range from 6.5 Mm to 8.0 Mm. The short J4 appeared at 17:52 UT and disappeared at 17:57 UT. The 304 Å base-difference images during J3 and J4 are presented in Figure \ireffig5. Similar to Figure \ireffig4, the blobs propagated along J3 and stopped at BP2, as indicated by the yellow arrows in panels (c)(e).
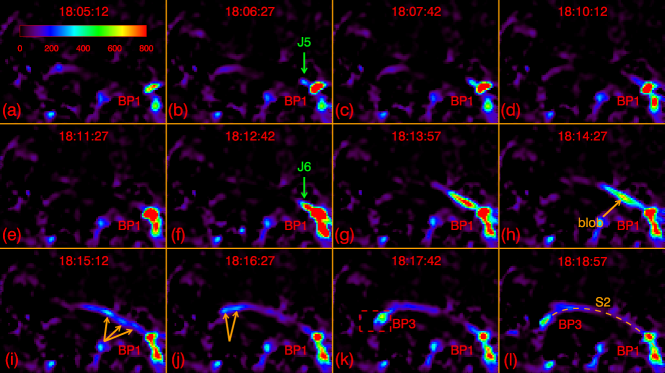
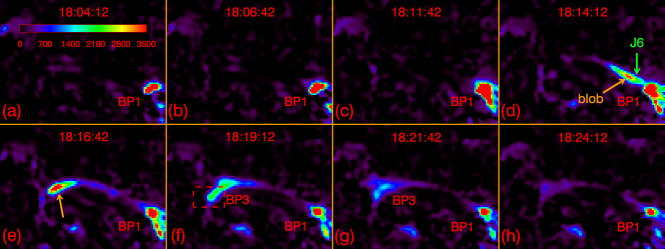
Figure \ireffig6 shows the 171 Å base-difference images during J5 and J6. The short jet (J5) was ejected out of BP1 in the northeast direction after 18:06 UT, as pointed by the green arrows in panel (b). After 18:12 UT, J6 spurted from BP1 in the same direction and propagated to BP3, which is located at (-230′′, 280′′) and is 105′′ away from BP1. Afterwards, the intensity of BP3 decreased gradually and finally it disappeared. Note that the trajectory of J6 is close to that of J3 in the initial phase, but different at the ending phase, though both J3 and J6 produced remote brightening at the other end of large-scale coronal loops. Likewise, multiple blobs are recognized in J6 by eye, as indicated by the yellow arrows in panels (h)(j). Figure \ireffig7 shows the 304 Å base-difference images during J5 and J6. J5 is not obvious in 304 Å due to the low cadence. However, J6 is very clear with blobs at 18:14:12 UT and 18:16:42 UT. Table \ireftbl2 summarizes the informations of the homologous jets, including the wavelengths of observation (), begin times in 171 Å, end times in 171 Å, lifetimes, apparent lengths, apparent velocities, and connected CBP.
| Jet | Lifetime | Length | Velocity | CBP | |||
|---|---|---|---|---|---|---|---|
| (Å) | (UT) | (UT) | (s) | (arcsec) | (km s-1) | ||
| J1 | 171 | 17:23:57 | 17:26:27 | 15075 | 26.21.6 | 14515 | - |
| J2 | 171, 304 | 17:37:42 | 17:41:27 | 22575 | 50.71.6 | 2038 | - |
| J3 | 171, 304 | 17:47:42 | 17:53:57 | 37575 | 124.61.6 | 38118 | BP2 |
| J4 | 171 | 17:52:42 | 17:56:27 | 22575 | 28.81.6 | 17513 | - |
| J5 | 171 | 18:06:27 | 18:11:27 | 30075 | 16.71.6 | 22234 | - |
| J6 | 171, 304 | 18:12:42 | 18:18:57 | 37575 | 108.21.6 | 2493 | BP3 |
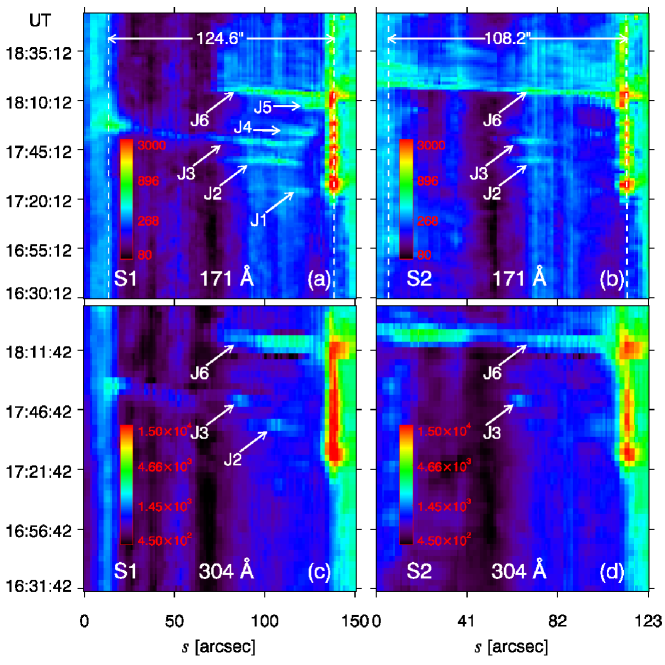
In order to investigate the temporal evolution of the jets, we extract two curved slices. The first slice (S1) is superposed on Figure \ireffig4(l) with yellow dashed line, which passes through BP1 and BP2. The second slice (S2) is superposed on Figure \ireffig6(l) with yellow dashed line, which passes through BP1 and BP3. The time-slice diagrams of S1 and S2 in 171 Å and 304 Å are illustrated in Figure \ireffig8. The and axes denote the distances from the left endpoints of the slices and the time (UT) in each panel. In panel (a), the homologous jets (J1J6) are represented by the the bright and inclined structures whose inverses of slope stand for their apparent speeds, being 14515, 2038, 38118, 17513, 22234, and 2247 km s-1, respectively. It is clear that J3 propagates along S1 and reaches the left endpoint of S1, producing the sympathetic CBP, i.e., BP2 around 17:56 UT. In panel (b), only J2, J3, and J6 whose maximum apparent lengths are longer than J1, J4, and J5 are evident. J6 propagates along S2 and reaches the left endpoint of S2, producing the sympathetic CBP, i.e., BP3 around 18:17 UT. The more accurate apparent speed of J6 derived from panel (b) is 2493 km s-1. Owing to the low cadence of the 304 Å filter, only some of the jets (J2, J3, and J6) are clearly identified (see panels (c)(d)). The intervals of the recurrent jets range from 5 to 15 minutes.
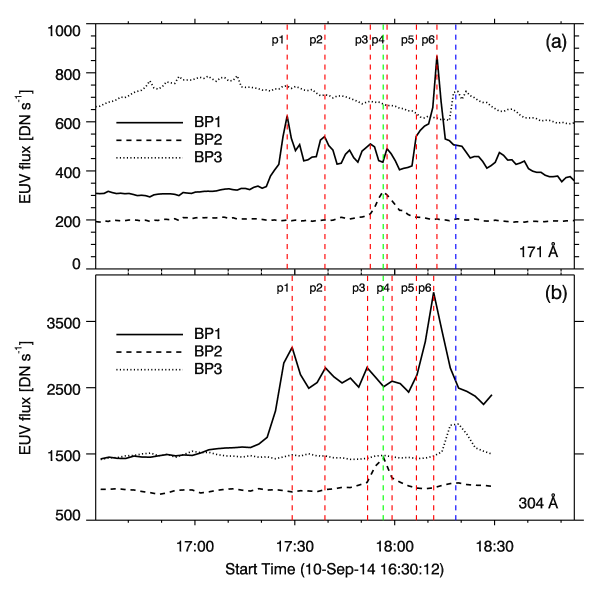
In Figure \ireffig9, we plot the light curves of BP1, BP2, and BP3 in 171 Å and 304 Å with solid, dashed, and dotted lines, respectively. The light curves are calculated to be the average intensities of BP1, BP2, and BP3 in the small box of Figure \ireffig1(d), Figure \ireffig4(j), and Figure \ireffig6(k). During 17:2018:30 UT, BP1 experiences several flashes, whose peak times (p1p6) are labeled with red dashed line. The last flash is the strongest, which is similar to the case of CBP on 2009 August 2223 observed in SXR (Zhang et al., 2014). The intensities of BP2 increase slowly from 17:40 UT and rapidly from 17:50 UT before reaching the maxima at 17:56:30 UT. Afterwards, they decrease to the initial levels at 18:10 UT. The lifetime of BP2 is 27.52.5 minutes. Since BP1 reaches the third peak (p3) at 17:52:30 UT, the time delay between BP2 and BP1 is 24075 s. The intensities of BP3 increase from 18:13:30 UT and reach the maxima at 18:17:30 UT before declining to the initial levels at 18:43 UT. The lifetime of BP3 is 27.42.5 minutes. Considering that the peak time of the sixth flash of BP1, i.e. p6, is 18:12:30 UT, the time delay between BP3 and BP1 is 30075 s.
3.2 Jets on 2010 August 3
s-803
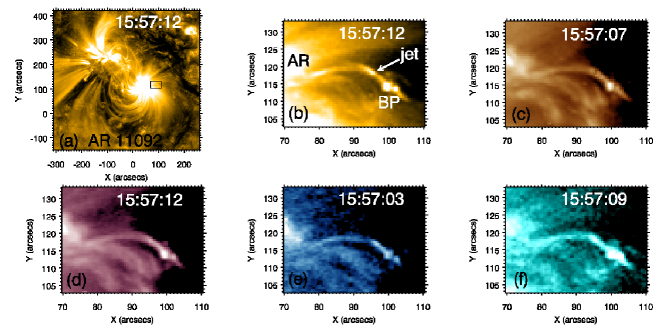
In Figure \ireffig10, the 171 Å image of the AR 11092 at 15:57:12 UT is shown in panel (a). The jets were located at the western AR boundary in the black rectangular box (). In panels (b)-(f), we plot the EUV images of the jets observed in 171, 193, 211, 335, and 131 Å around 15:57 UT. It is clear that the jets originated from the bright point (BP) and propagated in the northeast direction along the small-scale closed loop that is 28 Mm in length before flowing into the AR. The bright jets with enhanced emission measure were observed in all the EUV filters, though we show the jets only in five filters.
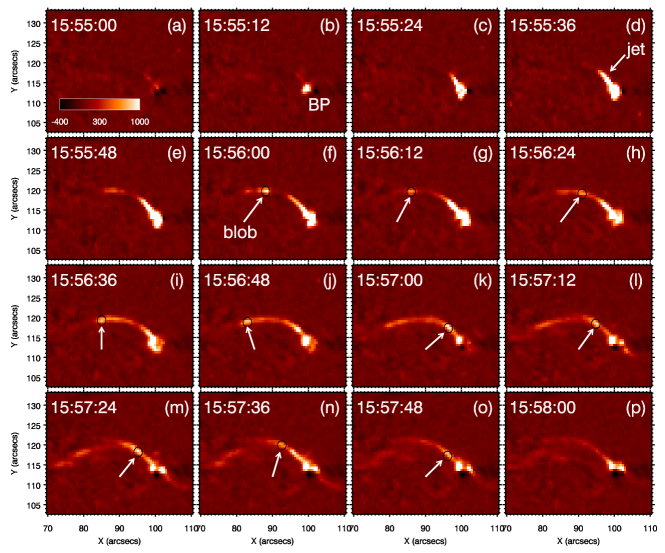
Compared with the first group of jets, the second group was short-lived. The whole evolution is displayed in the 171 Å base-difference images of Figure \ireffig11. The jet started at 15:55 UT and moved in the northeast direction, with the intensity of BP at the bottom increasing. Interestingly, the jet was not coherent and smooth. Instead, there were bright and compact structures similar to the blobs in the jets observed by EUVI. In panels (f)-(o), we encircle the blobs with black circles that are 2.4′′ in diameter. The blob appeared at 15:56:00 UT (panel (f)) and propagated along the closed loop for 12 s. A new blob appeared at 15:56:24 UT (panel (h)) and lasted until 15:56:48 UT (panel (j)). The velocity of this blob is calculated to be 238 km s-1. Then, another blob appeared close to the BP and flowed forward until 15:57:12 UT (panel (l)). Afterwards, three blobs were identified during the late phase of evolution. As the brightness of BP decreased slowly, the jet faded and disappeared. Since the jets flowed into the AR, sympathetic CBPs were not observed at the remote footpoint of the loop.
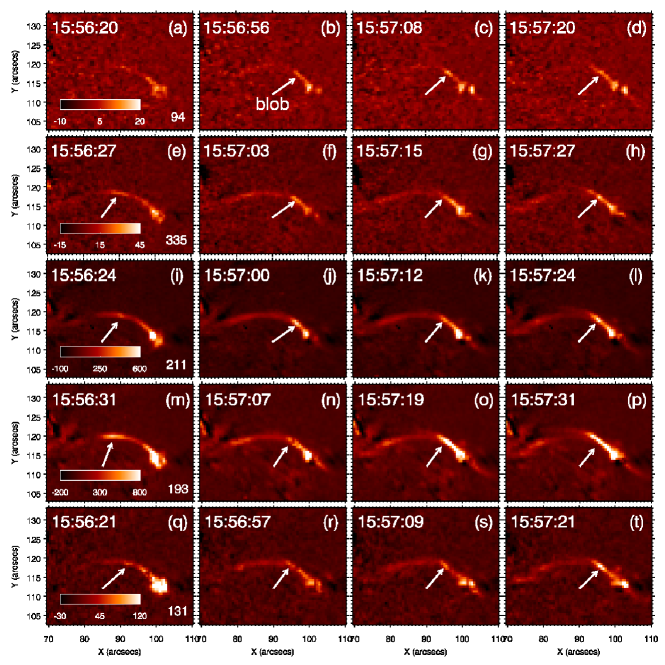
The blobs were visible not only in 171 Å, but also in the other wavelengths. In Figure \ireffig12, the base-difference images in 94, 335, 211, 193, and 131 Å are shown from top to bottom row, with the blobs being indicated by the white arrows. In each column, the observing times are very close. As in 171 Å, the blobs are bright and compact features in the closed loop. It should be noted that a blob is not always evident and striking in all the wavelengths. The presence of blobs in multiple wavelengths suggests their multithermal nature.
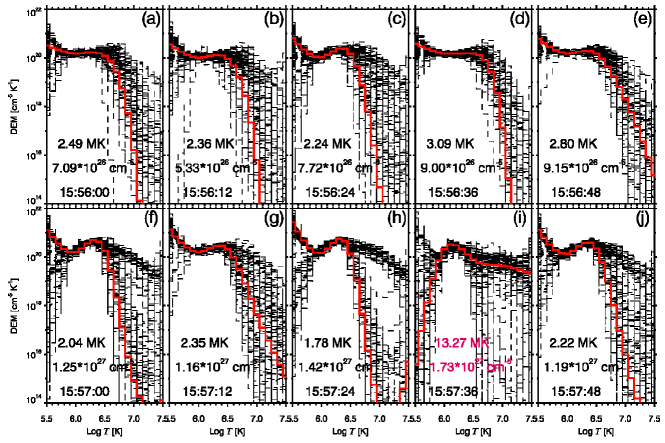
In order to study the temperature properties of the blobs, we performed DEM reconstructions as described in Sect. \irefs-data. Figure \ireffig13 shows the DEM profiles of the ten blobs as indicated by the arrows in Figure \ireffig11(f)-(o). The red solid lines stand for the best-fitted DEM curves from the observed values, while the black dashed lines represent the reconstructed curves from the 100 MC simulations. Except the ninth one, all the profiles have similar shapes in the range of , with most of the emissions coming from the low-temperature plasma. The uncertainties of the DEM curves are minimum in the range of and increase significantly towards the low-temperature and high-temperature ends. The calculated EM of the blobs ranges from 51026 cm-5 to 1.41027 cm-5. Assuming that the LOS depths of the blobs equal to the widths, i.e., 2.4′′, the electron number densities of the blobs are estimated to be (1.72.8) cm-3. The calculated of the blobs ranges from 1.8 MK to 3.1 MK except the ninth one, and most of them are between 2 MK and 3 MK.
4 Discussions
s-disc So far, studies of plasmoids or blobs in coronal jets are few. Using the multiwavelength observations of AIA on 2011 July 22, Zhang & Ji (2014b) studied the recurring blobs. In this paper, we provide additional evidences of multiple, recurring blobs in the homologous jets. The first group was observed by STB/EUVI and the second group was observed by AIA. In Table \ireftbl3, we compare the parameters of the blobs. On one hand, the measured sizes of the blobs observed by EUVI are 25 times larger than those observed by AIA. Considering that the resolution of EUVI is lower than that of AIA, the blobs observed by EUVI may not be fully resolved and the obtained blob sizes with large uncertainties may not be reliable. On the other hand, both the sizes of blobs and CBP at the bottom on 2010 August 3 are about two times smaller than those for the event on 2011 July 22. In chromospheric anemone jets, the sizes of blobs (0.31.5 Mm) as well as the base loops are even smaller (Singh et al., 2012), implying that the same process may exist in different scales in the solar atmosphere. The lifetime of the blobs in coronal jets observed by AIA ranges from 12 s to 60 s, which is similar to the typical value of chromospheric blobs (Singh et al., 2012). The apparent speeds of the blobs in the order of coronal Alfvén speed, i.e., hundreds of km s-1, are consistent in the FOVs of AIA and EUVI. For the events observed by AIA, the DEM-weighted average temperatures of the blobs agree with each other, suggesting that the method of inversion we use is correct. Besides, the DEM profiles are similar. The possible causes of problematic result of inversion for the ninth blob in Figure \ireffig13(i) and large uncertainties of all the profiles at the low-temperature and high-temperature ends are as follows. 1) The intensities of the blobs are not strong enough, i.e, the signal-to-noise ratios are not high enough. 2) The observing times of the six filters for inversion are not exactly the same. Therefore, the positions of the blobs may be misplaced more or less even though we take the AIA images at the nearest times. Assuming that the velocity of a blob is 200 km s-1, the maximum displacement of the blob in the EUV images is 1.6 Mm, which is close to the size of blobs. In this regard, multiwavelength observations with much higher cadence are required in the future. The rough estimations of the number density of blobs are also in the same range on the assumption that the LOS depth equals to the width or size. Despite that the jets along open magnetic fields are prevailing, reports on the observations of coronal jets along closed loops are few (Zhang & Ji, 2013; Zhang et al., 2014). The blobs in jets associated with both open and closed magnetic fields indicate that this kind of bright and compact structures are ubiquitous. According to the previous theoretical and numerical studies (e.g., Furth et al., 1963; Drake et al., 2006; Bárta et al., 2008), the blobs are most probably plasmoids created by the TMI of the CS where magnetic reconnection takes place.
| Date | Instr. | Size | Lifetime | Velocity | Mag. Field | ||
|---|---|---|---|---|---|---|---|
| (Mm) | (second) | (km s-1) | (MK) | (109 cm-3) | |||
| 2011/07/22\tabnoteEvent studied by Zhang & Ji (2014b) | AIA | 3 | 2460 | 120450 | 0.54.0 | 1.5 | open |
| 2010/08/03 | AIA | 1.7 | 2412 | 238 | 1.83.1 | 1.72.8 | closed |
| 2014/09/10 | EUVI | 4.59.0 | - | 140380 | - | - | closed |
Sympathetic phenomena are common in the solar atmosphere because of the complexity and interconnection of the magnetic field lines. Sympathetic flares have been extensively reported and investigated in the past decades (e.g. Hanaoka, 1996; Lang & Willson, 1989; Masson et al., 2009; Wang & Liu, 2012; Deng et al., 2013; Sun et al., 2013; Yang et al., 2014; Liu et al., 2015a). The possible agents of energy transported from the source region of energy release to the remote footpoints are nonthermal electrons (Tang & Moore, 1982; Nakajima et al., 1985; Martin & Svestka, 1988), thermal conduction front (Rust et al., 1985; Bastian & Gary, 1992), shock waves (Machado et al., 1988), and reconnection outflows (Hanaoka, 1996; Nishio et al., 1997). In a cartoon model, Machado et al. (1988) compared the velocities of different agents, among which nonthermal electrons have the fastest speed (about one third of the speed of light). The electrons are followed by thermal conduction, plasma shock, and evaporated material. Therefore, the time delays between the start/peak times of the main and sympathetic events are different for different energy agents. In the rare case of double sympathetic events studied by Zhang & Ji (2013), the time delays between BP1 and BP2 (BP3) are less than 9 minutes. The authors proposed that thermal conduction plays a role in the energy transport. Nevertheless, it is not easy to distinguish thermal conduction and jet flow in observation. In this study, the jets (J3 and J6) reached the remote footpoints of the pre-existing, large-scale coronal loops and produced sympathetic CBPs (BP2 and BP3) observed in 171 Å and 304 Å. The pre-existing loops may have lower electron number density and emission measure so that they are not clearly revealed in 284 Å before the jets. The time delays between BP1 and BP2 (BP3) are approximately 24075 s (30075 s). Considering that the lengths of the coronal loops between BP1 and BP2 (BP3) are 124.6′′ and 108.2′′ as indicated in the upper panels of Figure \ireffig8, the velocities of the energy transport are estimated to be 376.4 and 261.5 km s-1, which are consistent with the apparent velocities of J3 and J6. On one hand, the transit times of the nonthermal electrons from BP1 to BP2 and BP3 are 1 s, which are significantly shorter than the observed time delays. On the other hand, thermal conduction timescales of the coronal loops are , where , , and represent the number density of the jets, temperature of the jets, and length of the loops (Cargill, 1994). Assuming that cm-3 and MK, the values of between BP1 and BP2 (BP3) are estimated to be 5770 s (4351 s), which are much longer than the observed values. If the thermal conduction front really plays a dominant role, the temperatures of BP1 and jets should be 67 MK in the case of cm-3, which seems to be unlikely because the response of the 171 Å filter decreases from the maximum value by 34 orders of magnitude at such high temperature. Interestingly, we identified multiple and recurring blobs in the jet flows, which is in favor of the jet flow rather than thermal conduction front to be the most probable energy agent because conduction front should result in smooth brightenings rather than clumpy brightenings.
5 Summary
s-sum
In this paper, we report our multiwavelength observations of two groups of homologous jets. The first was observed by STB/EUVI on 2014 September 10 and the second was observed by SDO/AIA on 2010 August 3. The main results are summarized as follows:
-
1.
The first group of recurring jets originated from BP1 and propagated in the northeast direction along large-scale, closed coronal loops during the six eruptions (J1J6). The intervals of the recurrent jets range from 5 to 15 minutes. Two of the jets (J3 and J6) produced sympathetic CBPs (BP2 and BP3) after reaching the remote footpoints of the loops. The peak times of the sympathetic CBPs were delayed by 240300 s relative to BP1.
-
2.
The jets were not coherent. Instead, they were composed of bright and compact structures, i.e., blobs. The sizes and apparent velocities of the blobs are 4.59 Mm and 140380 km s-1, respectively. The existence of multiple blobs in the jets suggests that the sympathetic CBPs are caused by jet flows rather than thermal conduction front.
-
3.
The second group of jets originated from BP and propagated in the northeast direction along a small-scale, closed coronal loop at the boundary of AR 11092. Sympathetic CBPs were not observed at the remote footpoint of the loop (although it is possible that the remote footpoint was hidden in the glare of the AR). Like the first group, we also identified blobs in the jets. The sizes and apparent velocities of the blobs are 1.7 Mm and 238 km s-1, respectively.
-
4.
Using the AIA base-difference EUV images, we performed DEM inversions and derived the DEM profiles of the blobs. The blobs are multithermal with temperatures of 1.83.1 MK. The estimated number density of the blobs are (1.72.8)109 cm-3. Additional case studies with high resolution and cadence are expected in the future. Multidimensional MHD simulations are underway to investigate the nature of plasmoids and mechanism of sympathetic CBPs.
Acknowledgments
The authors acknowledge the referee for detailed comments and valuable suggestions. We are also grateful to E. Pariat, L. Ni, T. Li, Y. H. Yan, S. L. Ma, P. F. Wyper, C. R. DeVore, and P. Syntelis for constructive discussions. STEREO/SECCHI data are provided by a consortium of US, UK, Germany, Belgium, and France. SDO is a mission of NASA’s Living With a Star Program. AIA data are courtesy of the NASA/SDO science teams. QMZ is supported by NSFC No. 11303101, 11333009, and 11473071. H. S. Ji is supported by the Strategic Priority Research ProgramThe Emergence of Cosmological Structures of the CAS, Grant No. XDB09000000. Yingna Su is supported by NSFC 11473071, Youth Fund of Jiangsu BK20141043, and the One Hundred Talent Program of Chinese Academy of Sciences.
References
- Alipour & Safari (2015) Alipour, N., & Safari, H. 2015, ApJ, 807, 175
- Archontis & Hood (2013) Archontis, V., & Hood, A. W. 2013, ApJ, 769, LL21
- Asai et al. (2004) Asai, A., Yokoyama, T., Shimojo, M., & Shibata, K. 2004, ApJ, 605, L77
- Bárta et al. (2008) Bárta, M., Vršnak, B., & Karlický, M. 2008, A&A, 477, 649
- Bastian & Gary (1992) Bastian, T. S., & Gary, D. E. 1992, Sol. Phys., 139, 357
- Cargill (1994) Cargill, P. J. 1994, ApJ, 422, 381
- Chae et al. (1999) Chae, J., Qiu, J., Wang, H.,& Goode, P. R. 1999, ApJ, 513, L75
- Chandra et al. (2015) Chandra, R., Gupta, G. R., Mulay, S., & Tripathi, D. 2015, MNRAS, 446, 3741
- Chen et al. (2012) Chen, H. D., Zhang, J., & Ma, S. L. 2012, Research in Astronomy and Astrophysics, 12, 573
- Chen et al. (2015) Chen, J., Su, J., Yin, Z., et al. 2015, ApJ, 815, 71
- Cheng et al. (2012) Cheng, X., Zhang, J., Saar, S. H., & Ding, M. D. 2012, ApJ, 761, 62
- Chifor et al. (2008) Chifor, C., Isobe, H., Mason, H. E., et al. 2008, A&A, 491, 279
- Cirtain et al. (2007) Cirtain, J. W., Golub, L., Lundquist, L., et al. 2007, Science, 318, 1580
- Culhane et al. (2007) Culhane, L., Harra, L. K., Baker, D., et al. 2007, PASJ, 59, 751
- Deng et al. (2013) Deng, N., Tritschler, A., Jing, J., et al. 2013, ApJ, 769, 112
- Drake et al. (2006) Drake, J. F., Swisdak, M., Che, H., & Shay, M. A. 2006, Nature, 443, 553
- Fang et al. (2014) Fang, F., Fan, Y.,& McIntosh, S. W. 2014, ApJ, 789, LL19
- Furth et al. (1963) Furth, H. P., Killeen, J.,& Rosenbluth, M. N. 1963, Physics of Fluids, 6, 459
- Golub et al. (1974) Golub, L., Krieger, A. S., Silk, J. K., Timothy, A. F., & Vaiana, G. S. 1974, ApJ, 189, L93
- Guo et al. (2013) Guo, Y., Démoulin, P., Schmieder, B., et al. 2013, A&A, 555, AA19
- Habbal & Withbroe (1981) Habbal, S. R., & Withbroe, G. L. 1981, Sol. Phys., 69, 77
- Hanaoka (1996) Hanaoka, Y. 1996, Sol. Phys., 165, 275
- Hong et al. (2013) Hong, J.-C., Jiang, Y.-C., Yang, J.-Y., et al. 2013, Research in Astronomy and Astrophysics, 13, 253
- Hong et al. (2014) Hong, J., Jiang, Y., Yang, J., et al. 2014, ApJ, 796, 73
- Howard et al. (2008) Howard, R. A., Moses, J. D., Vourlidas, A., et al. 2008, Space Sci. Rev., 136, 67
- Heyvaerts et al. (1977) Heyvaerts, J., Priest, E. R., & Rust, D. M. 1977, ApJ, 216, 123
- Innes et al. (2011) Innes, D. E., Cameron, R. H., & Solanki, S. K. 2011, A&A, 531, L13
- Innes et al. (2015) Innes, D. E., Guo, L.-J., Huang, Y.-M., & Bhattacharjee, A. 2015, ApJ, 813, 86
- Jiang et al. (2013) Jiang, Y., Bi, Y., Yang, J., et al. 2013, ApJ, 775, 132
- Kaiser (2005) Kaiser, M. L. 2005, Advances in Space Research, 36, 1483
- Kariyappa et al. (2011) Kariyappa, R., Deluca, E. E., Saar, S. H., et al. 2011, A&A, 526, AA78
- Kariyappa & Varghese (2008) Kariyappa, R., & Varghese, B. A. 2008, A&A, 485, 289
- Kliem et al. (2000) Kliem, B., Karlický, M., & Benz, A. O. 2000, A&A, 360, 715
- Krieger et al. (1971) Krieger, A. S., Vaiana, G. S., & van Speybroeck, L. P. 1971, Solar Magnetic Fields, 43, 397
- Kumar & Cho (2013) Kumar, P., & Cho, K.-S. 2013, A&A, 557, AA115
- Lang & Willson (1989) Lang, K. R., & Willson, R. F. 1989, ApJ, 344, L77
- Lemen et al. (2012) Lemen, J. R., Title, A. M., Akin, D. J., et al. 2012, Sol. Phys., 275, 17
- Li et al. (2015) Li, H. D., Jiang, Y. C., Yang, J. Y., Bi, Y., & Liang, H. F. 2015, Ap&SS, 359, 44
- Lim et al. (2015) Lim, E.-K., Yurchyshyn, V., Park, S.-H., et al. 2015, arXiv:1512.01330
- Lin (2004) Lin, J. 2004, Sol. Phys., 219, 169
- Lin et al. (2005) Lin, J., Ko, Y.-K., Sui, L., et al. 2005, ApJ, 622, 1251
- Lin et al. (2015) Lin, J., Murphy, N. A., Shen, C., et al. 2015, Space Sci. Rev., 102
- Liu et al. (2015a) Liu, C., Deng, N., Liu, R., et al. 2015a, ApJ, 812, L19
- Liu et al. (2015b) Liu, J., Wang, Y., Shen, C., et al. 2015b, ApJ, 813, 115
- Longcope (1998) Longcope, D. W. 1998, ApJ, 507, 433
- Machado et al. (1988) Machado, M. E., Xiao, Y. C., Wu, S. T., Prokakis, T., & Dialetis, D. 1988, ApJ, 326, 451
- Mandrini et al. (1996) Mandrini, C. H., Démoulin, P., van Driel-Gesztelyi, L., et al. 1996, Sol. Phys., 168, 115
- Martin & Svestka (1988) Martin, S. F., & Svestka, Z. F. 1988, Sol. Phys., 116, 91
- Masson et al. (2009) Masson, S., Pariat, E., Aulanier, G., & Schrijver, C. J. 2009, ApJ, 700, 559
- Moore et al. (2010) Moore, R. L., Cirtain, J. W., Sterling, A. C., & Falconer, D. A. 2010, ApJ, 720, 757
- Moore et al. (2013) Moore, R. L., Sterling, A. C., Falconer, D. A., & Robe, D. 2013, ApJ, 769, 134
- Moreno-Insertis et al. (2008) Moreno-Insertis, F., Galsgaard, K., & Ugarte-Urra, I. 2008, ApJ, 673, L211
- Moreno-Insertis & Galsgaard (2013) Moreno-Insertis, F., & Galsgaard, K. 2013, ApJ, 771, 20
- Morton et al. (2012) Morton, R. J., Srivastava, A. K., & Erdélyi, R. 2012, A&A, 542, A70
- Nakajima et al. (1985) Nakajima, H., Dennis, B. R., Hoyng, P., et al. 1985, ApJ, 288, 806
- Ni et al. (2015) Ni, L., Kliem, B., Lin, J., & Wu, N. 2015, ApJ, 799, 79
- Ning & Guo (2014) Ning, Z., & Guo, Y. 2014, ApJ, 794, 79
- Nishio et al. (1997) Nishio, M., Yaji, K., Kosugi, T., Nakajima, H., & Sakurai, T. 1997, ApJ, 489, 976
- Nisticò et al. (2015) Nisticò, G., Zimbardo, G., Patsourakos, S., Bothmer, V., & Nakariakov, V. M. 2015, A&A, 583, A127
- Paraschiv et al. (2015) Paraschiv, A. R., Bemporad, A., & Sterling, A. C. 2015, A&A, 579, A96
- Pariat et al. (2009) Pariat, E., Antiochos, S. K., & DeVore, C. R. 2009, ApJ, 691, 61
- Pariat et al. (2010) Pariat, E., Antiochos, S. K., & DeVore, C. R. 2010, ApJ, 714, 1762
- Priest et al. (1994) Priest, E. R., Parnell, C. E., & Martin, S. F. 1994, ApJ, 427, 459
- Pucci et al. (2013) Pucci, S., Poletto, G., Sterling, A. C., & Romoli, M. 2013, ApJ, 776, 16
- Rust et al. (1985) Rust, D. M., Simnett, G. M., & Smith, D. F. 1985, ApJ, 288, 401
- Santos & Büchner (2007) Santos, J. C., & Büchner, J. 2007, Astrophysics and Space Sciences Transactions, 3, 29
- Samanta et al. (2015) Samanta, T., Banerjee, D., & Tian, H. 2015, ApJ, 806, 172
- Schmieder et al. (2013) Schmieder, B., Guo, Y., Moreno-Insertis, F., et al. 2013, A&A, 559, A1
- Shen et al. (2011) Shen, Y., Liu, Y., Su, J., & Ibrahim, A. 2011, ApJ, 735, L43
- Shibata et al. (1992) Shibata, K., Ishido, Y., Acton, L. W., et al. 1992, PASJ, 44, L173
- Shimojo et al. (1996) Shimojo, M., Hashimoto, S., Shibata, K., et al. 1996, PASJ, 48, 123
- Shimojo & Shibata (2000) Shimojo, M. & Shibata, K. 2000, ApJ, 542, 1100
- Singh et al. (2012) Singh, K. A. P., Isobe, H., Nishizuka, N., Nishida, K., & Shibata, K. 2012, ApJ, 759, 33
- Sterling et al. (2015) Sterling, A. C., Moore, R. L., Falconer, D. A., & Adams, M. 2015, Nature, 523, 437
- Strong et al. (1992) Strong, K. T., Harvey, K., Hirayama, T., et al. 1992, PASJ, 44, L161
- Sun et al. (2013) Sun, X., Hoeksema, J. T., Liu, Y., et al. 2013, ApJ, 778, 139
- Takasao et al. (2012) Takasao, S., Asai, A., Isobe, H., & Shibata, K. 2012, ApJ, 745, LL6
- Tang & Moore (1982) Tang, F., & Moore, R. L. 1982, Sol. Phys., 77, 263
- Tian et al. (2008) Tian, H., Xia, L.-D., & Li, S. 2008, A&A, 489, 741
- Ugarte-Urra et al. (2005) Ugarte-Urra, I., Doyle, J. G., & Del Zanna, G. 2005, A&A, 435, 1169
- Wang & Liu (2012) Wang, H., & Liu, C. 2012, ApJ, 760, 101
- Wyper & DeVore (2015) Wyper, P. F., & DeVore, C. R. 2015, arXiv:1509.07901
- Yang et al. (2013) Yang, L., He, J., Peter, H., et al. 2013, ApJ, 777, 16
- Yang et al. (2014) Yang, S., Zhang, J., & Xiang, Y. 2014, ApJ, 793, L28
- Yokoyama & Shibata (1996) Yokoyama, T., & Shibata, K. 1996, PASJ, 48, 353
- Zhang et al. (2012a) Zhang, P., Fang, C., & Zhang, Q. 2012, Science China Physics, Mechanics, and Astronomy, 55, 907
- Zhang et al. (2012b) Zhang, Q. M., Chen, P. F., Guo, Y., Fang, C., & Ding, M. D. 2012, ApJ, 746, 19
- Zhang & Ji (2013) Zhang, Q. M., & Ji, H. S. 2013, A&A, 557, LL5
- Zhang & Ji (2014a) Zhang, Q. M., & Ji, H. S. 2014a, A&A, 561, AA134
- Zhang & Ji (2014b) Zhang, Q. M., & Ji, H. S. 2014b, A&A, 567, AA11
- Zhang et al. (2014) Zhang, Q. M., Chen, P. F., Ding, M. D., & Ji, H. S. 2014, A&A, 568, AA30