Ultrafast optical control of the electronic properties of
Abstract
We report on the temperature dependence of the electronic properties, studied at equilibrium and out of equilibrium, by means of time and angle resolved photoelectron spectroscopy (tr-ARPES). Our results unveil the dependence of the electronic band structure across the Fermi energy on the sample temperature. This finding is regarded as the dominant mechanism responsible for the anomalous resistivity observed at K along with the change of the charge carrier character from hole-like to electron-like. Having addressed these long-lasting questions, we prove the possibility to control, at the ultrashort time scale, both the binding energy and the quasiparticle lifetime of the valence band. These experimental evidences pave the way for optically controlling the thermo-electric and magneto-electric transport properties of .
Transition metal pentatelluride, , displays a rich set of unique and exotic transport properties, that make this material an emerging candidate for magnetic and thermoelectric devices Sambongi (1986); Tritt and IV (2001). The complexity of the electronic properties became clear since its first synthesis in 1973 Furuseth et al. (1973). The thermopower changes sign from positive to negative when cooling down across Jones et al. (1982), meanwhile the resistivity increases by a factor Skelton et al. (1982), and the charge carrier switches from holes, at , to electrons, for Izumi et al. (1982). Several models have been proposed to interpret these transport properties, based on charge density wave Jones et al. (1982) or polaron Rubinstein (1999) formation, but so far not supported by direct experimental evidences DiSalvo et al. (1981); Okada et al. (1982).
The discovery of large magnetoresistance, with both positive Tritt et al. (1999) and, more surprisingly, negative sign Li et al. (2015), has proved that the magnetic and electronic transport properties are tightly connected in . These findings have been recently regarded as a sign of chiral magnetic effect, possible in the case of 3D Dirac semimetal Li et al. (2015); Moll et al. (2015); Chen et al. (2015a, b). Furthermore, exhibits a superconducting state under pressure Zhou et al. (2015) while spin helical surface states have also been predicted Weng et al. (2014); Hasan and Kane (2010). All together these properties require further thorough investigations of the physical properties of this material, with particular attention to the interplay between temperature and electronic structure, with the aim to clarify the still unknown origin of the resistivity anomaly.
In this letter, by combining angle resolved photoelectron spectroscopy (ARPES) and time resolved ARPES (tr-ARPES) we unveil the evolution of the electronic structure versus temperature in . Moreover, by studying the out-of-equilibrium band structure we prove the possibility of optically controlling the electronic properties of . All together our findings indicate the way to manipulate, at the ultrashort time scale, both the thermo-electric and magneto-electric transport properties.
One of the key points of our experiment is the direct imaging of the conduction band (CB). This band, located above the Fermi level (), is transiently populated and detected via non-linear two-photons photoemission (2PPE) process. Temperature dependent experiments reveal a negative energy shift of the band structure. The same binding energy shift is observed also by optically exciting the system out-of-equilibrium. The combined knowledge of both the occupied and unoccupied band structure, along with its temporal evolution across , enable us to account for the origin of the anomalous resistivity peak and the charge carrier switch from holes, at , to electron, at . Having clarified the electronic mechanisms that control the transport properties in , we prove that, by means of an ultrafast optical excitation it is possible to directly control the energy position of the band structure and the quasiparticle lifetime in the occupied valence band (VB) states.
The tr-ARPES experiments are performed at the T-ReX Laboratory, Elettra (Trieste, Italy), operating a Ti:Sapphire regenerative amplifier (Coherent RegA 9050) working at 250 kHz repetition rate, whose laser fundamental emission centered at 800 nm (1.55 eV) is split into two beams. The p-polarized pump beam excites the samples with an impinging fluence . Electrons are photoemitted by the probe beam, corresponding to the laser harmonics ( eV) generated in phase-matched barium borate (BBO) crystals. A waveplate is used for setting the s or p polarization state for the probe beam. The photoelectrons are collected and analyzed by a SPECS Phoibos 225 hemispherical spectrometer, with energy and angular resolution set to 10 meV and 0.2 ∘, respectively. The overall temporal resolution is equal to 250 fs Crepaldi et al. (2012). High quality single crystal are grown by direct vapour transport technique with iodine methods F.Lévy and Berger (1983). The samples are cleaved in ultra high vacuum and mounted on a variable temperature cryostat. The precise temperature of the resistivity anomaly slightly depends on the sample growth conditions Rubinstein (1999), and for the present study it corresponds to K Johannsen (2015).
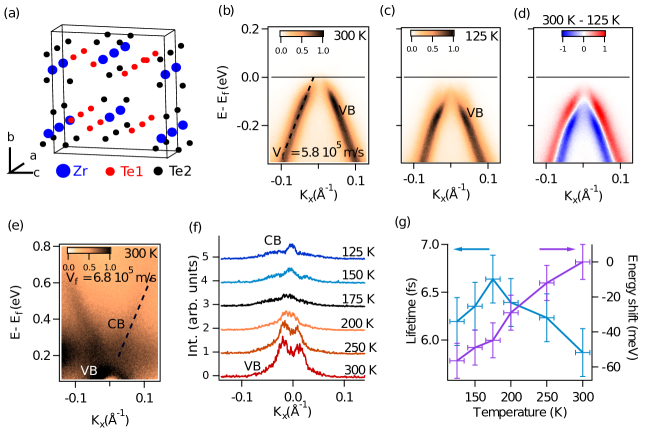
crystallize in the layered orthorombic crystal structure and it belongs to the point group, as shown in Figure 1 (a), as taken from reference Weng et al. (2014). Each primitive unit cell contains two ZrTe3 chains (Zr in blue and Te2 in black) linked along the c direction by two zig-zag chains formed by Te1 atoms (in red) Fjellvag and Kjejshus (1986); Weng et al. (2014). The resulting planes are stacked along the b axis, bound by Van der Waals force, resulting in very small interlayer binding energy, comparable to the one of graphite Weng et al. (2014). Crystals grow naturally oriented along the a axis exposing the ac plane. The low dimensional nature of the prismatic chains and the weak interlayer binding energy leave sometimes the cleaved surface with multiple domains characterized by different out-of-plane chain orientations. Hence, particular attention is required during ARPES measurements (for more details see the supplementary material Sup (2015)).
We have investigated in details the temperature evolution of the electronic band structure of along the chain direction, corresponding to the high symmetry direction in the reciprocal space (with ). Owing to the low photon energy (6.2 eV) only states close to () are resolved. However previous ARPES experiments Li et al. (2015), band structure calculations Weng et al. (2014) and Shubnikov de Haas studies Kamm et al. (1985) show that the maximum of the valence band and the minimum of the conduction band are located at the point and disperse close to . Hence, only these states are responsible for the electronic transport properties. A remarkable shift of the band towards lower energies is detected upon cooling, as extracted from the analysis of the momentum distribution curves (MDCs) (for more details see the supplementary material Sup (2015)). Results at equilibrium are summarized in Figure 1. Figure 1 (b) and (c) show the ARPES images of the valence band, dispersing with negative effective mass, measured with s-polarized light at 300 K and 125 K, respectively. The valence band (VB) is found to cross , and the Fermi wave-vector decreases at lower temperatures, consistently with data reported in ref. McIlroy et al. (2004). Figure 1 (g) quantifies the magnitude of the energy shift in the investigated temperature range (300 K - 125 K), with a maximum value equal to meV. Figure 1 (d) shows the difference image, obtained by subtracting the band dispersion at T = 125 K from that at T = 300 K. This procedure provides a direct visualization of the energy shift and a comparison with the out-of-equilibrium tr-ARPES results, discussed later.
In order to explain the mechanism at the origin of the anomalous transport properties it is necessary also to access the unoccupied band structure, whose contribution becomes relevant when new bands approach at temperature close to . In order to study the band dispersion of the unoccupied conduction band (CB), two photons photoemission experiments are used. Following this scheme, the laser optical excitation transiently populates CB, which is at the same time probed by an ultrafast laser UV pulse Johannsen et al. (2015); Sobota et al. (2013). 2PPE results are interpreted as the projection of the initial state onto intermediate unoccupied states below the vacuum level. Figure 1 (e) shows the results of 2PPE experiments with p-polarized light. The intensity is almost completely suppressed in measurements with s-polarized light. Since the VB disperses around with a negative effective mass, the observed positive dispersion in ascribed to the conduction band (CB), in agreement with ab initio calculations Weng et al. (2014). A linear fit of the band dispersion, dashed line, results in a band velocity of m/s, which is close to m/s band velocity obtained for VB. These comparable band velocities leave open the possibility to describe these states in term of linearly dispersing 3D Dirac particle, as recently proposed Li et al. (2015). Our data are compatible with an energy gap not larger than meV, comparable with the observed energy shift.
Figure 1(f) shows the evolution of the intensity at as a function of temperature. MDCs are integrated in an energy window of 20 meV below and displayed with a vertical offset. At T = 300 K (bottom curve) we clearly distinguish the double peak structure of VB crossing . Upon cooling, the two peaks get closer and eventually merge, indicating that the top of VB lies below . The minimum of intensity is observed at 175 K, close to the resistivity peak located at K. At lower temperature a new peak appears. This increase of spectral weight is attributed to the lowering of CB below . Finally, Figure 1 (g) shows, along with the energy shift, the temperature evolution of the quasiparticle lifetime extracted from the Lorentzian fit of the MDCs (for more details see the supplementary material Sup (2015)). Between 300 K and 175 K, increases with decreasing temperature, as expected for a metal. Conversely, below K, monotonically decreases. This is regarded as signature of an increased electron scattering rate as VB is fully occupied.
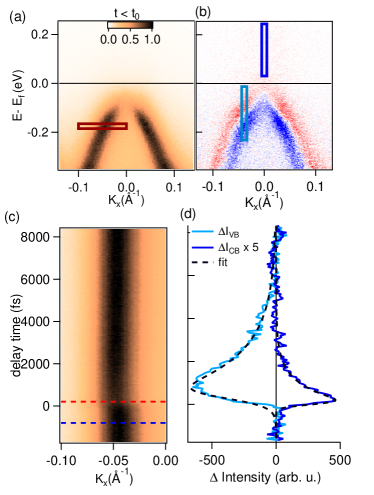
Having clarified the origin of the anomalous behavior of the resistivity and the nature of the charge carriers across , we prove now the possibility to control the electronic properties of by mean of an ultrafast optical pulse. Figure 2 shows the electronic properties (a) for equilibrium lattice temperature of 125 K before the arrival of the optical perturbation (-800 fs), and (b) the difference between the data immediately after (200 fs) and before (-800 fs) the arrival of the pump pulse. Figure 2 (b) displays a large energy shift of the bands very similar to that shown in Fig. 1 (c), which we interpret as follows. The optical excitation is responsible for two intertwined effects; the charge excitation from VB to CB, and the increase in the electronic energy. The latter results in the increase of both the electronic and lattice temperatures, hence accounting for the energy shift of the band structure. However, few fs-temporal resolution would be necessary to disentangle the electronic contribution from the lattice one. Figure 2 (c) shows the evolution of the MDCs at eV for in the region highlighted with the rectangle in Fig.2 (a). This small momentum window is chosen in order to better visualize the dynamics of the band shift as a consequence of the transient increase in temperature.
One of the key results reported in this Letter is the capability to manipulate, at the ultrashort timescale, the electronic band structure of . At the same time, we also report on the dynamics of the charge transfer between VB and CB. Figure 2 (d) shows the temporal evolution of the electron population in VB (negative signal) and CB (positive signal) integrated in the energy-momentum windows enclosed by rectangles in Fig. 2 (b). The integration windows are chosen in order to account in the same momentum window for the energy shift of the band. A single decaying exponential fit of the CB dynamics gives a characteristic time ps, which is significantly different from ps measured for VB. We notice also that the maximum excitation in VB is delayed with respect to CB. These findings indicate that different scattering mechanisms are responsible for both the electron (hole) accumulation at the bottom (top) of CB (VB) and the subsequent relaxation.
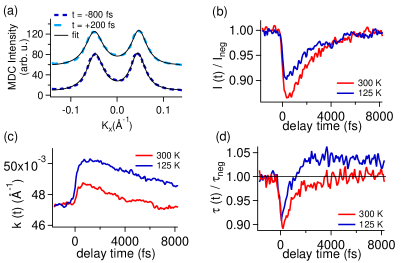
Figure 3 summarizes the dynamics of the optically induced band energy shift. We compare the temporal dynamics of the MDCs measured at equilibrium lattice temperature of 125 K (blue) and 300 K (red). For these two temperatures, the MDCs are extracted at -0.2 eV and -0.14 eV, respectively, in order to compare the dynamics of the emission peak at the same k value. Figure 3 (a) shows, with a vertical offset, two MDCs for equilibrium lattice temperature of 125 K before (-800 fs, dark blue) and after optical excitation (200 fs, light blue), along with the best fit (black line). Each MDC is fitted with a double Lorentzian function plus a polynomial background, as for the analysis in Fig.1. From each fit we obtain the temporal evolution of the Lorentzian function parameters: intensity, position of the maximum and width. Hereafter, we limit the discussion to the results for the band branch at negative k values. Figure 3 (b) shows the evolution of the intensity, normalized to the value at equilibrium. The intensity decreases after optical excitation as a consequence of the combined increase in temperature (broadening of the Fermi Dirac distribution) and the charge excitation from VB to CB. Figure 3 (c) shows the dynamics of the maximum intensity position, which shifts to larger momentum values reflecting the band energy shift.
Finally, we focus on the Lorentzian width, which is expressed in term of the quasiparticle lifetime , normalized to the value before optical excitation. In stark contrast to intensity and maximum intensity position, which have qualitatively the same dynamics both for T = 300 K and 125 K, shows different behaviors for the two different equilibrium lattice temperatures. At short time scale, both at 300 K and 125 K, shortens after optical excitation. While at 300 K, recovers its equilibrium value with a single decaying exponential, with characteristic time ps, at 125 K changes sign and increases by of the equilibrium value. The observed increase in the quasiparticle lifetime is consistent with the increase in the electronic and lattice temperature, as shown in Fig. 1 (g).
In conclusion, in this Letter we report a comprehensive investigation of both the occupied (VB) and unoccupied (CB) states of revealing a binding energy shift of these bands as a function of temperature. This remarkable finding unveils the origin of the resistivity anomaly at K along with the charge carriers switch from holes to electrons upon decreasing the temperature across . Having clarified the mechanism at the origin of the transport anomaly of , we have experimentally proven the possibility to optical modify the electronic properties of this material both in term of binding energy and quasiparticle lifetime of the valence band, thus leading to the control, at the ultrafast time scale, of the transport properties of . These results provide an external knob to control the conductivity and to unlock the route for a unique platform for magneto, optical and thermoelectric transport applications.
Very recently we became aware that a similar effect of temperature dependent energy shift of the electronic band structure has been reported by ARPES experiments on Wu et al. (2015), a material which also displays unique electronic properties Ali et al. (2014). This suggests that the mechanism studied in this Letter is general and of fundamental importance in controlling the transport properties of a potentially wide class of materials
This work was supported in part by the Italian Ministry of University and Research under Grant Nos. FIRBRBAP045JF2 and FIRB-RBAP06AWK3 and by the European Community Research Infrastructure Action under the FP6 ”Structuring the European Research Area” Program through the Integrated Infrastructure Initiative ”Integrating Activity on Synchrotron and Free Electron Laser Science”, Contract No. RII3-CT-2004-506008. We acknowledge support by the Swiss NSF.
References
- Sambongi (1986) T. Sambongi, Pentachalcogenides of Transition Metals Crystal Chemistry and Properties of Materials with Quasi-One-Dimensional Structures, vol. 5 (Physics and Chemistry of Materials with Low-Dimensional Structures, 1986).
- Tritt and IV (2001) T. M. Tritt and R. T. L. IV, Chapter 6 Thermoelectric properties of the transition metal pentatellurides: Potential low-temperature thermoelectric materials, vol. 70 (Semiconductors and Semimetals, 2001).
- Furuseth et al. (1973) S. Furuseth, L. Brattas, and A. Kjejshus, Acta Chemica Scandinavica 27 (1973).
- Jones et al. (1982) T. E. Jones, W. W. Fuller, T. J. Wieting, and F. Levy, Slid State communications 11, 793 (1982).
- Skelton et al. (1982) E. F. Skelton, T. J. Wieting, S. A. Wolf, W. W. Fuller, D. U. Gubser, T. L. Francavilla, and F. Levy, Solid state communications 42, 1 (1982).
- Izumi et al. (1982) M. Izumi, K. Uchinokura, E. Matsuura, and S. Harada, Solid State Communications 42, 773 (1982).
- Rubinstein (1999) M. Rubinstein, Phys. Rev. B 60, 1627 (1999).
- DiSalvo et al. (1981) F. J. DiSalvo, R. M. Fleming, and J. V. Waszczak, Phys. Rev. B 24, 2935 (1981).
- Okada et al. (1982) S. Okada, T. Sambongi, M. Ido, Y. Tazuke, R. Aoki, and O. Fujita, J. Phys. Soc. Jpn: 51, 460 (1982).
- Tritt et al. (1999) T. M. Tritt, N. D. Lowhorn, R. T. L. IV, A. Pope, C. R. Feger, and J. W. Kolis, Phys. Rev. B 60, 7816 (1999).
- Li et al. (2015) Q. Li, D. E. Kharzeev, C. Zhang, Y. Huang, I. Pletikosic, A. V. Fedorov, R. D. Zhong, J. A. Schneeloch, G. D. Gu, and T. Valla, arXiv:1412.6543 (2015).
- Moll et al. (2015) P. J. Moll, N. L. Nair, T. Helm, A. C. Potter, I. Kimchi, A. Vishwanath, and J. G. Analytis, arXiv:1505.02817v1 (2015).
- Chen et al. (2015a) R. Y. Chen, S. J. Zhang, J. A. Schneeloch, C. Zhang, Q. Li, G. D. Gu, and N. L. Wang, arXiv:1505.00307v1 (2015a).
- Chen et al. (2015b) R. Y. Chen, Z. G. Chen, X.-Y. Song, J. A. Schneeloch, G. D. Gu, F. Wang, and N. L. Wang, arXiv:1506.08676v1 (2015b).
- Zhou et al. (2015) Y. Zhou, W. Ning, Y. Du, Z. Chi, X. Chen, X. Wang, X. Zhu, X. Wan, Z. Yang, M. Tian, et al., arXiv:1505.02658 (2015).
- Weng et al. (2014) H. Weng, X. Dai, and Z. Fang, Phys. Rev. X 4, 011002 (2014).
- Hasan and Kane (2010) M. Z. Hasan and C. L. Kane, Rev. Mod. Phys. 82, 3046 (2010).
- Crepaldi et al. (2012) A. Crepaldi, B. Ressel, F. Cilento, M. Zacchigna, C. Grazioli, H. Berger, P. Bugnon, K. Kern, M. Grioni, and F. Parmigiani, Phys. Rev. B 86, 205133 (2012), URL http://link.aps.org/doi/10.1103/PhysRevB.86.205133.
- F.Lévy and Berger (1983) F.Lévy and H. Berger, Journal of Crystal Growth 61, 61 (1983).
- Johannsen (2015) J. C. Johannsen Private communication (2015).
- Fjellvag and Kjejshus (1986) H. Fjellvag and A. Kjejshus, Solid State Communications 60, 91 (1986).
- Sup (2015) For more details about the data analysis and the photoemission results see the supplementary information at url XXX (2015).
- Kamm et al. (1985) G. N. Kamm, D. J. Gillespie, A. C. Ehrlich, T. J. Wieting, and F. Levy, Phys. Rev. B 31, 7617 (1985).
- McIlroy et al. (2004) D. N. McIlroy, S. M. D. Zhang, J. Wharton, B. Kempton, R. Littleton, M. Wilson, and T. M. T. M. T. G. Olson, J. Phys.: Condens. Matter 16, 359 (2004).
- Johannsen et al. (2015) J. C. Johannsen, G. Autès, A. Crepaldi, S. Moser, B. Casarin, F. Cilento, M. Zacchigna, H. Berger, A. Magrez, P. Bugnon, et al., Phys. Rev. B 91, 201101 (2015).
- Sobota et al. (2013) J. A. Sobota, S.-L. Yang, A. F. Kemper, J. J. Lee, F. T. Schmitt, W. Li, R. G. Moore, J. G. Analytis, I. R. Fisher, P. S. Kirchmann, et al., Phys. Rev. Lett. 111, 136802 (2013).
- Wu et al. (2015) Y. Wu, N. H. Jo, M. Ochi, L. Huang, D. Mou, S. L. Budko, P. C. Canfield, N. Trivedi, R. Arita, and A. Kaminski, arXiv:1506.03346v1 (2015).
- Ali et al. (2014) M. N. Ali, J. Xiong, S. Flynn, J. Tao, Q. D. Gibson, L. M. Schoop, T. Liang, N. Haldolaarachchige, M. Hirschberger, N. P. Ong, et al., Nature 514, 205 208 (2014).