The MZ relation for local star-forming galaxies
Abstract
We investigate the evolution of the mass-metallicity (MZ) relation with a large sample of 53,444 star-forming galaxies (SFGs) at , selected from the catalog of MPA-JHU emission-line measurements for the Sloan Digital Sky Survey (SDSS) Data Release 7. Regarding the sample of SFGs, we correct the observational bias and raise the aperture covering fractions to check the reliability of the metallicity evolution. We show that (1) the redshift evolution of log() and log() luminosities is displayed in our sample; (2) we find the metallicity evolution of dex at in SFGs at ; (3) after applying the luminosity thresholds of log and log, we find that metallicity evolution is shown well, and that SFR evolution still is shown well under the latter luminosity threshold, but the evolution is not observed under the former one; (4) the evolution of the MZ relation seems to disappear at about after applying the luminosity threshold of log or log; (5) we find and in the equation () for log and log samples, respectively, and these imply that the evolution of the MZ relation may have a weaker dependence on SFR in our sample.
keywords:
galaxies: abundances — galaxies: evolution — galaxies: statistics1 INTRODUCTION
The gas-phase oxygen abundance (metallicity) is a key parameter to understand the processes of the formation and evolution of a galaxy, because metallicity mirrors both the history of gas inflow and outflow and the result of the past star-forming activity. In most star-forming galaxies (SFGs) at z , observations suggest that the stellar mass () increase originates mainly from cosmological inflows of gas from the intergalactic medium (Noeske et al. 2007; Whitaker et al. 2012; Zahid et al. 2013). Meanwhile, outflows of gas which exist almost ubiquitously can be observed out to z 3 in SFGs (Weiner et al. 2009; Steidel et al. 2010). Because metallicity is established by the interaction of gas flows and star formation, this implies that a relation may exist between the galaxy stellar mass and metallicity.
A measurement of the average metallicity using as a function of stellar mass is called as the mass-metallicity (MZ) relation. The presence of an MZ relation for SFGs was first observed by Lequeux et al. (1979), and following observations found that the relation of SFGs is generally shifted to lower metallicities with redshift (e.g. Erb et al. 2006; Maiolino et al. 2008; Zahid et al. 2013), compared with the relation of Tremonti et al. (2004, hereafter T04). Recently, Juneau et al. (2014) reported that the evolution of the observed MZ relation may be dependent on sample selection and the threshold line luminosities, and that the emission-line luminosity limits can bias our perception of the metallicity evolution of SFGs; applying a higher luminosity threshold, the local MZ relation becomes steeper. Using the star formation rate (SFR) as the third parameter, Mannucci et al. (2010) proposed the fundamental metallicity relation (FMR), the relation between Mass-Metallicity-SFR, which has been studied and discussed (Lara-López et al. 2010, 2013; Mannucci et al. 2010; Yates, Kauffmann, & Guo 2012; Henry et al. 2013b).
With the developments of near-infrared spectroscopy surveys, the MZ relation has been measured at many galaxy samples with different redshifts (Savaglio et al. 2005; Erb et al. 2006; Maiolino et al. 2008; Mannucci et al. 2009; Henry et al. 2013a, 2013b; Cullen et al. 2014; Steidel et al. 2014; Salim et al. 2015). Henry et al. (2013a) used 26 galaxies at to present the relation with dex decrease in metallicity compared with the local relation, and showed that they follow the local FMR. Utilizing 93 galaxies at , Cullen et al. (2014) presented that the dex lower metallicity in these galaxies than the local FMR may be an artefact of the MZ evolution, based on different metallicity indicators and calibrations. For these high redshift samples which are restricted to high emission-line luminosities, investigating the line luminosity effect in the Sloan Digital Sky Survey (SDSS) sample will help us understand how to interpret high-redshift SFG observations. Although the relation for SFGs at various redshift ranges has been extensively discussed, and much progress has been made, we will use the SFG sample at lower redshifts (), which is considered the effect of line luminosity evolution, to investigate the relation.
In this paper, we investigate the MZ relation for SFGs at , selected from the catalog of MPA-JHU measurements for the SDSS Data Release 7 (DR7). In Section 2, we describe mainly the SFG sample obtained by a series of steps. In Section 3, we present and discuss the evolution of the MZ relation in the local SFGs. We summarize the results and conclusions in Section 4. We adopt , , and .
2 THE SAMPLE and DATA
To explore the MZ relation at , we take into account the effect of line luminosity evolution and the aperture covering fraction, and compile a sample, selected from the catalog of the SDSS MPA-JHU DR7 release; 927,552 spectra are included in the measurements.
A number of parameters, such as various emission line measurements, are provided in the release. Based on the BPT diagram (Baldwin et al. 1981; Kauffmann et al. 2003; Kewley et al. 2006), we use the condition
to obtain the SFG sample of 369,479 galaxies. Considering the bias of the MZ relation from the aperture effect, a lower redshift limit of 0.04 is required (Kewley et al. 2005), and an upper redshift limit of 0.12 is chosen to minimize evolution effect (Zahid et al. 2013, 2014), and therefore it can avoid or reduce a selection effect of metallicity evolution originating from higher redshift galaxies. Due to the above redshift cuts, our sample leaves 199,645 galaxies. Considering the bias of the aperture effect, we can remove galaxies whose aperture covering fractions are for r band; 110,261 galaxies are removed from the sample.
Because high metallicity galaxies often have very weak emission (Zahid et al. 2014), SNR cuts do not employ the lines to avoid the bias of the measured MZ relation (Foster et al. 2012); therefore we choose galaxies from the above sample with S/N (SNR) 3 for H, H, , and . Using the SNR cut, our sample has 57,321 galaxies. Finally, we have chosen these galaxies with both and an SFR FLAG keyword of . Our final sample contains 53,444 SFGs.
In addition to the measurements of the redshifts, we also use the stellar masses and SFRs provided by the MPA-JHU group. The stellar masses are obtained, following the philosophy of Kauffmann et al. (2003) and Salim et al. (2007); the SFRs are based on Brinchmann et al. (2004); the stellar masses and SFRs assumed a Kroupa (2001) initial mass function (IMF) are corrected using a Chabrier (2003) IMF. Due to no SFR error provided by the MPA-JHU catalogue, we use as the error (Lian et al. 2015), where and are the 84th and 16th percentile values of log(SFR) in the catalogue.
Oxygen abundances of SFGs are estimated using the method (Pilyugin et al. 2006, 2010; Wu & Zhang 2013) and we adopt the calibration of T04 in this paper. To break the degeneracy between the upper and lower branch solutions, we choose the SFGs with log() as our sample (Kewley & Ellison 2008), and we find that all SFGs of our sample have .
3 Results
In this section, we first investigate whether there is any redshift evolution of the MZ relation within our SFG sample. We then explore whether there is a subsequent evolution in emission line luminosities for log(H) and log(H), and how this effects the MZ evolution. We then investigate the SFR dependence of the MZ relation in our sample. Finally, we investigate the biases related to variations in the aperture covering fraction within the sample.

| Redshift ranges | log(SFR)[] | log()[] | log(] | z | N | Total |
|---|---|---|---|---|---|---|
| Median | Median | Median | Median | |||
| (1) | (2) | (3) | (4) | (5) | (6) | (7) |
| -0.05 | 40.31 | 39.42 | 0.050 | 13370 | ||
| 0.14 | 40.52 | 39.51 | 0.065 | 8017 | ||
| 0.25 | 40.62 | 39.55 | 0.075 | 8760 | 53444 | |
| 0.39 | 40.75 | 39.64 | 0.089 | 12929 | ||
| 0.56 | 40.90 | 39.76 | 0.110 | 10368 |
Note: Col.(1): redshift ranges. Col.(2)-(5): the median values of log(SFR), log(), log(, and redshifts, respectively. Col.(6): the size of each subsample. Cols.(7): the total sample size.
3.1 Emission line luminosity evolution and metallicity evolution
Based on our SFG sample, we sort it into 5 subsamples; their redshift ranges are , , , , and , and we show their median values of and redshifts in Table 1. Table 1 shows clearly increasing SFR with redshift.
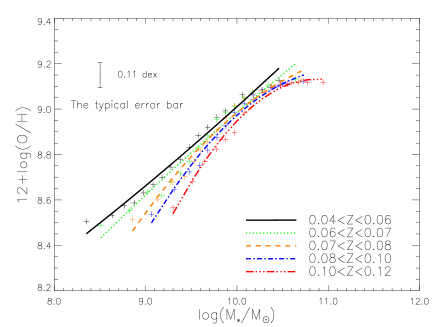
To explore well the MZ relation for SFGs with different redshift ranges, we sort SFGs of each subsample into 16 bins of galaxy stellar mass; more than 100 galaxies are included in each bin. All median values of stellar masses and metallicities of SFGs in each bin are shown in Figure 1, and the typical error bar of dex in metallicity is presented in Figure 1. In addition, we employ the second-order polynomial to fit the data of each subsample, and present them with different lines. In Figure 1, the metallicity difference of the MZ relations between the lowest and highest redshift ranges at is about dex (the red line and black line in Figure 1). In addition, Figure 1 shows that the metallicity difference is more significant toward lower stellar masses, suggesting that this may be a consequence of the downsizing effect of metal-enriched gas, i.e., higher mass galaxies evolving at earlier times on the MZ relation than lower mass ones; this agrees with the result of Henry et al. (2013b) and Yabe et al. (2014).
Using the SDSS sample, an evolution of log() and log() luminosities was found by Juneau et al. (2014). In our redshift subsamples, we investigate whether there is a redshift evolution of log() and log() luminosities. In Table 1, we list their median values of log, log, and redshifts. The evolution of log() and log() luminosities is clearly shown.
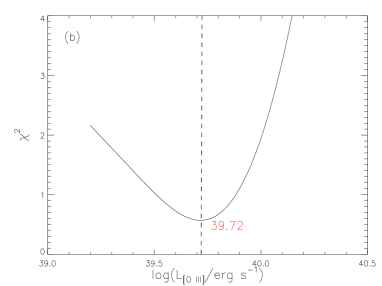
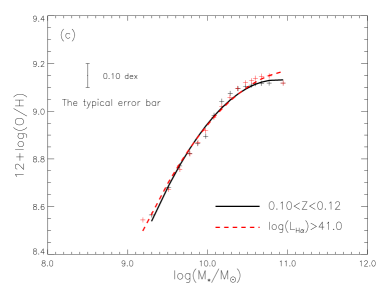
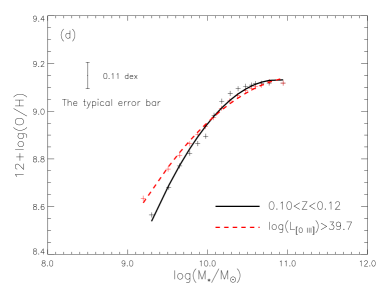
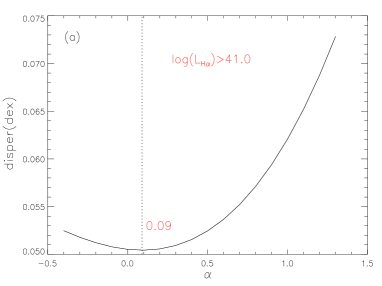
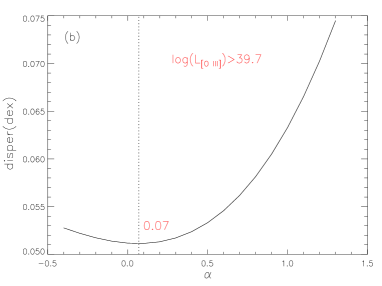
Utilizing the log() and log() luminosity limits for the SDSS sample, Juneau et al. (2014) showed an artificial evolution of MZ relation. The metallicity evolution shown in Figure 1 also should be corrected by the observed minimum line luminosity limit. We employ the MZ relation of the subsample to correct and achieve the observed minimum line luminosity limit in our sample; then the lower redshift subsamples can be cut to include only galaxies above that line luminosity limit. A Chi-squared test is used to assess the minimization of in the MZ relations between SFGs at (the black solid lines of Figures 2(c) and 2(d)) and above the different log() or log() luminosity thresholds. Considering the metallicity difference between the above mentioned two samples, we first obtain the median metallicity of each galaxy stellar mass bin in the log or log SFG sample and the metallicities at the median stellar masses of the above mentioned stellar mass bins, which are given by a linear interpolation of the metallicities in the MZ relations of the subsample; then we summate their metallicity differences between the two samples at the same stellar masses in 14 galaxy stellar mass bins111In the lowest and largest galaxy stellar mass bins of the subsample (the first and sixteenth mass bins), since the metallicities at their corresponding median galaxy stellar masses can not be obtained by the interpolation method, we obtain the total metallicity difference from the other 14 galaxy stellar mass bins (from the second to the fifteenth mass bins), when calculating the chi-squared values.; finally, we obtain respectively the luminosity thresholds of log and log (Figures 2(a) and 2(b)).
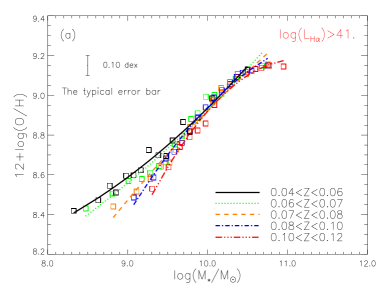
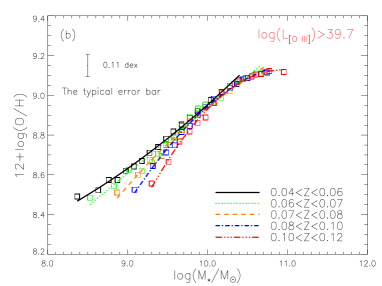
Considering the luminosity thresholds of log and log, we show respectively the MZ relations with the typical error bars of dex and dex in Figures 3(a) and 3(b). In Figure 3(a), we sort SFGs of each subsample into 16 bins with the same galaxy stellar mass ranges as in Figure 1, including more than 10 galaxies in each bin. All median values of stellar masses and metallicities of SFGs in each bin are shown in Figure 3(a). In addition, we employ the second-order polynomial to fit these data of each subsample, and present them with different lines. In Figure 3(a), the metallicity difference of MZ relations between the lowest and highest redshift ranges at is about dex (the red and black lines) in Figure 3(a). At , Figure 3(a) agrees with the result of Figure 1, showing metallicity evolution; at , the evolution is not observed in Figure 3(a), and the evolution observed in Figure 1 should have an observational bias.
Following Figure 3(a), we present them by employing the luminosity threshold of log in Figure 3(b). Compared with Figure 3(a), the SFG sample of Figure 3(b) increases by a factor of two approximately; therefore, their median metallicities and stellar masses in each redshift subsample are more smoothly distributed. Like Figure 3(a), Figure 3(b) also presents the MZ relation evolution, with the maximum metallicity difference of dex at ; Figure 3(b) agrees almost with the result of Figure 3(a) at . In addition, we find that the evolution of the MZ relation seems to disappear at about after applying the two luminosity thresholds. The reasons may be (1) oxygen enrichment decreases slowly with increasing galaxy stellar mass (Figure 3 of Wu & Zhang 2013), presenting the galaxy downsizing effect (Pilyugin & Thuan 2011); (2) metallicity saturates firstly at more massive galaxies and then at less massive galaxies (Zahid et al. 2013); our SFG sample has a lower range of , with the median redshift of , and therefore the metallicity saturation may begin at .
In Table 2, we show the KS-test probabilities of the same metallicity distributions for Figures 3(a) and 3(b) between and subsamples at the mass bins centered (median values of on , , , , , and ; the median masses between the and subsamples differ less than 0.05 in each mass bin. A K-S test shows that the probabilities, the same parent population between the two redshift subsamples, are smaller and smaller with decreasing mass bins centered (see Table 2). In addition, we also obtain the 2-d KS probabilities that the metallicity and stellar mass (their median values) between the higher redshift (i.e., , , , and ) and subsample SFGs are drawn from the same metallicity and stellar mass distributions in Figure 3(a), with 0.83606, 0.29806, 0.05839, and 0.00684, respectively. Figure 3(b) also presents the similar result of Figure 3(a). These suggest that Figures 3(a) and 3(b) show surely the metallicity evolution between and subsample SFGs, indicating that the redshift evolution of the MZ relation is only evident at in the local data.
| (1) | (2) | (3) | |
|---|---|---|---|
| 0.013 | |||
| 0.005 | |||
| 0.289 | |||
| 0.172 | 0.16 |
Note: Col.(1): median of log. Col.(2)-(3). their probabilities ( and for Figures 3(a) and 3(b), respectively.) for the null hypothesis that the and distributions are randomly drawn from the same metallicity population.
3.2 Investigating SFR Dependance
In Section 3.1, we have presented the evolution of the MZ relation. Since the evolution remains controversial, we explore whether the evolution depends on SFRs. For this aim, we use the method of Mannucci et al. (2010) to investigate SFR dependence.
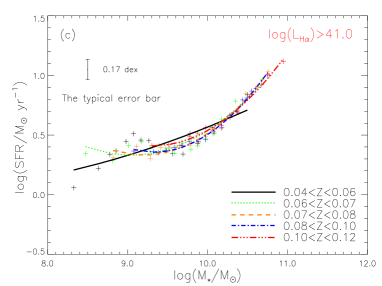
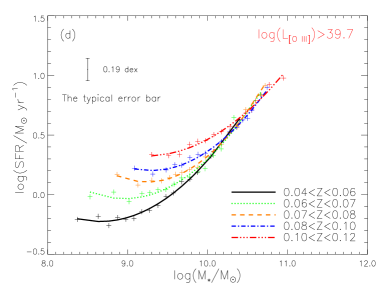
Corresponding to Figures 3(a) and 3(b), we respectively present the relations of stellar masses and SFRs (M-SFR) with their typical error bars of 0.17 dex and 0.19 dex in Figures 3(c) and 3(d). All median values of stellar masses and SFRs of SFGs in each bin are shown in Figures 3(c) and 3(d). In addition, we employ the second-order polynomial to fit these data of each subsample, and present them with different lines. Figure 3(d) shows significantly SFR evolution, whereas the evolution is not observed in Figure 3(c). There may be two reasons: (1) SFRs are perhaps not the main driving force of metallicity evolution, since metallicity evolves more with the stellar mass than with the SFR in the SDSS data (Mannucci et al. 2010); (2) when log is used as the minimum luminosity threshold, galaxies with similarly high SFRs at all redshifts are selected (see Figures 3(c) and 4(a)), and therefore no SFR evolution is observed; when log is used as the minimum luminosity threshold, galaxies at all redshifts are selected randomly (see Figures. 3(d) and 4(b)), and therefore SFR evolution is observed.
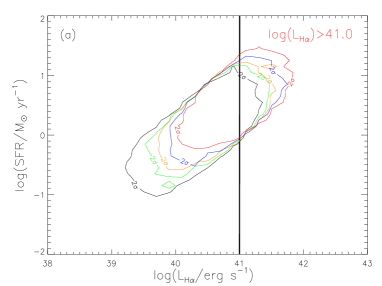
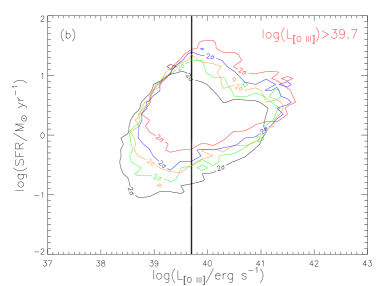
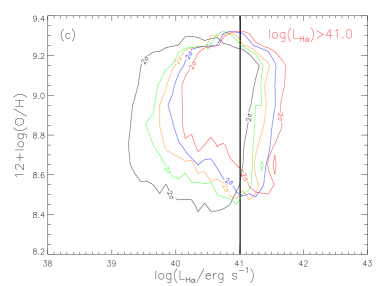
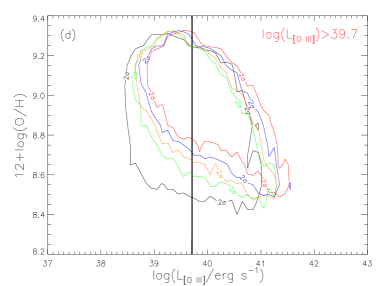
Next, we will investigate why a similar metallicity offset is shown in Figures 3(a) and 3(b) despite the fact that the SFR evolution is different in the log and log selected samples. Figures 4(a) and 4(b) present the contours of SFRs used as functions of log() and log() luminosities; Figures 4(c) and 4(d) respectively show the contours of 12+log(O/H) used as functions of log() and log() luminosities. Although the significantly different log(SFR) distributions between the two minimum thresholds are observed (see Figures 4(a) and 4(b)), SFGs in each subsample have a similar metallicity distribution, from 12+log(O/H) to (see Figures 4(c) and 4(d)), when the observed minimum line luminosity is either log or log. This explains the similar metallicity offset in Figures 3(a) and 3(b) under the different luminosity thresholds. These indicate that metallicity evolution is shown well under the luminosity thresholds of log or log, and that SFR evolution still is shown well under the latter luminosity threshold, but the evolution is not observed under the former luminosity threshold.
Here, we measure directly whether there is an SFR dependence using both log and log selected samples. Following the method of Mannucci et al. (2010), we investigate the value in the equation () which minimizes the metallicity scatter in bins of mass and SFR for both samples. Figures 5(a) and 5(b) show respectively and for log and log samples, and therefore these exclude fully a strong dependence of MZ relation on SFR, suggesting a weaker dependence on SFR, and the two values are close to the value of De Los Reyes et al. (2015). Moreover, the metallicity difference between or and is about 0.0001 dex, and therefore this may be further evidence for the weak SFR dependence.
3.3 Dependance of metallicity evolution on aperture covering fraction
In Section 3.1, we have shown that the redshift evolution of metallicities, at least for log, remains after accounting for line luminosity selection effects. In this section, as a final check, we explore an alternative bias which may mimic redshift evolution, namely the aperture covering fraction.
In the sample of SDSS DR7 data, we employ the redshift limit of . Following the suggestion of Kewley et al. (2005), we require the lower redshift limit of 0.04. In addition, the aperture covering fraction of is required. Using the upper limit of (Zahid et al. 2013, 2014), we mainly focus on minimizing evolution effect to avoid a select effect of metallicity evolution originating from higher redshift galaxies. The redshift and aperture covering fraction limits should avoid or reduce the biases from the aperture effect and selection effect. Therefore we can obtain reliably the global metallicity estimates for the 3 arcsec SDSS fiber.
In Figure 1, the metallicity differences between higher redshift and lower redshift subsamples are dex. Although negative metallicity gradients (i.e. cores with higher metallicity than outskirts) are presented in most galaxies (McCall et al. 1985; Vila-Costas & Edmunds 1992; Henry & Worthey 1999; Bresolin et al. 2012), we suggest that the metallicity difference in Figure 1 does not stem from the metallicity gradients, because the difference between metallicity gradients of large disks and either small disks or dwarf galaxies is much less than (Ellison et al. 2008). Then, Ellison et al. (2008) empirically checked the metallicity gradients by using cuts for r-band half-light radii () and covering fraction, and they found no evidence for the difference (the median covering fraction of our sample is , compared with their fraction of ) derived from the offset effect.
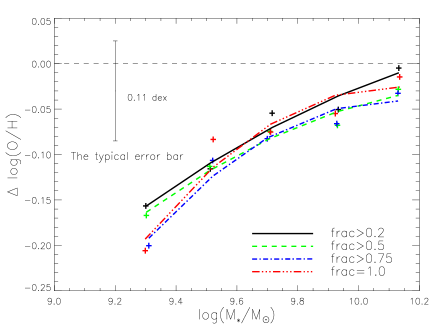
In addition to the above methods, we investigate the metallicity evolution between the highest and lowest redshift subsamples by raising the aperture covering fractions, such as , , and ; the metallicity differences for the different aperture coverings are shown respectively in Figure 6; their median values are , , and in their samples. Considering the observational bias of the emission line luminosity limits, Figure 6 shows that the metallicity differences between the highest and lowest redshfit subsamples for the different aperture covering fractions, from to , and then are consistent within the error, and their typical error bar is displayed in Figure 6. Also, the metallicity difference is dex at . Therefore we suggest that the metallicity evolution between SFGs with different redshift ranges is indeed real.
4 Summary
Considering the aperture effect and selection effect, we utilized and aperture covering fractions of for r band, and chose galaxies with SNR 3 for H, H, , and . Finally, we obtained 53,444 SFGs, selected from the catalog of MPA-JHU emission-line measurements for the SDSS DR7. Based on the sample, we investigated the evolution of the MZ relation. Our main results are the following.
1. In our sample, we showed clearly the redshift evolution of log() and log() luminosities. This indicates that using the SDSS or other data to investigate metallicity evolution should be corrected by an observed minimum line luminosity limit.
2. Correcting the observational bias and raising the aperture covering fractions, we found the metallicity evolution of dex at in our sample, indicating that the redshift evolution of the MZ relation is only evident at in the local data.
3. After applying the luminosity thresholds of log and log, we found that metallicity evolution is shown well, and that SFR evolution still is shown well under the latter luminosity threshold, but the evolution is not observed under the former one.
4. The evolution of the MZ relation seems to disappear at about after applying the luminosity threshold of log or log. This is due to that (1) oxygen enrichment decreases with increasing galaxy stellar mass, showing the galaxy downsizing effect; (2) metallicity saturates firstly at the more massive galaxies and then at the less massive ones, and therefore the metallicity saturation may begin at in our SFG sample with .
5. We explored the value in the equation () which minimizes the metallicity scatter in bins of mass and SFR following the method of Mannucci et al. (2010), and found and for the log and log samples, respectively; Moreover, the metallicity difference between the two values and is about 0.0001 dex, indicating further evidence for the weak SFR dependence. These imply that the MZ relation evolution may have a weaker dependence on SFR in our sample.
Acknowledgement
We appreciate very much the anonymous referee for valuable suggestions and comments, which allowed us to improve the paper significantly. SNZ acknowledges partial funding support by the Strategic Priority Research Program The Emergence of Cosmological Structures of the Chinese Academy of Sciences under grant No. XDB09000000, by 973 Program of China under grant 2014CB845802, by the Qianren start-up grant 292012312D1117210, and by the National Natural Science Foundation of China under grant Nos. 11133002 and 11373036. This project was granted financial support from China Postdoctoral Science Foundation and supported by the Young Researcher Grant of National Astronomical Observatories, Chinese Academy of Sciences.
References
- Baldwin (1981) Baldwin, J. A., Phillips, M. M., & Terlevich, R. 1981, PASP, 93, 5
- Bresolin et al. 2012 (2012) Bresolin, F., Kennicutt, R. C., & Ryan-Weber E. 2012, ApJ, 750, 122
- Chabrier 2003 (2003) Chabrier, G. 2003, PASP, 115, 763
- Cullen et al. 2014 (2014) Cullen, C., Cirasuolo, M., McLure, R. J., Dunlop, J. S., & Bowler, R. A. A. 2014, MNRAS, 440, 2300
- De Los Reyes et al. 2015 (2015) De Los Reyes, M. A., et al. 2015, AJ, 149, 79
- Ellison et al. 2008 (2008) Ellison, S. L., Patton, D. R., Simard, L., & McConnachie, A. W. 2008, ApJL, 672, 107
- Erb et al. 2006 (2006) Erb, D. K., Shapley, A. E., Pettini, M., et al. 2006, ApJ, 644, 813
- Foster et al. 2012 (2012) Foster, C., et al. 2012, A&A, 547, 79
- Henry et al. 2013a (2013a) Henry, A., Martin, C. L., Finlator, K., & Dressler, A. 2013a, ApJ, 769, 148
- Henry et al. 2013b (2013b) Henry, A., Scarlata, C., Domínguez, A., Malkan, M., Martin, C. L., et al. 2013b, ApJL, 776, 27
- Henry & Worthey 1999 (1999) Henry R. B. C., & Worthey G. 1999, PASP, 111, 919
- Juneau et al. 2014 (2014) Juneau, S., Bournaud, F., Charlot, S., et al. 2014, ApJ, 788, 88
- Kauffmann et al. 2003 (2003) Kauffmann, G., Heckman, T. M., Tremonti, C., et al. 2003, MNRAS, 346, 1055
- Kewley & Ellison 2008 (2008) Kewley, L. J., & Ellison, S. L. 2008, ApJ, 681, 1183
- Kewley et al. 2006 (2006) Kewley, L. J., Grovers, B., Kauffmann, G., & Heckman, T. 2006, MNRAS, 372, 961
- Kewley et al. 2005 (2005) Kewley, L. J., Jansen, R. A., & Geller, M. J. 2005, PASP, 117, 227
- Kroupa 2001 (2001) Kroupa, P. 2001, MNRAS, 322, 231
- Lara-López et al. 2010 (2010) Lara-López, M. A., Bongiovanni, A., et al. 2010, A&A, 519, 31
- Lara-López et al. 2013 (2013) Lara-López, M. A., Hopkins, A. M., López-Sánchez, A. R., et al. 2013, MNRAS, 434, 451
- Lequeux et al. 1979 (1979) Lequeux, J., Peimbert,M., Rayo, J. F., Serrano, A., & Torres-Peimbert, S. 1979, A&A, 80, 155
- Lian et al. 2015 (2015) Lian, J. H., Li, J. R., Yan, W., Kong, X. 2015, MNRAS, 446, 1449
- Maiolino et al. 2008 (2008) Maiolino, R., Nagao, T., Grazian, A., et al. 2008, A&A, 488, 463
- Mannucci et al. 2009 (2009) Mannucci, F., Cresci, G., Maiolino, R., et al. 2009, MNRAS, 398, 1915
- Mannucci et al. 2010 (2010) Mannucci, F., Cresci, G., Maiolino, R., Marconi, A., & Gnerucci, A. 2010, MNRAS, 408, 2115
- McCall et al. 1985 (1985) McCall M. L., Rybski P. M., & Shields G. A. 1985, ApJS, 57, 1
- Noeske et al. 2007 (2007) Noeske, K. G., Weiner, B. J., Faber, S. M., et al. 2007, ApJL, 660, L43
- Pilyugin et al. 2006 (2006) Pilyugin, L. S., Thuan, T. X., Vílchez, J. M. 2006, MNRAS, 367, 1139
- Pilyugin et al. 2010 (2010) Pilyugin, L. S., Vílchez, J. M., Cedrés, B., & Thuan, T. X. 2010, MNRAS, 403, 896
- Pilyugin & Thuan 2011 (2011) Pilyugin, L. S., & Thuan, T. X. 2011, ApJ, 726, L23
- Salim et al. 2015 (2015) Salim, S., Lee, J. C., Davé, R., Dickinson, M. 2015, ApJ, 808, 25
- Salim et al. 2007 (2007) Salim, S., Rich, R. M., Charlot, S., et al., 2007, ApJS, 173, 267
- Savaglio et al. 2005 (2005) Savaglio, S., Glazebrook, K., Borgne, D. L., Juneau, S., Abraham, R. G., et al. 2005, ApJ, 635, 260
- Steidel et al. 2010 (2010) Steidel, C. C., Erb, D. K., Shapley, A. E., et al. 2010, ApJ, 717, 289
- Steidel et al. 2014 (2014) Steidel, C. C., Rudie, G. C., Strom, A. L., et al. 2014, ApJ, 795, 165
- Tremonti et al. 2004 (2004) Tremonti, C. A., Heckman, T. M., Kauffmann, G., et al. 2004, ApJ, 613, 898 (T04)
- Vila-Costas & Edmunds 1992 (1992) Vila-Costas M. B., & Edmunds M. G. 1992, MNRAS, 259, 121
- Weiner et al. 2009 (2009) Weiner, B. J., Coil, A. L., Prochaska, J. X., et al. 2009, ApJ, 692, 187
- Whitaker et al. 2012 (2012) Whitaker, K. E., van Dokkum, P. G., Brammer, G., & Franx, M. 2012, ApJL, 754, 29
- Wu et al. 2013 (2013) Wu, Y.-Z., & Zhang, S.-N. 2013, MNRAS, 436, 934
- Yabe et al. 2012 (2012) Yabe, K., Ohta, K., Iwamuro, F., et al. 2012, PASJ, 64, 60
- Yabe et al. 2014 (2014) Yabe, K., Ohta, K., Iwamuro, F., et al. 2014, MNRAS, 437, 3647
- Yates et al. 2012 (2012) Yates, R. M., Kauffmann, G., Guo, Q. 2012, MNRAS, 422, 215
- Zahid et al. 2014 (2014) Zahid, H. J., Dima, G. I., Kudritzki, R., et al. 2014, ApJ, 791, 130
- Zahid et al. 2013 (2013) Zahid, H. J., Geller, M. J., Kewley, L. J., et al. 2013, ApJL, 771, 19