11email: msteinke@astro.physik.uni-potsdam.de, lida@astro.physik.uni-potsdam.de 22institutetext: I. Physikalisches Institut der Universität zu Köln, Zülpicher Straße 77, 50937 Köln, Germany 33institutetext: Leibniz Institute for Astrophysics Potsdam (AIP), An der Sternwarte 16, 14482 Potsdam, Germany
Analysis of the WN star WR 102c, its WR nebula, and the associated cluster of massive stars in the Sickle Nebula††thanks: The scientific results reported in this article are based on observations obtained during the ESO VLT program 383.D-0323(A)
Abstract
Context. The massive Wolf-Rayet type star WR 102c is located near the Quintuplet Cluster, one of the three massive star clusters in the Galactic Centre region. Previous studies indicated that WR 102c may have a dusty circumstellar nebula and is among the main ionising sources of the Sickle Nebula associated with the Quintuplet Cluster.
Aims. The goals of our study are to derive the stellar parameters of WR 102c from the analysis of its spectrum and to investigate its stellar and nebular environment.
Methods. We obtained observations with the ESO VLT integral field spectrograph SINFONI in the K-band, extracted the stellar spectra, and analysed them by means of stellar atmosphere models.
Results. Our new analysis supersedes the results previously reported for WR 102c. We significantly decrease its bolometric luminosity and hydrogen content. We detect four early OB type stars close to WR 102c. These stars have radial velocities similar to that of WR 102c. We suggest that together with WR 102c these stars belong to a distinct star cluster with a total mass of . We identify a new WR nebula around WR 102c in the SINFONI map of the diffuse Br emission and in the HST Pa images. The Br line at different locations is not significantly broadened and similar to the width of nebular emission elsewhere in the H ii region around WR 102c.
Conclusions. The massive star WR 102c located in the Galactic Centre region resides in a star cluster containing additional early-type stars. The stellar parameters of WR 102c are typical for hydrogen-free WN6 stars. We identify a nebula surrounding WR 102c that has a morphology similar to other nebulae around hydrogen-free WR stars, and propose that the formation of this nebula is linked to interaction of the fast stellar wind with the matter ejected at a previous evolutionary stage of WR 102c.
Key Words.:
stars: early-type – stars: individual: WR 102c – stars: Wolf-Rayet – Galaxy: center – ISM: H ii regions – infrared: stars1 Introduction
The advent of IR observations led to the discovery of many massive stars in the central part of our Galaxy, mainly congregated in three massive star clusters, but also scattered in the field (e.g. Figer et al., 1999b; Homeier et al., 2003). The relatively isolated massive stars in the Galactic Centre (GC) region have not been extensively observed and are as yet poorly understood (among recent results, see e.g. Dong et al., 2015; Habibi et al., 2014; Oskinova et al., 2013).
To study two such relatively isolated Wolf-Rayet (WR) stars, WR 102c and WR 102ka (known as the Peony star), we obtained mid-IR spectra using the IRS spectrograph on board the Spitzer telescope (Houck et al., 2004). These observations lead to the detection of dusty circumstellar nebulae around these objects (Barniske et al., 2008). This was an unexpected discovery, since it was previously believed that dust cannot survive in the immediate vicinity of hot stars of spectral type WN. However, since then, dusty IR nebulae have been discovered around more WN-type stars (Gvaramadze et al., 2009, 2014; Burgemeister et al., 2013). Even more importantly, such dusty nebulae have become an observational “smoking gun” in the search for new WR stars (Flagey et al., 2011; Mauerhan et al., 2011; Wachter et al., 2010).
Barniske et al. (2008) have performed an analysis of the near-IR K-band spectrum of the Peony star by means of the non-LTE stellar atmosphere code PoWR (e.g. Hamann & Koesterke, 1998b; Gräfener et al., 2002). It has been shown that this object is among the most luminous, and initially most massive stars in the Galaxy. However, at the time of their paper good quality spectra of WR 102c were not available and only crude qualitative conclusions could be made about this source.
To remedy this situation and to study the Peony star and WR 102c in more detail, we obtained integral field spectra of these stars and their nebulae with the Spectrograph for Integral Field Spectroscopy in the Near Infrared (SINFONI). In the previous paper (Oskinova et al., 2013, herafter Paper I) we analysed the Peony star WR 102ka and its surrounding. In this paper we concentrate on the analysis of WR 102c.
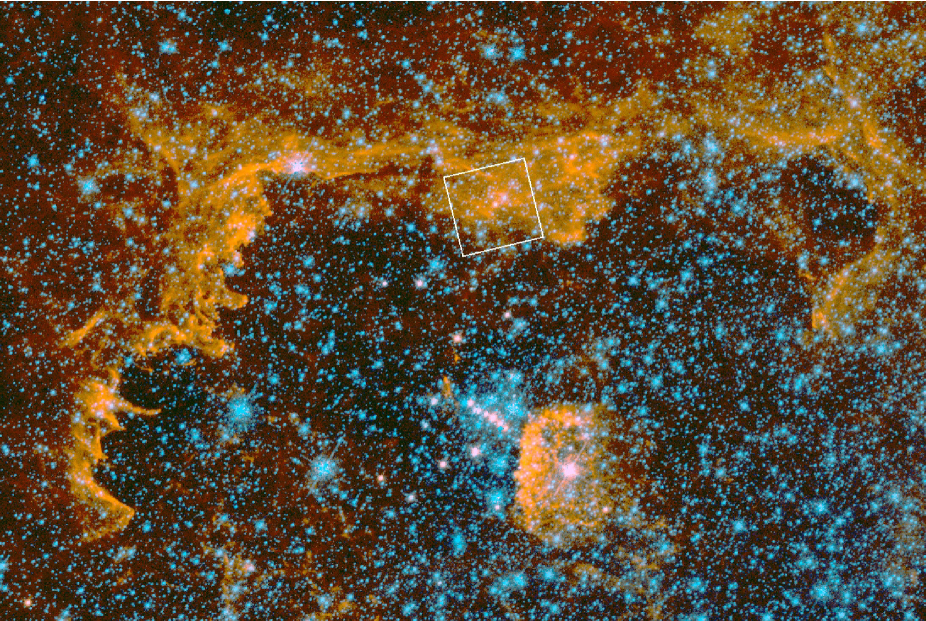
WR 102c is located in the neighbourhood of the Quintuplet Cluster, in a large H ii region seen in the IR images as extended diffuse emission and called the Sickle Nebula (see Fig. 1). The star was discovered during a survey by Figer et al. (1999b), who classified it as WN6 subtype. The goal of our present analysis is to obtain the parameters of WR 102c by means of spectral modelling, and to unravel its evolutionary history and possible ties with the Quintuplet Cluster. We study the environment of WR 102c by means of integral field spectroscopy to search for other massive stars that, together with WR 102c, may form a massive distinct subcluster. We also study the part of the Sickle Nebula that is directly influenced by ionising radiation from WR 102c. Throughout the paper we adopt distance modulus mag (Reid, 1993).
Special interest in WR 102c is also motivated by the recent report by Lau et al. (2015) who have identified a dusty helix shape filament in the vicinity of the Quintuplet Cluster. Lau et al. propose that this dusty filament is a precessing, collimated outflow from WR 102c. Furthermore, it has been suggested that WR102c has a gravitationally bound compact binary companion with an orbital period days. This hypothesis potentially makes WR 102c a very rare and interesting object that deserves a thorough study.
The SINFONI observations and data reduction are presented in Sect. 2. The circumstellar nebula around WR 102c is discussed in Sect. 3. The spectral analysis of WR 102c is described in Sect. 4. The objects detected near WR 102c, in particular a subcluster of early-type stars, are discussed in Sect. 5, while the summary and the conclusions are drawn in Sect. 6.
2 Observations and data reduction
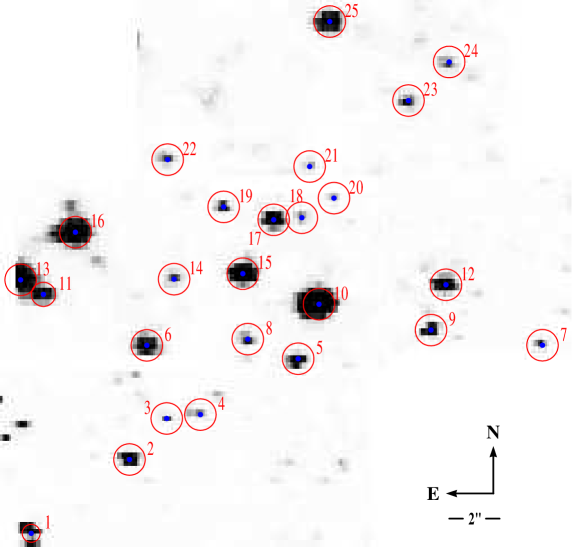
The data used in this work were obtained with the ESO VLT UT4 (Yepun) telescope between April 29 and May 19, 2009. The observations were performed with the integral field spectrograph SINFONI (Eisenhauer et al., 2003; Bonnet et al., 2004) yielding a three-dimensional data cube with two spatial dimensions and one spectral dimension. The K-band (m) grating with resolving power was used. The spatial scale was chosen as per pixel. The total observation consists of a mosaic of seven pointings (observational blocks), covering ( pc 0.9 pc) centred on WR 102c (see Fig. 2).
The adaptive optics facility could not be used since there is no sufficiently bright reference star in the neighbourhood. The log of the observations is given in Table 1. ABBA (science field – sky – sky – science field) cycles were performed at each pointing. Each field was observed with a total exposure time of 300 s, usually as the sum of two detector integrations of 150 s each, except for the fields 361404 and 361410 where we had to split the integrations into 30 s intervals to avoid saturation of the brightest objects. To obtain flux calibrated spectra, standard stars were observed at similar airmass and in the same mode as the science targets. The seeing was between and , limiting the angular resolution of our observations.
| Block | Date | R.A. (J2000) | Dec. (J2000) | sky111111sky fields B1 and B2 are centred at 17h46m1853, °48′57 and 17h46m1546, °48′542, respectively. | Telluric | Average |
|---|---|---|---|---|---|---|
| (ID) | 2009 | -28°49′ | standard | seeing [] | ||
| 361398 | April 29 | 1110 | -09 | B1 | HIP 83861 | 1.05 |
| 361400 | April 29 | 1056 | -09 | B2 | HIP 83861 | 0.98 |
| 361402 | April 29 | 1147 | 063 | B1 | HIP 83861 | 1.01 |
| 361404 | May 17 | 1093 | 069 | B2 | HIP 88857 | 0.64 |
| 361406 | May 17 | 1037 | 063 | B1 | HIP 85138 | 0.75 |
| 361408 | May 19 | 1151 | 140 | B2 | HIP 86951 | 0.57 |
| 361410 | May 19 | 1097 | 140 | B1 | HIP 84435 | 0.65 |
The data reduction was performed with the SINFONI pipeline version 2.32 (EsoRex version 3.9.6) using additional cosmic removal from L.A.cosmic (van Dokkum, 2001) and self-written tools in Interactive Data Language (IDL). The procedure was the same as performed for the Peony star and we refer to section 2 of Paper I for details.
The flux-calibrated three-dimensional data cubes of the individual fields were combined to a grand mosaic cube. This cube was “collapsed”, i.e. summed over all wavelengths, to obtain a pass-band image for the purpose of point source detection. Our observations are sensitive down to an apparent magnitude of mag. With the reddening towards WR 102c (see Sect. 4), the extinction in the K-band amounts to about 3 mag. Thus, at the distance of 8 kpc, our observations are sensitive to absolute K-band magnitudes mag.
We securely detect 25 stellar point sources in the observed field (see Fig. 2). Their coordinates, spectral types, and radial velocities are given in Table 2. The Ks-band magnitudes were calculated from the flux-calibrated spectra, using the 2MASS filter transmission function (Skrutskie et al., 2006). The radial velocities were derived from the Doppler shift of prominent lines (except for WR 102c, which has a wind-dominated spectrum), namely the first 12CO band heads for cool stars and hydrogen Br and helium lines for the OB-type stars. Further details are given in Sects. 4 and 5.
| No. | R.A. | Dec. | Ks | MK | |
|---|---|---|---|---|---|
| [mag] | type | [km s-1] | |||
| 1 | 1165 | 178 | 12.8 | M0 | -70 |
| 2 | 1138 | 149 | 13.0 | M1 | 95 |
| 3 | 1129 | 132 | 14.4 | K1 | -90 |
| 4 | 1120 | 131 | 14.4 | K4 | 85 |
| 5 | 1094 | 108 | 13.4 | M0 | 55 |
| 6 | 1134 | 103 | 13.0 | M0 | 50 |
| 7 | 1029 | 103 | 14.3 | K5 | 10 |
| 8 | 1107 | 101 | 14.0 | K4 | 205 |
| 9 | 1058 | 097 | 13.4 | M0 | 60 |
| 10 | 1088 | 087 | 10.3 | M5-6 | -45 |
| 11 | 1169 | 083 | 13.3 | K5 | 140 |
| 12 | 1055 | 079 | 12.4 | M1 | 100 |
| 13 | 1167 | 077 | 12.0 | B1-2 | 100 |
| 14 | 1126 | 077 | 14.1 | B5 | 90 |
| 15 | 1108 | 075 | 11.6 | WN6 | 120 |
| 16 | 1153 | 058 | 12.0 | K0 | 120 |
| 17 | 1100 | 053 | 12.6 | B2: | 70 |
| 18 | 1093 | 052 | 14.3 | K3 | 270 |
| 19 | 1113 | 048 | 13.8 | K5 | 90 |
| 20 | 1084 | 045 | 14.8 | K5 | -250 |
| 21 | 1091 | 032 | 14.7 | M0 | 185 |
| 22 | 1128 | 029 | 14.0 | M0 | 0 |
| 23 | 1064 | 006 | 13.8 | K4 | -65 |
| 24 | 1054 | -10 | 14.0 | K2 | -35 |
| 25 | 1085 | -26 | 12.8 | O7? | 100 |
3 Circumstellar nebula around WR 102c
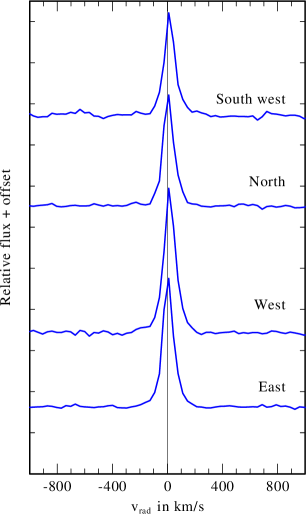
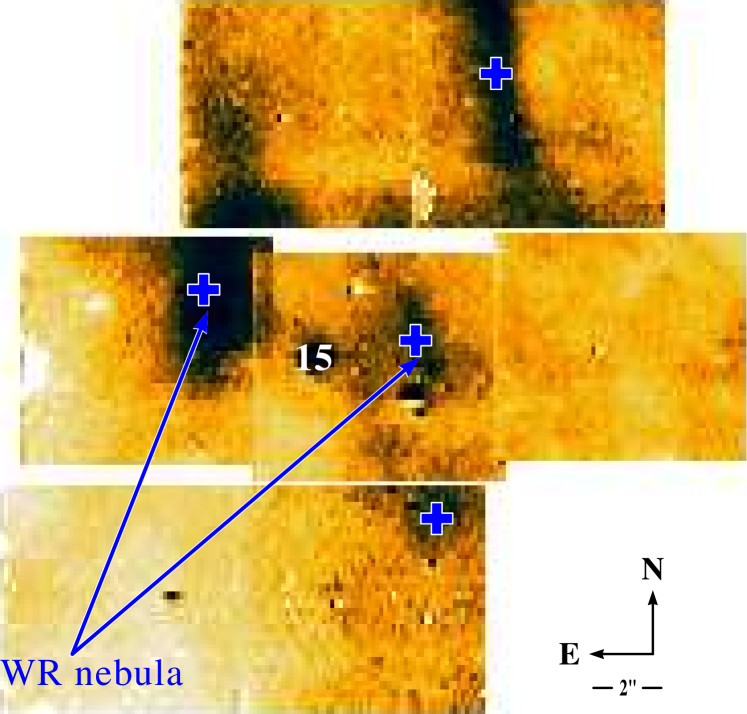
From the analysis of mid-IR observations of WR 102c with the Spitzer and MSX telescopes, Barniske et al. (2008) detected a dusty circumstellar nebula heated by the intense radiation of the WR star. However, the spatial resolution of these instruments was not sufficient to directly image this nebula. Our near-IR SINFONI data have a much better resolution. Hence, to study the nebular emission we created a narrow band image in the Br line. A bipolar or ring structure centred on WR 102c (source 15) is clearly seen in this image (see Fig. 3). The radius of the nebula is ( pc). As the field is quite crowded with stars, it is difficult to conclude whether the nebula is circular or bipolar. To measure its expansion velocity, the spectra were extracted at different locations. As can be seen in Fig. 4, the nebular Br lines are neither shifted nor broadened by more than km s-1 (SINFONI’s spectral resolution). This upper limit on the expansion velocity indicates that the nebula is not expanding quickly, opposite to what would be expected if the observed bipolar structure were the result of a fast collimated outflow.
Nebulae with various morphologies are often observed around WR stars. The mechanisms of nebula formation are linked to stellar evolution: when a massive star leaves the main sequence, it loses a large amount of matter. In the luminous blue variable (LBV) or a red supergiant (RSG) phase the stellar wind is dense and slow, while at a later evolutionary stages (WN) the wind is fast. The interaction between the slow and fast moving wind creates shells that are ionised and heated by the stellar radiation (e.g. Garcia-Segura & Mac Low, 1995; Freyer et al., 2006; van Marle et al., 2007; Toalá & Arthur, 2011). A recent review on WR nebulae is given in Toalá et al. (2015) and references therein.
To explain the nature of the nebula around WR 102c seen in the Br image we considered the following check-list. The nebula is surrounding a WR-type star. It has a small expansion velocity similar to other WR nebulae (e.g. Marston et al., 1999). The nebula is clearly seen from its hydrogen emission (in this case Pa and Br) and in He i maps of diffuse gas, analogously to other WR nebulae. Significantly, WR nebulae have morphologies that correlate with the spectral type of their central stars. The ring or bubble-like morphologies (B-type), sometimes bipolar, are found around WNE stars with fast winds, just as in the case of WR 102c. These characteristics lead us to conclude that the nebula around WR 102c is a typical WR nebula.
However, there are some important aspects that distinguish the WR 102c nebula. It is small, only 0.15 pc, while the typical size of WR nebulae is a few parsec. The small size of this nebula can, perhaps, be attributed to the very dense and warm environment in the vicinity of the Quintuplet Cluster. Another unusual aspect is the presence of a helix-like tail likely associated with WR 102c as found by Lau et al. (2015).
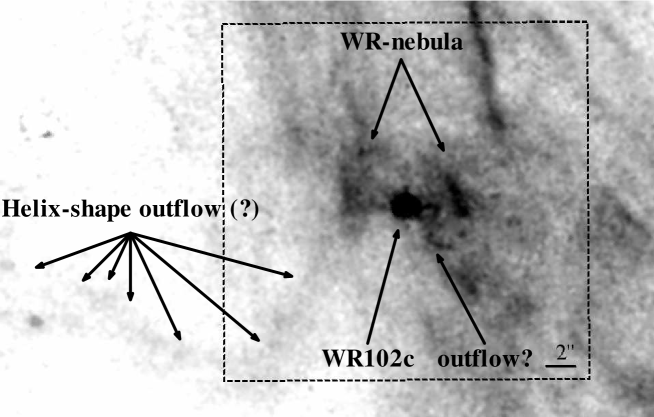
The WR 102c-nebula and helix tail can also be clearly recognised in the HST Pa image (Fig. 5). Moreover, it appears that another helix-like outflow is seen within the ring-nebula, as indicated in Fig. 5. However, the Pa images should be interpreted with caution. These were heavily processed, as explained in depth in Dong et al. (2011). The SINFONI images do not show obvious helix-like structures associated with WR 102c.
Vink et al. (2011) have found a significant correlation between fast rotating WR stars and the subset of WR stars with ejecta nebulae. They note that these objects have only recently transitioned from a previous RSG or LBV phase and thus have not yet significantly undergone spin-down which will be caused by their intensive mass loss due to the conservation of momentum. This subset of fast rotating WR stars are the candidate -ray burst progenitors. Gräfener et al. (2012) have identified an incidence rate of % for WR stars in the Galaxy that have possible ejecta nebulae and rotate faster than the average WR stars. They note that even early-type hydrogen-free WR stars, such as WR 6 (WN4) and WR 136 (WN6) can be fast rotators, perhaps evolving through binary channels. Hence, the presence of a compact bipolar nebula and a helix-like outflow from WR 102c may indicate that this object has only recently transitioned to the WR evolutionary stage, and is still a relatively fast rotator.
4 The WN6 star WR 102c
WR 102c was discussed in Barniske et al. (2008) who confirmed its spectral type as WN6 based on the inspection of the low-resolution spectrum shown by Figer et al. (1999b). In the present paper, we now analyse the new high-quality SINFONI spectrum of WR 102c in detail largely revising the estimates made in Barniske et al. (2008).
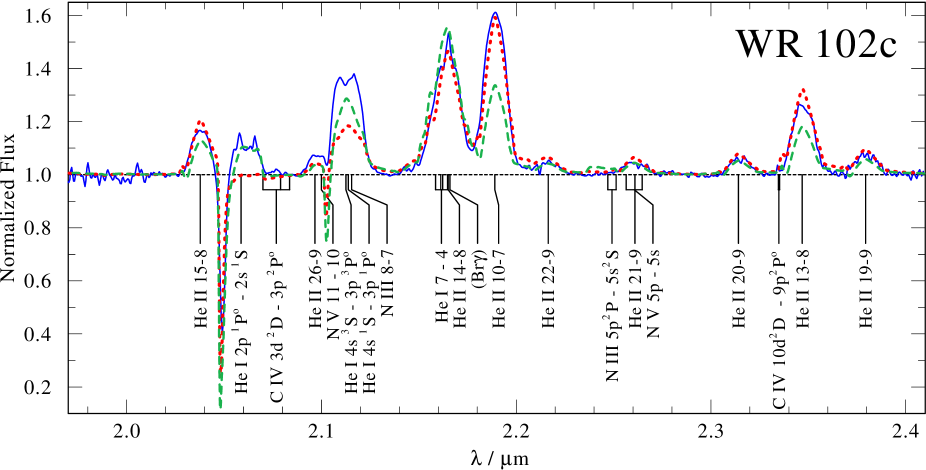
The WR 102c spectrum (Fig. 6) was analysed by means of PoWR model atmospheres222http://www.astro.physik.uni-potsdam.de/PoWR/ (Hamann & Gräfener, 2004; Todt et al., 2015). The PoWR code has been used extensively to analyse the spectra of massive stars in the IR as well in the ultraviolet and optical range (e.g. Oskinova et al., 2007; Liermann et al., 2010; Oskinova et al., 2011; Sander et al., 2012; Hainich et al., 2014). The PoWR code solves the non-LTE radiative transfer in a spherically expanding atmosphere simultaneously with the statistical equilibrium equations and accounts at the same time for energy conservation. Complex model atoms with hundreds of levels and thousands of transitions are taken into account. The computations for the present paper include detailed model atoms for hydrogen, helium, carbon, oxygen, nitrogen, and silicon. Iron and iron-group elements with millions of lines are included through the concept of super-levels (Gräfener et al., 2002). The extensive inclusion of the iron group elements is important because of their blanketing effect on the atmospheric structure.
The stellar radius , which is the inner boundary of our model atmosphere, corresponds by definition to a Rosseland continuum optical depth of 20. The stellar temperature is defined by the luminosity and the stellar radius via the Stefan-Boltzmann law; i.e. denotes the effective temperature referring to the radius . For the wind velocity we adopt the usual -law with (e.g. Sander et al., 2015). Each stellar atmosphere model is defined by its effective temperature, surface gravity, luminosity, mass-loss rate, wind velocity, and chemical composition. The gravity determines the density structure of the stellar atmosphere below and close to the sonic point. If lines from the quasi-hydrostatic layers are visible in the spectrum, the analysis allows the gravity and thus the stellar mass to be derived from the pressure-broadened absorption line profiles (Sander et al., 2015).
For a given chemical composition and stellar temperature , synthetic spectra from WR model atmospheres of different mass-loss rates, stellar radii, and terminal wind velocities yield almost the same emission-line equivalent widths if their transformed radii (Schmutz et al., 1989) agree. To account for small-scale wind inhomogeneities, we adopt a clumping contrast of as a typical value for WN stars (Hamann & Koesterke, 1998a). We note that is inversely correlated with the mass-loss rate, i.e. the smaller the transformed radius, the higher the density in the stellar wind.
4.1 Temperature of WR 102c
Figure 6 shows the normalised spectrum of WR 102c compared to synthetic spectra. Unfortunately, it is impossible to find a model that simultaneously fits all He i and He ii emission lines. The model for kK reproduces the He ii emission lines perfectly, but the He i lines at m and m are severely underestimated (red dotted line in Fig. 6). The alternative model drawn as a green dashed line for a temperature of kK reproduces the He i line at m perfectly, but underestimates some of the He ii lines. The line at m is actually not only composed of He i, but is also blended with N iii. The corresponding transitions are not fully included in our atomic data, which might explain the mismatch.
Hence, the stellar temperature remains uncertain in the range kK to kK. Moreover, if the star is a fast rotator it could lead to variations of the wind properties between poles and equator.
It is not possible to establish the rotation rates of WR stars from spectroscopic analysis of the near-infrared only. For example, our test calculations show that even the unrealistically high photospheric rotation velocities up to km s would not leave any noticeable imprint on the K-band spectrum as long as the wind does not corotate (see discussion in Shenar et al., 2014). We do not observe signs of such extreme wind corotation in WR 102c.
Fortunately, the impact of the uncertainty on the implied mass-loss rate and luminosity is relatively small (see Table 3). In particular, the effect on , i.e. the effective temperature referring to the radius of Rosseland optical depth , is hardly affected. This invariance reflects the parameter degeneracy of very dense stellar winds as discussed in e.g. Hamann et al. (2006).
Another speculative explanation for the inconsistent spectral fit could be the presence of a cooler, unresolved companion. A useful empirical diagnostic of WR-binaries is provided by X-ray observations. While single WR stars are relatively faint X-ray sources (Ignace et al., 2000; Oskinova et al., 2003), the WR-type binaries usually display colliding wind phenomena and are bright, detectable X-ray sources even in the GC region (Law & Yusef-Zadeh, 2004; Oskinova, 2005). WR 102c was not detected in deep X-ray surveys of the Quintuplet Cluster (Wang et al., 2006). This non-detection provides evidence against the binarity hypothesis.
4.2 Abundances
Barniske et al. (2008) constrained the hydrogen abundance in WR 102c as being below 20% by mass. The new data allow this limit to be adjusted to %. If the hydrogen content were higher, it would contribute significantly to the emission at m (He ii + Br). Thus, our new analysis confirms that WR 102c is a virtually hydrogen-free WNE star.
In the observed spectrum, all clearly detectable metal lines (of nitrogen and carbon) are blended with helium lines (e.g. N v at m or C iv at m). For our models we adopted a mass fraction of for nitrogen, which is typical for Galactic WN stars. The carbon abundance is constrained to , otherwise carbon emission lines would be visible (e.g. C iv at m). Hence, we set the carbon abundance to a mass fraction of .
4.3 Bolometric luminosity of WR 102c
| Spectral type | WN6 |
|---|---|
| [kK] | |
| [kK] | |
| [s-1] | |
| [km s-1] | 1600 |
| [km s-1] | |
| [mag] | 2.8 |
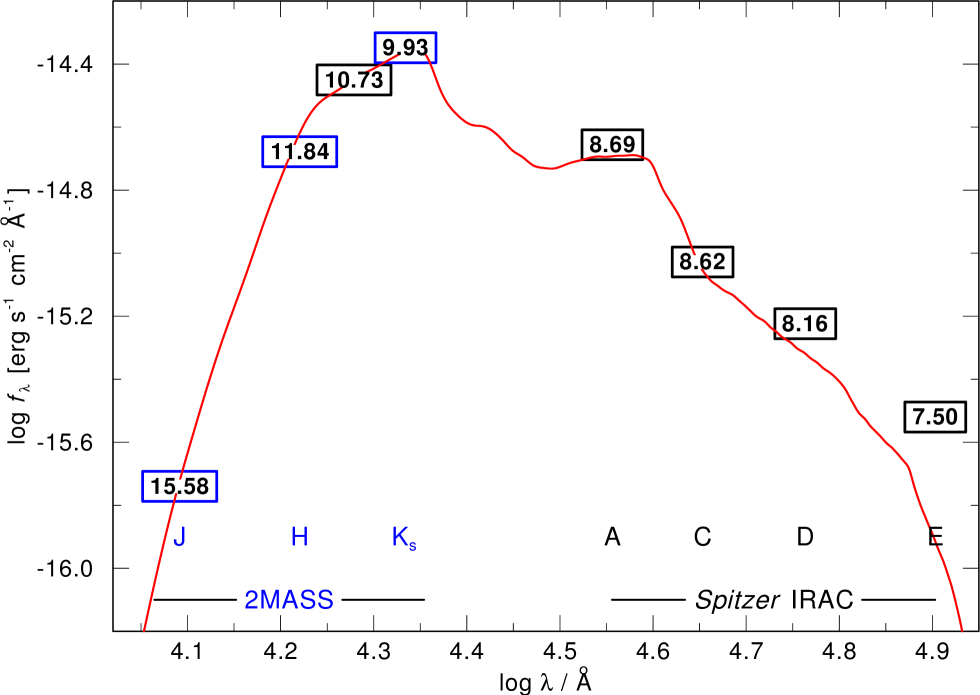
In their discovery paper, Figer et al. (1999b) assigned a Ks-band magnitude of 11.6 mag to WR 102c. This value was revised by Barniske et al. (2008) who erroneously used the Ks-band magnitude of a nearby bright star (source 10 in Fig. 2) from the 2MASS and the Spitzer IRAC point source catalogues and adopted mag for WR 102c. This resulted in an overestimated stellar bolometric luminosity. The new SINFONI data allow us to unambiguously identify WR 102c in the near-IR image (source 15 in Fig. 2) with Ks=11.6 mag, in agreement with the original report.
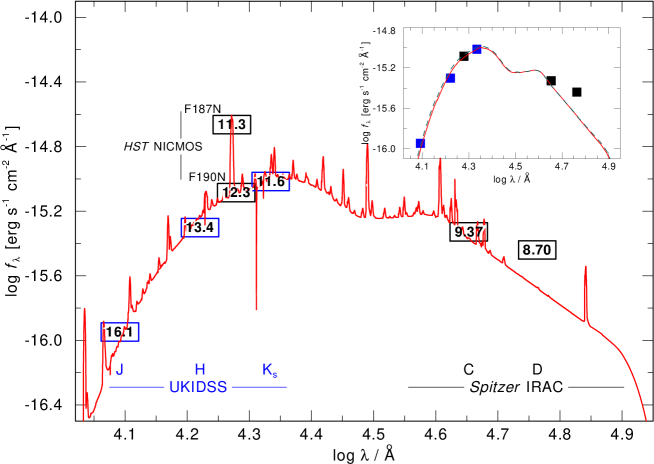
To put strong constraints on the stellar luminosity, we compared the model stellar spectral energy distribution (SED) with the available photometric and spectrophotometric data. The result is shown in Fig. 7. We used the available photometry of WR 102c from Spitzer IRAC (Churchwell et al., 2009), UKIDSS (Lucas et al., 2008), and HST NICMOS (Dong et al., 2011). The SED fitting then allows the luminosity and the interstellar extinction to be adjusted by adopting the distance modulus of mag. The observed photometry of WR 102c is nicely reproduced by a model with a bolometric luminosity of and the extinction mag, corresponding to mag. The alternative, slightly cooler model (kK) leads to and the same extinction. This is consistent with WR 102c being located in the GC region (e.g. Schultheis et al., 1999; Figer et al., 1999a).
WR 102c is highly reddened and, if present, anomalous extinction may lead to an uncertainty in the estimates of stellar luminosity. To investigate this problem we did a thorough check of the various reddening laws using and provided by the extinction functions of Moneti et al. (2001), Cardelli et al. (1989), and Fitzpatrick & Massa (2009). We found that the spectral energy distribution is best reproduced by an extinction of mag using the Moneti et al. (2001) and Cardelli et al. (1989) functions, while mag fits best for the Fitzpatrick & Massa (2009) function, resulting in the uncertainty in the luminosity .
As a next step, we varied the from the commonly used value by and for each of the three extinction laws. The curves were then scaled in luminosity to match the K-band photometry. However, in all cases the reddening using the standard value provides the best description of the stellar SED and matches the photometry marks better. Thus, we conclude that there are no reasons to suspect an anomalous reddening for WR 102c.
Our models predict that WR 102c produces [s-1] hydrogen ionising photons. This compares well with the value of derived from radio observations of the Sickle Nebula by Lang et al. (1997). Thus, although our revised number of ionising photons is lower than the value of Barniske et al. (2008), WR 102c can still be considered the main ionising source of the Sickle nebula. However, the Pa-image of the GC region (Fig. 1) does not show a fully ionised hole around WR 102c, in contrast to the region around the Quintuplet Cluster. This could mean that our WR star is located in the foreground of the Sickle nebula.
4.4 Evolutionary status of WR 102c
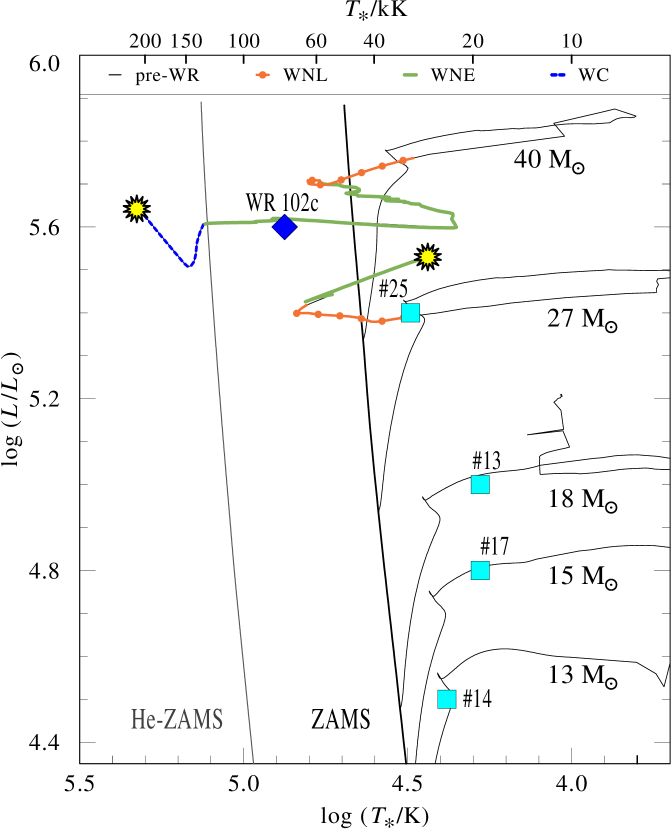
The derived stellar luminosity and temperature allow us to evaluate the evolutionary status of WR 102c. In Figure 8 the position of WR 102c in the HR diagram is compared with evolutionary tracks from Ekström et al. (2012) for rotating stars of solar metallicity. WR 102c is nicely located at the position of WNE stars on a track with an initial mass of . In the case of a rotating model, the age of WR 102c is Myr, while assuming evolution without rotation would yield Myr. Both estimates assume single star evolution. With its estimated age of Myr, WR 102c would have completed at least one orbit around the GC (Stolte et al., 2014).
Assuming single star evolution and taking into account the ratios between numbers of stars with different spectral types, Liermann et al. (2012, 2014) constrained the age of the Quintuplet Cluster to Myr. It was noticed that all WN stars in the Quintuplet have late spectral types (WN9h) and all WC stars have WC8-9 spectral types (Liermann et al., 2009). The evolutionary channels that lead to the production of late WC stars are not yet understood (see extensive discussion on this subject in Sander et al., 2012). The WC stars in the Quintuplet are severely enshrouded by dust (Moneti et al., 2001), and some of them are confirmed binaries (Tuthill et al., 2006). The importance of binary channels in the evolution of massive stars is well recognised (e.g. Vanbeveren et al., 2007). Schneider et al. (2014) used their binary evolution code to model the observed present-day mass functions of the Quintuplet Cluster and estimated its age as Myr if binary channels are included. Hence, within the uncertainties the age of WR 102c is comparable to the age of the Quintuplet Cluster
WR 102c is located pc () from the core of the Quintuplet Cluster. It is quite common for a massive star in the GC to reside outside of the three known large clusters (e.g. Cotera et al., 1999; Mauerhan et al., 2010; Dong et al., 2011). There are different scenarios that can explain the origin of these isolated massive stars, for example they might have been born in relative isolation, or ejected or tidally stripped from one of the three known clusters, or they might belong to clusters that have not been discovered yet.
It has recently been suggested by Lau et al. (2015) that the evolution of WR 102c may have been affected by binary interactions, and the star could have been ejected from the Quintuplet Cluster. However, based on our analysis the measured radial velocity of WR 102c is not outstanding and compares well with the average radial velocity of the Quintuplet stars ( km s-1, Liermann et al., 2012). Proper motion observations are required to establish the runaway status of WR 102c. On the other hand, Habibi et al. (2014) used their N-body simulations and showed that up to 80% of the isolated observed WR stars in the GC region could be explained by tidal striping. In particular, they estimate the age of the Quintuplet Cluster to 5 Myr and show that the projected tidal arms of this cluster may extend out to 60 pc in the direction of the Sagittarius B2 region. Given the age of WR 102c and its proximity to the Quintuplet Cluster, tidal stripping is able to explain the location of WR 102c.
There is, however, another possible evolutionary path for WR 102c. Our SINFONI data revealed four OB-type stars within a projected distance of 1 pc around WR 102c (see Sect. 5). Hence, it is possible that WR 102c was formed together with a its own cluster, independently from the Quintuplet Cluster (see Sect. 5.3).
5 Stars in the vicinity of WR 102c
5.1 Early-type stars
Among the 25 stellar sources detected in our SINFONI observations, we found four early-type stars (see Table 2). All of these objects have counterparts in the UKIDSS Galactic Plane Survey (Lucas et al., 2008); the cross-identifications are provided in Table 4.
The K-band spectra of these early-type stars are shown in Fig. 9. The radial velocities measured for each star are consistent with WR 102c within the uncertainties. The extinction to each early-type star was estimated from SED fitting, and was found to be similar to the extinction towards WR 102c. Thus, we conclude that the early-type stars in the WR 102c field are likely spatially related and might even be gravitationally bound.
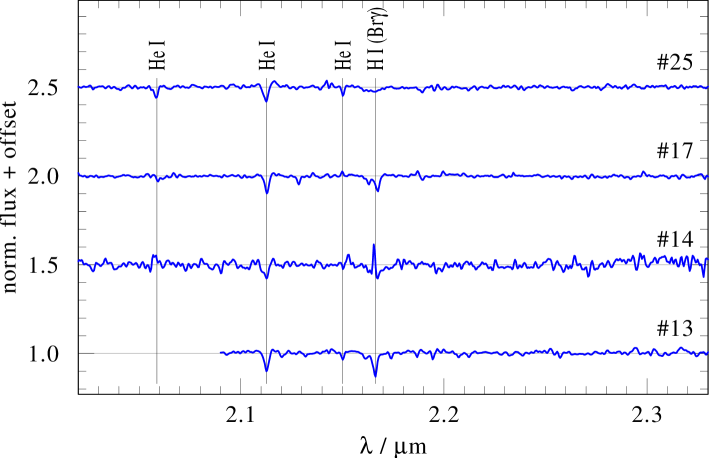
For the spectral classification, we use the near-IR spectral atlas of OB stars (Hanson et al., 1996, 2005). Source 25 is either a late O- or early B-type (super)giant. The other three objects are B-type stars. They hardly show any features in the K-band except for hydrogen Br and one or two He i lines (at m). Moreover, Br is contaminated by nebula emission. To overcome this contamination, we subtracted the background emission from the stellar spectra. Therefore, it is difficult to determine their spectral subtypes. Nevertheless, from the wings of Br their luminosity classes could be constrained.
We have determined the stellar parameters of the OB-type stars in the WR 102c cluster with tentative fits of the SED and the line spectra to PoWR models. The results are compiled in Table 5. Their initial masses were estimated from the comparison with evolutionary tracks in the the HR diagram (see Fig. 8).
| Source No. | ID from UKIDSS catalogue | |
|---|---|---|
| #13 | J174611.81-284906.5 | |
| #14 | J174611.34-284906.9 | |
| #17 | J174611.03-284903.9 | |
| #25 | J174610.87-284856.6 |
| Source No. | #13 | #14 | #17 | #25 |
|---|---|---|---|---|
| Spectral type | B1-3 V: | B?III: | B2:III? | O9: I: |
| 5.0 | 4.5 | 4.8 | 5.4 | |
| [kK] | 20 | 24 | 20: | 31: |
| 18: | 13: | 15 | 27: | |
| [km s-1] | 100 | 90 | 70 | 100 |
| [mag] | 2.8 | 2.9 | 2.9 | 2.9 |
5.2 Late-type stars
In addition to the early-type stars, many point sources with late-type spectra are present in the field. The temperatures were estimated from the equivalent width of the 12CO (2-0) band at m following González-Fernández et al. (2008). On the same basis we determined the spectral types. The luminosity classes were ranked on the basis of the CO index (Blum et al., 1996, 2003). The extinction was obtained from comparison of MARCS models (Gustafsson et al., 2008) with the measured photometric values in the infrared (Lucas et al., 2008; Ramírez et al., 2008; Churchwell et al., 2009; Dong et al., 2011). The distance modulus was then inferred from this extinction by comparison with the curves published by Schultheis et al. (2014), which then also implies the luminosity. The parameters of late-type stars are given in Table 6.
| No. | MK | lum. | ||||
|---|---|---|---|---|---|---|
| [mag] | [mag] | [kpc] | [] | type | class | |
| #1 | 2.9 | 8.4 | 8.0 | 2.8 | M0 | II |
| #2 | 2.2 | 6.3 | 5.8 | 2.1 | M1 | III |
| #3 | 2.1 | 6.0 | 5.5 | 1.7 | K1 | III |
| #4 | 2.1 | 6.0 | 5.5 | 1.5 | K4 | III |
| #5 | 3.3 | 9.5 | 8.1 | 2.7 | M0 | II |
| #6 | 2.9 | 8.3 | 8.0 | 2.7 | M0 | II |
| #7 | 2.9 | 8.3 | 8.0 | 2.2 | K5 | III |
| #8 | 2.8 | 8.0 | 8.0 | 2.3 | K4 | II |
| #9 | 1.9 | 5.6 | 5.3 | 1.8 | M0 | III |
| #10 | 2.9 | 8.3 | 8.0 | 3.6 | M5-6 | I |
| #11 | 2.9 | 8.2 | 8.0 | 2.6 | K5 | II |
| #12 | 2.8 | 8.0 | 8.0 | 3.0 | M1 | II |
| #16 | 2.6 | 7.5 | 7.3 | 3.1 | K0 | II |
| #18 | 2.8 | 8.0 | 8.0 | 2.3 | K3 | III |
| #19 | 2.2 | 6.3 | 5.8 | 1.9 | K5 | III |
| #20 | 2.0 | 5.7 | 6.2 | 1.5 | K5 | III |
| #21 | 2.5 | 7.3 | 7.2 | 1.8 | M0 | III |
| #22 | 2.5 | 7.3 | 7.2 | 2.1 | M0 | III |
| #23 | 2.2 | 6.3 | 5.8 | 1.9 | K4 | III |
| #24 | 2.2 | 6.3 | 5.8 | 1.9 | K2 | III |
The brightest star in the field (no. 10 in Table 2 and Fig. 2) is an M5-6I red supergiant. It is similar to the other late-type stars; we obtained its spectrum and fitted the SED as shown in Figure 10. The extinction and luminosity suggest that the star most likely resides in the GC region. On the other hand, its radial velocity ( km s-1) is at odds with the radial velocities of early-type stars in this region ( km s-1). The position of star 10 in the HRD would place it on a track for an initial mass of 9 . Such a star would require more than 10 Myr to evolve to the RSG phase.
Thus, we believe that, like other late-type stars in our SINFONI field, star 10 does not belong to the WR 102c cluster, but instead represents a previous episode of star formation in the GC region. This is similar to the conclusion reached by Liermann et al. (2012) from their analysis of the Quintuplet Cluster.
5.3 WR 102c star cluster
The presence of early-type stars within 0.9 pc of WR 102c may indicate that these objects represent an independent cluster. Alternatively, the WR 102c cluster may be related to the same starburst that produced the Quintuplet Cluster. Yet another possibility is that all the early-type stars close to WR 102c are part of the Quintuplet’s tidal tail. Such tails have been predicted by Habibi et al. (2014) for the Arches and Quintuplet with extensions up to pc from the cluster centre. In any case, the presence of a cluster around WR 102c seems to be inconsistent with the scenario that WR 102c was born in the Quintuplet and ejected from there.
We used the publicly available cluster evolution code McLuster (Küpper et al., 2011) to estimate the mass of the WR 102c cluster. Assuming a standard Kroupa IMF (Kroupa, 2001), the mass of the WR 102c cluster is . The simulation accurately reproduces the mass of the most massive star and the number of early-type stars we observed. Given the sensitivity of our observations ( mag) we were able to detect only stars earlier than B1-2, i.e. with masses above .
Adopting an enclosed mass of and a characteristic cluster radius pc we estimate the velocity dispersion within the cluster stars to be only a few km s-1 (following equation 1 in Kroupa, 2002). In summary, the number of early-type stars, their ages, masses, and radial velocities consistently agree with these objects being the brightest members of a yet unknown star cluster.
6 Summary and conclusions
Using VLT SINFONI we obtained integral field observations of 0.25 square arcmin area around WR 102c located at pc (projected distance) from the Quintuplet Cluster in the GC region.
We identified five early-type stars (including WR 102c) in this field. Based on their age, radial velocity, and mass distribution we suggest that these are the most massive members of a bound WR 102c cluster with . The existence of such a cluster questions the ejection scenario for the present day location of WR 102c.
The detailed analysis of the stellar spectrum and photometry of WR 102c by means of non-LTE stellar atmosphere PoWR models yielded stellar and wind parameters typical for a WN6 star (Table 3). The uncertainty of the deduced stellar parameters of WR 102c is mild and might reflect some departures of stellar wind from spherical symmetry, e.g. due to the fast rotation or binarity.
We produced a map of diffuse Br emission in the region around WR 102c. Our data clearly show a bipolar or ring-shaped nebula centred on WR 102c. The same nebula is clearly seen in the images from the HST Paschen- survey of the GC. According to the spectra of the nebula, the projected expansion velocity is small. We suggest that the WR 102c nebula is a typical WR nebula formed recently as the result of the interaction of winds at different evolutionary stages.
Acknowledgments
This work has extensively used the NASA/IPAC Infrared Science Archive, the NASA Astrophysics Data System, and the SIMBAD database, operated at CDS, Strasbourg, France. This publication makes use of data products from the Two Micron All Sky Survey, which is a joint project of the University of Massachusetts and the Infrared Processing and Analysis Center/California Institute of Technology, funded by the National Aeronautics and Space Administration and the National Science Foundation. Some of the data presented in this paper were retrieved from the Mikulski Archive for Space Telescopes (MAST). STScI is operated by the Association of Universities for Research in Astronomy, Inc., under NASA contract NAS5-26555. Support for MAST for non-HST data is provided by the NASA Office of Space Science via grant NNX09AF08G and by other grants and contracts. We are grateful to Dr. R. Lau for sharing with us the preprint of his paper. We thank the referee for the useful comments and suggestions. Funding for this research has been provided by DLR grant 50 OR 1302 (LMO) and DFG grant HA 1455/26 (AS).
References
- Barniske et al. (2008) Barniske, A., Oskinova, L. M., & Hamann, W. 2008, A&A, 486, 971
- Blum et al. (2003) Blum, R. D., Ramírez, S. V., Sellgren, K., & Olsen, K. 2003, ApJ, 597, 323
- Blum et al. (1996) Blum, R. D., Sellgren, K., & Depoy, D. L. 1996, AJ, 112, 1988
- Bonnet et al. (2004) Bonnet, H., Abuter, R., Baker, A., et al. 2004, The Messenger, 117, 17
- Burgemeister et al. (2013) Burgemeister, S., Gvaramadze, V. V., Stringfellow, G. S., et al. 2013, MNRAS, 429, 3305
- Cardelli et al. (1989) Cardelli, J. A., Clayton, G. C., & Mathis, J. S. 1989, ApJ, 345, 245
- Churchwell et al. (2009) Churchwell, E., Babler, B. L., Meade, M. R., et al. 2009, PASP, 121, 213
- Cotera et al. (1999) Cotera, A. S., Simpson, J. P., Erickson, E. F., et al. 1999, ApJ, 510, 747
- Dong et al. (2015) Dong, H., Mauerhan, J., Morris, M. R., Wang, Q. D., & Cotera, A. 2015, MNRAS, 446, 842
- Dong et al. (2011) Dong, H., Wang, Q. D., Cotera, A., et al. 2011, MNRAS, 417, 114
- Eisenhauer et al. (2003) Eisenhauer, F., Abuter, R., Bickert, K., et al. 2003, in Society of Photo-Optical Instrumentation Engineers (SPIE) Conference Series, Vol. 4841, Society of Photo-Optical Instrumentation Engineers (SPIE) Conference Series, ed. M. Iye & A. F. M. Moorwood, 1548–1561
- Ekström et al. (2012) Ekström, S., Georgy, C., Eggenberger, P., et al. 2012, A&A, 537, A146
- Figer et al. (1999a) Figer, D. F., Kim, S. S., Morris, M., et al. 1999a, ApJ, 525, 750
- Figer et al. (1999b) Figer, D. F., McLean, I. S., & Morris, M. 1999b, ApJ, 514, 202
- Fitzpatrick & Massa (2009) Fitzpatrick, E. L. & Massa, D. 2009, ApJ, 699, 1209
- Flagey et al. (2011) Flagey, N., Noriega-Crespo, A., Billot, N., & Carey, S. J. 2011, ApJ, 741, 4
- Freyer et al. (2006) Freyer, T., Hensler, G., & Yorke, H. W. 2006, ApJ, 638, 262
- Garcia-Segura & Mac Low (1995) Garcia-Segura, G. & Mac Low, M.-M. 1995, ApJ, 455, 160
- González-Fernández et al. (2008) González-Fernández, C., Cabrera-Lavers, A., Hammersley, P. L., & Garzón, F. 2008, A&A, 479, 131
- Gräfener et al. (2002) Gräfener, G., Koesterke, L., & Hamann, W.-R. 2002, A&A, 387, 244
- Gräfener et al. (2012) Gräfener, G., Vink, J. S., Harries, T. J., & Langer, N. 2012, A&A, 547, A83
- Gustafsson et al. (2008) Gustafsson, B., Edvardsson, B., Eriksson, K., et al. 2008, A&A, 486, 951
- Gvaramadze et al. (2014) Gvaramadze, V. V., Chené, A.-N., Kniazev, A. Y., et al. 2014, MNRAS, 442, 929
- Gvaramadze et al. (2009) Gvaramadze, V. V., Fabrika, S., Hamann, W.-R., et al. 2009, MNRAS, 400, 524
- Habibi et al. (2014) Habibi, M., Stolte, A., & Harfst, S. 2014, A&A, 566, A6
- Hainich et al. (2014) Hainich, R., Rühling, U., Todt, H., et al. 2014, A&A, 565, A27
- Hamann & Gräfener (2004) Hamann, W.-R. & Gräfener, G. 2004, A&A, 427, 697
- Hamann et al. (2006) Hamann, W.-R., Gräfener, G., & Liermann, A. 2006, A&A, 457, 1015
- Hamann & Koesterke (1998a) Hamann, W.-R. & Koesterke, L. 1998a, A&A, 335, 1003
- Hamann & Koesterke (1998b) Hamann, W.-R. & Koesterke, L. 1998b, A&A, 333, 251
- Hanson et al. (1996) Hanson, M. M., Conti, P. S., & Rieke, M. J. 1996, ApJS, 107, 281
- Hanson et al. (2005) Hanson, M. M., Kudritzki, R.-P., Kenworthy, M. A., Puls, J., & Tokunaga, A. T. 2005, ApJS, 161, 154
- Homeier et al. (2003) Homeier, N. L., Blum, R. D., Pasquali, A., Conti, P. S., & Damineli, A. 2003, A&A, 408, 153
- Houck et al. (2004) Houck, J. R., Roellig, T. L., van Cleve, J., et al. 2004, ApJS, 154, 18
- Ignace et al. (2000) Ignace, R., Oskinova, L. M., & Foullon, C. 2000, MNRAS, 318, 214
- Kroupa (2001) Kroupa, P. 2001, MNRAS, 322, 231
- Kroupa (2002) Kroupa, P. 2002, MNRAS, 330, 707
- Küpper et al. (2011) Küpper, A. H. W., Maschberger, T., Kroupa, P., & Baumgardt, H. 2011, MNRAS, 417, 2300
- Lang et al. (1997) Lang, C. C., Goss, W. M., & Wood, O. S. 1997, ApJ, 474, 275
- Lau et al. (2015) Lau, R. M., Hankins, M. J., Herter, T. L., et al. 2015, ArXiv e-prints
- Law & Yusef-Zadeh (2004) Law, C. & Yusef-Zadeh, F. 2004, ApJ, 611, 858
- Liermann et al. (2009) Liermann, A., Hamann, W., & Oskinova, L. M. 2009, A&A, 494, 1137
- Liermann et al. (2012) Liermann, A., Hamann, W.-R., & Oskinova, L. M. 2012, A&A, 540, A14
- Liermann et al. (2014) Liermann, A., Hamann, W.-R., & Oskinova, L. M. 2014, A&A, 563, C2
- Liermann et al. (2010) Liermann, A., Hamann, W.-R., Oskinova, L. M., Todt, H., & Butler, K. 2010, A&A, 524, A82
- Lucas et al. (2008) Lucas, P. W., Hoare, M. G., Longmore, A., et al. 2008, MNRAS, 391, 136
- Marston et al. (1999) Marston, A. P., Welzmiller, J., Bransford, M. A., Black, J. H., & Bergman, P. 1999, ApJ, 518, 769
- Mauerhan et al. (2010) Mauerhan, J. C., Cotera, A., Dong, H., et al. 2010, ApJ, 725, 188
- Mauerhan et al. (2011) Mauerhan, J. C., Van Dyk, S. D., & Morris, P. W. 2011, AJ, 142, 40
- Moneti et al. (2001) Moneti, A., Stolovy, S., Blommaert, J. A. D. L., Figer, D. F., & Najarro, F. 2001, A&A, 366, 106
- Oskinova (2005) Oskinova, L. M. 2005, MNRAS, 361, 679
- Oskinova et al. (2007) Oskinova, L. M., Hamann, W.-R., & Feldmeier, A. 2007, A&A, 476, 1331
- Oskinova et al. (2003) Oskinova, L. M., Ignace, R., Hamann, W.-R., Pollock, A. M. T., & Brown, J. C. 2003, A&A, 402, 755
- Oskinova et al. (2013) Oskinova, L. M., Steinke, M., Hamann, W.-R., et al. 2013, MNRAS, 436, 3357
- Oskinova et al. (2011) Oskinova, L. M., Todt, H., Ignace, R., et al. 2011, MNRAS, 416, 1456
- Ramírez et al. (2008) Ramírez, S. V., Arendt, R. G., Sellgren, K., et al. 2008, ApJS, 175, 147
- Reid (1993) Reid, M. J. 1993, ARA&A, 31, 345
- Sander et al. (2012) Sander, A., Hamann, W.-R., & Todt, H. 2012, A&A, 540, A144
- Sander et al. (2015) Sander, A., Shenar, T., Hainich, R., et al. 2015, A&A, 577, A13
- Schmutz et al. (1989) Schmutz, W., Hamann, W.-R., & Wessolowski, U. 1989, A&A, 210, 236
- Schneider et al. (2014) Schneider, F. R. N., Izzard, R. G., de Mink, S. E., et al. 2014, ApJ, 780, 117
- Schultheis et al. (2014) Schultheis, M., Chen, B. Q., Jiang, B. W., et al. 2014, A&A, 566, A120
- Schultheis et al. (1999) Schultheis, M., Ganesh, S., Simon, G., et al. 1999, A&A, 349, L69
- Shenar et al. (2014) Shenar, T., Hamann, W.-R., & Todt, H. 2014, A&A, 562, A118
- Skrutskie et al. (2006) Skrutskie, M. F., Cutri, R. M., Stiening, R., et al. 2006, AJ, 131, 1163
- Stolte et al. (2014) Stolte, A., Hußmann, B., Morris, M. R., et al. 2014, ApJ, 789, 115
- Toalá & Arthur (2011) Toalá, J. A. & Arthur, S. J. 2011, ApJ, 737, 100
- Toalá et al. (2015) Toalá, J. A., Guerrero, M. A., Ramos-Larios, G., & Guzmán, V. 2015, A&A, 578, A66
- Todt et al. (2015) Todt, H., Sander, A., Hainich, R., et al. 2015, A&A, 579, A75
- Tuthill et al. (2006) Tuthill, P., Monnier, J., Tanner, A., et al. 2006, Science, 313, 935
- van Dokkum (2001) van Dokkum, P. G. 2001, PASP, 113, 1420
- van Marle et al. (2007) van Marle, A. J., Langer, N., & García-Segura, G. 2007, A&A, 469, 941
- Vanbeveren et al. (2007) Vanbeveren, D., Van Bever, J., & Belkus, H. 2007, ApJ, 662, L107
- Vink et al. (2011) Vink, J. S., Gräfener, G., & Harries, T. J. 2011, A&A, 536, L10
- Wachter et al. (2010) Wachter, S., Mauerhan, J. C., Van Dyk, S. D., et al. 2010, AJ, 139, 2330
- Wang et al. (2010) Wang, Q. D., Dong, H., Cotera, A., et al. 2010, MNRAS, 402, 895
- Wang et al. (2006) Wang, Q. D., Dong, H., & Lang, C. 2006, MNRAS, 371, 38