Discovery of a variable X-ray counterpart to HESS J1832093: A new gamma-ray binary?
Abstract
The TeV -ray point source HESS J1832093 remains unidentified despite extensive multi-wavelength studies. The -ray emission could originate in a very compact pulsar wind nebula or an X-ray binary system composed of the X-ray source XMMU J1832450921539 and a companion star (2MASS J183245160921545). To unveil the nature of XMMU J1832450921539 and its relation to HESS J1832093, we performed deeper follow-up observations in X-rays with Chandra and Swift to improve source localisation and to investigate time variability. We observed an increase of the X-ray flux by a factor 6 in the Chandra data compared to previous observations. The source is point-like for Chandra and its updated position is only 0.3′′ offset from 2MASS J183245160921545, confirming the association with this infrared source. Subsequent Swift ToO observations resulted in a lower flux, again compatible with the one previously measured with XMM-Newton, indicating a variability timescale of the order of two months or shorter. The now established association of XMMU J1832450921539 and 2MASS J183245160921545 and the observed variability in X-rays are strong evidence for binary nature of HESS J1832093. Further observations to characterise the optical counterpart as well as to search for orbital periodicity are needed to confirm this scenario.
keywords:
acceleration of particles – radiation mechanisms: non-thermal – X-rays: binaries – gamma-rays: general1 Introduction
Extensive observations of the Galactic plane with the High Energy Stereoscopic System (H.E.S.S.) have resulted in the detection of a new population of faint -ray sources at TeV energies. However, the lack of statistics and/or multi-wavelength (MWL) counterparts often prevent a firm identification of those sources. This is the case of HESS J1832093, a TeV point source close to the Galactic plane recently discovered by H.E.S.S. (H.E.S.S. Collaboration et al., 2015a). The TeV spectrum is well described by a powerlaw model with a photon index of and an integrated photon flux of cm-2s-1 (H.E.S.S. Collaboration et al., 2015a). Nearly all Galactic sources seen with H.E.S.S. are extended beyond the instrument’s point spread function (PSF) and appear to be mostly related to supernova remnants (SNRs) or pulsar wind nebulae (PWNe). Galactic TeV point sources are rather rare and are usually associated with gamma-ray binaries, but can also stem from young compact PWNe, as is the case for G0.90.1 (Aharonian et al., 2005a), or even from a background Active Galactic Nucleus (AGN) such as HESS J1943213 (Abramowski et al., 2011). Only five systems are firmly identified as TeV gamma-ray binaries so far: PSR B125963, LS 5039, LSI61 303, HESS J0632+057 and 1FGL J1018.6-5856 (Aharonian et al., 2005b, 2006; Albert et al., 2009; Aharonian et al., 2007; H.E.S.S. Collaboration et al., 2015b). It is interesting to note that the latter two systems were first discovered in GeV and/or TeV gamma-rays and were only confirmed later at lower energies through deep follow-up observations. All these systems are high-mass X-ray binaries (HMXBs), consisting of a compact object orbiting a massive companion O or Be type star. Moreover, these sources generally exhibit a peak in their broad-band spectral energy distribution (SED) at MeV-GeV energies, except for HESS J0632+057 which is not detected in this energy band (Caliandro et al., 2013).
A search for MWL counterparts was performed to identify the origin of HESS J1832093. This region was observed in 2011 with XMM-Newton and a hard, highly absorbed X-ray point source was discovered (XMMU J1832450921539), coincident in position with the TeV emission (H.E.S.S. Collaboration et al., 2015a). Furthermore, the infrared (IR) source 2MASS J183245160921545 (, , ) is located 1.9′′ offset from the XMM-Newton position, compatible within statistical uncertainties, indicating a potential association. The chance probability for such a coincidence is estimated to be 2% (H.E.S.S. Collaboration et al., 2015a). A power-law model fit to the X-ray spectrum of XMMU J1832450921539 resulted in a photon index of , a column density of and an unabsorbed energy flux of . Such a spectral shape suggested a pulsar nature for XMMU J1832450921539 despite the lack of detected pulsations. Another possibility is that the X-ray source could originate from the unresolved compact core of an extended PWN. However, in the absence of an extended X-ray nebula and/or detected pulsations from XMMU J1832450921539 this scenario could not be confirmed.
On the other hand, the presence of the IR point source only 1.9′′ offset from XMMU J1832450921539 could indicate that the compact object resides in a binary system with a stellar companion. Another argument in favor of this scenario could be the high column density measured for XMMU J1832450921539 which is about a factor 10 larger than the total Galactic value seen in HI ( Dickey & Lockman, 1990) in the direction of the source. Such large column densities may be present in HMXBs due to local material from the dense stellar companion wind or from Be circumstellar discs, as observed for several HMXBs in the Galaxy (Morris et al., 2009) and the Small Magellanic Cloud (Eger & Haberl, 2008). However, the absence of an optical counterpart to 2MASS J183245160921545, at least down to magnitudes of 18, as evidenced by the lack of entries in the USNO 2.0 catalog (Monet, 1998) within 20′′, could also indicate strong interstellar extinction/absorption along this particular line of sight. This may be an alternative explanation for the strong absorption seen from XMMU J1832450921539. Furthermore, given the low level of count statistics available, no evidence for variability could be found in the H.E.S.S. or XMM-Newton data which would support the binary scenario.
Alternatively, the X-ray/TeV source could be associated with an AGN located behind the Galactic plane. Here the large column density could arise from material in the host galaxy or in the local environment of the AGN.
To determine the nature of XMMU J1832450921539, we observed this source again with Chandra in July 2015. Its superior angular resolution allows us to probe for smaller source extensions to search for the presence of an X-ray nebula which would confirm the PWN scenario. Also, Chandra’s unprecedented accuracy in absolute astrometry allows us to further investigate the potential association of XMMU J1832450921539 with the 2MASS counterpart. The new Chandra results are described in Section 2 and strengthen a gamma-ray binary interpretation for HESS J1832093. Following up on these results, we asked for two Swift target of opportunity (ToO) observations in September 2015, which are presented in Section 3. Finally we discuss the results obtained in the context of the binary scenario in Section 4.
2 Chandra observation
We observed XMMU J1832450921539 with Chandra on July 6, 2015, for 18.2 ks with the ACIS-I (Garmire et al., 2003) camera (ObsID: 16737, P.I.: H. Laffon). To improve the timing resolution to 0.5 s (down from 3.0 s in regular mode) the ACIS-I chips were operated in the 1/8 subarray configuration. For the analysis of the Chandra data we used the CIAO software version 4.7, supported by tools from the FTOOLS package (Blackburn, 1995) and XSPEC version 12.8.1g for spectral modeling (Arnaud, 1996). We reprocessed the event1 data with the latest calibration version (CALDB 4.6.9) using chandra_repro. The background level in this dataset is very low and the standard good-time-intervals (GTIs) provided by the analysis chain encompass the full exposure time.
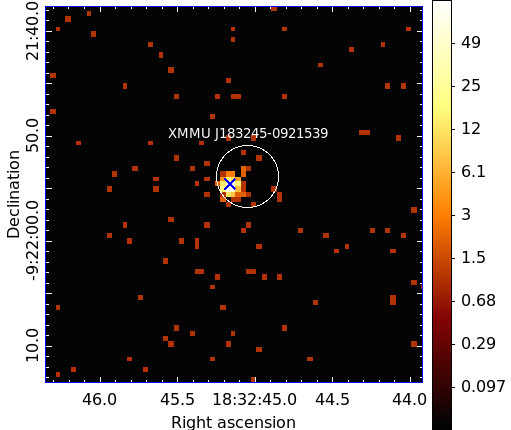
Figure 1 shows the Chandra counts map (0.3–10.0 keV), zoomed in on the region of XMMU J1832450921539. The source is clearly detected within the positional uncertainty of the original XMM-Newton detection. The source detection method celldetect results in a position of . This location is now compatible with the infrared counterpart 2MASS J183245160921545 within 0.3′′, with a chance coincidence probability of only 0.3%, and hence confirms this identification.
| Instrument | MJD | counts | (2-10 keV)(∗) | ||
|---|---|---|---|---|---|
| (days) | ( cm-2) | ( erg cm-2s-1) | |||
| Swift | 54524 | 153.5 | 1.0 | ||
| XMM-Newton (∗∗) | 55633 | – | 10.5 | 1.3 | 0.69 |
| Swift | 55876 | 21.4 | |||
| Chandra | 57209 | 41620 | 9.5 | 1.5 | 4.2 |
| Swift | 57285 | 266 | 1.4 | ||
| Swift | 57291 | 245 | 1.2 |
The fit results above are for an absorbed powerlaw model.
Parameters kept fixed in the fit are marked with the ’’ sign.
(∗)Unabsorbed integrated energy flux.
(∗∗)Results taken from H.E.S.S.
Collaboration et al. (2015a); number of counts not available, data not analysed in this work.
2.1 Spectral analysis
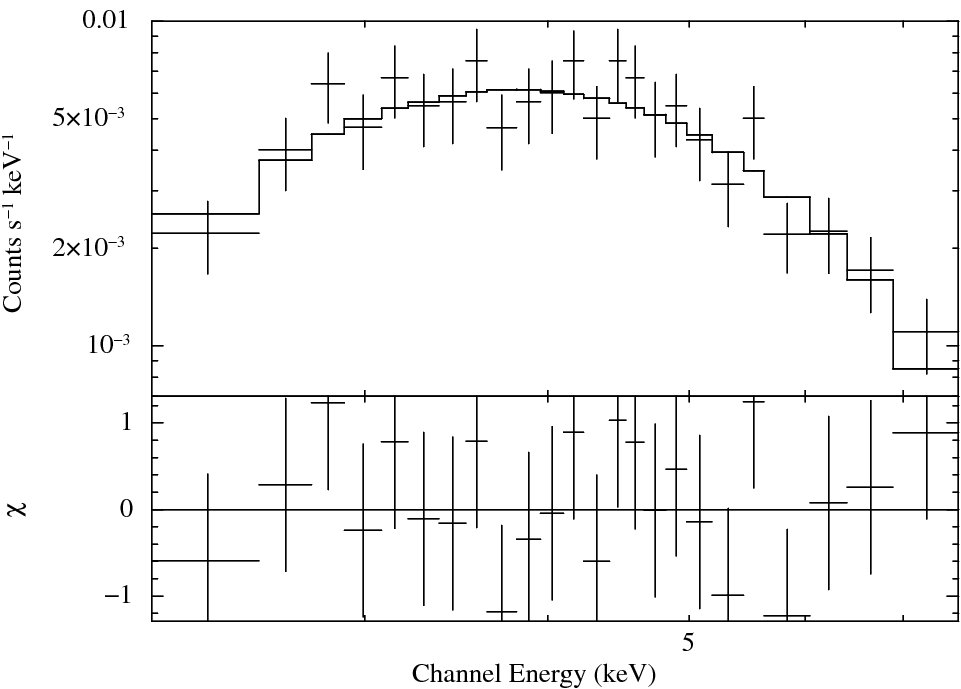
For the spectral analysis we extracted the source counts from a circular region, centered on the celldetect position, with a radius of 4′′, and the background counts from a nearby source-free region. To extract the spectra and response files we used the CIAO tool specextract with a point-like source assumption. We fit the spectrum using XSPEC with an absorbed powerlaw model. To account for the interstellar photo-electric absorption we used the tbabs model along with the Galactic metal abundances from Wilms et al. (2000). The spectrum with the best-fit model is shown in Fig. 2, and the fit results are listed in Tab. 1. The powerlaw model provides a very good fit (). The column density and photon index are compatible within statistical uncertainties with the previous XMM-Newton measurement (H.E.S.S. Collaboration et al., 2015a). However, the flux is a factor of 6 higher, indicating significant variability compared to the earlier observation in 2011. The spectrum is similarly well described by an absorbed thermal plasma model (MEKAL, ). However, the best-fit temperature is unrealistically large: keV.
Due to the very limited field of view of the 1/8 subarray configuration and the dithering motion of the Chandra spacecraft, the source position was located outside the active detector area for a significant fraction of the exposure time. Therefore, the total number of 416 counts in the source region is about a factor of 4 lower than one would expect for an 18 ks ACIS-I observation, given the flux. This effect is automatically taken into account in the GTIs and we note this here only to avoid confusion when comparing the derived flux with the total number of counts for a 18 ks Chandra observation.
2.2 Source morphology
To investigate the source morphology of XMMU J1832450921539 in detail we simulated the telescope point-spread-function (PSF) using the Chandra raytracing simulator ChaRT (Carter et al., 2003). As inputs we provided the exact detector position and photon energy distribution of XMMU J1832450921539 as seen with Chandra. We then reprojected the simulated PSF onto the detector-plane with the tool MARX. Using the CIAO tool srcextent we compared the counts image to the simulated PSF image and determined that the source is not significantly extended for Chandra. The derived upper limit for the intrinsic source size is 0.28′′ (90% confidence).
2.3 Timing analysis
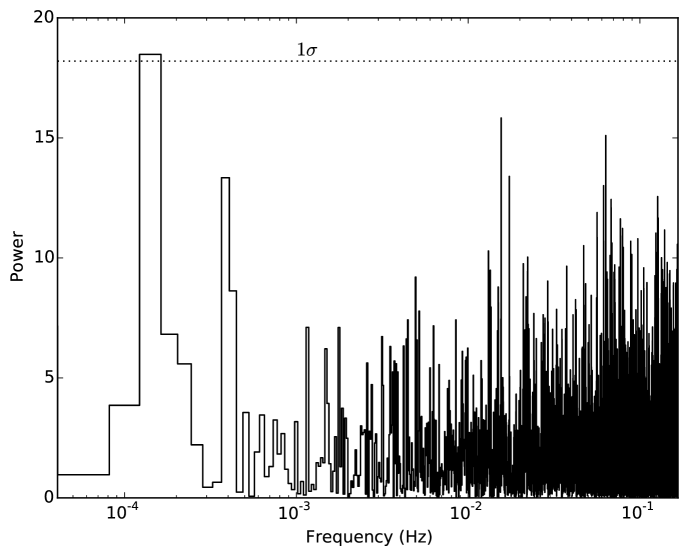
The detection of pulsations from XMMU J1832450921539 would proof its nature as a pulsar and provide a wealth of information regarding the origin of the TeV and X-ray emission. For the timing analysis we extracted the 0.3–10 keV light curve from the same region that was used for the spectral analysis (see Sect. 2.1) with a binning of 0.5 s, corresponding to the time resolution of the ACIS-I detector in the 1/8 subarray configuration. To search for pulsed emission we computed the Fast-Fourier-Transform (FFT) of the light curve using the FTOOL powspec (see Fig. 3). For the evaluation of the significance of the peaks in power we simulated 10000 light curves of steady sources with the same number of counts and live time, taking also the gaps in exposure due to the Chandra dithering motion into account. From the distribution of the maximum power reached in these simulated light curves we derived the 1,2, and 3 confidence levels for the detection of pulsations at powers of 18.2, 22.7, and 25.9, respectively. As can be seen in Fig. 3, no significant pulsations are detected at any frequency accessible with the current Chandra dataset.
To estimate the limit on the pulsed fraction that can be derived from the new Chandra data, we simulated light curves consisting of a flat, unpulsed and a sinusoidal component, again with the same number of counts and time exposure characteristics as in the Chandra data. We varied the ratio between the number of counts in the flat and periodic components between 0% and 100% (with 5% increments), using pulse periods of 1 s, 10 s, 100 s, and 1000 s. We compared the mean power at the simulated frequency in the FFT power spectra from 1000 simulated light curves for each parameter combination to the 3 (99% confidence) level derived from the simulated unpulsed light curves (see previous paragraph). We defined the limit at that pulsed fraction for which the mean power in the simulated light curves falls below the 3 level derived from steady sources. Table 2 summarises the upper limits derived in this way for the pulsed fractions at the various pulse periods.
| period | pulsed fraction |
|---|---|
| (s) | |
| 1 | 45% |
| 10 | 40% |
| 100 | 40% |
| 1000 | 45% |
3 Swift-XRT observations
XMMU J1832450921539 was serendipitously observed with Swift twice in the past. Following up on the flux increase measured with Chandra we asked for two additional dedicated Swift-XRT ToO observations in September 2015, spaced by 6 days. All observations are summarised in Tab. 3. For the analysis of the Swift-XRT data we used the HEASOFT software package version 6.15 together with the XRT calibration database (CALDB) version 20150721. We reprocessed the data using xrtpipeline and provided the resulting cleaned level 2 events (grades 0-12) as input to XSELECT for spectral extraction. To extract the source spectra we used a circular region with a radius of 47′′ centered on XMMU J1832450921539. For the background spectra we defined a concentric annular region with inner and outer radii of 94′′ and 188′′, respectively. As detector response we used the appropriate file from CALDB (swxpc0to12s6_20010101v014.rmf) and produced a custom effective area file using xrtmkarf.
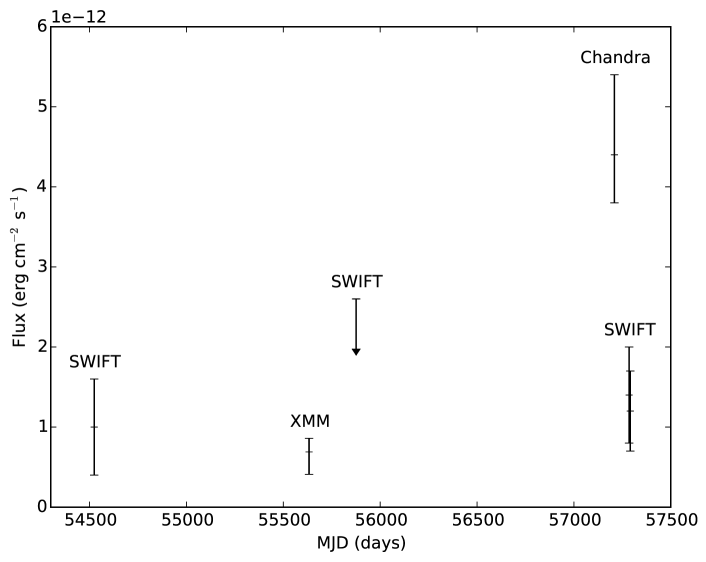
We fitted the spectra with XSPEC assuming an absorbed powerlaw model with all parameters fixed at their best-fit values from the XMM-Newton and Chandra analyses, except for the flux normalisation. XMMU J1832450921539 is detected in three Swift-XRT observations, and we calculated an upper limit (99% confidence) for the fourth, very short (563 ks) observation, assuming the same spectral shape. The results are compiled in Tab. 1 and we show the evolution of the 2-10 keV energy flux with time in Fig. 4. All Swift-XRT flux measurements are compatible within uncertainties with the low-state flux seen with XMM-Newton, including the ToO observations that started 76 days after the Chandra detection of XMMU J1832450921539 in the high-flux state. Therefore, the source appears to be variable on timescales of 2 months or less.
| MJD | sequence | exposure |
|---|---|---|
| (days) | no. | (s) |
| 54524 | 36174001 | 2409 |
| 55876 | 44300001 | 563 |
| 57285(∗) | 34056001 | 2610 |
| 57291(∗) | 34056002 | 2837 |
All data in photon counting (PC) mode
(∗)new ToO observations following the Chandra result.
4 Discussion
We observed an increase of a factor 6 in the X-ray flux of the source XMMU J1832450921539 during the Chandra observation (see Fig. 4). Moreover, the source is point-like for Chandra and can only be extended at the sub-arcsecond level. Furthermore, its position is now determined with unprecedented accuracy and is only 0.3′′ offset from the potential IR counterpart 2MASS J183245160921545 which could be the companion star of XMMU J1832450921539. Therefore the new Chandra results provide strong evidence in favor of a binary origin of HESS J1832093. Except for the flux, the other spectral parameters (powerlaw index, column density) do not show any significant change compared to previous observations. We note, however, that the statistical uncertainties of the column density in the new Chandra data are relatively large, and the non-detection of significant variability in this parameter may be due to a lack of sufficient statistics. Such differences are expected along the orbit of a binary system and were observed e.g. for HESS J0632057 (Aliu et al., 2014). Alternatively, the large column density could also arise from additional interstellar molecular material in the Galactic plane, not traced by HI measurements.
Also, it is currently not yet excluded that the gamma-ray/X-ray source is associated with an extragalactic object such as an AGN, being also an alternative explanation for the very large column density measured in X-rays. In this case, the IR emission would come from dust in the host galaxy and the X-ray and gamma-ray emission would be produced by inverse Compton scattering of accelerated particles in the jet. The additional absorption component may arise from interstellar material in the host galaxy or from matter in direct vicinity of the black hole. As already discussed by H.E.S.S. Collaboration et al. (2015a), due to the hard X-ray spectrum such an AGN should be most likely a flat spectrum radio quasar (FSRQ) (see, e.g. Padovani et al., 1997). One drawback of this scenario is the fact that one would also expect to see high-energy emission in the GeV band from inverse Compton scattering. However, there is no source in the Fermi-LAT 3FGL catalog at this position and an upper limit of in the energy band was derived in H.E.S.S. Collaboration et al. (2015a). Furthermore, the measured spectral index in the VHE gamma-ray regime (=2.6, H.E.S.S. Collaboration et al., 2015a) would be much harder than observed from any other FSRQ in this energy range, such as PKS 1510089 (H.E.S.S. Collaboration et al., 2013) and PKS 122221 (Aleksić et al., 2011). If the origin of the emission from HESS J1832093 is indeed extragalactic, this would be a very unusual object, belonging to a yet unknown class of VHE gamma-ray emitting AGN.
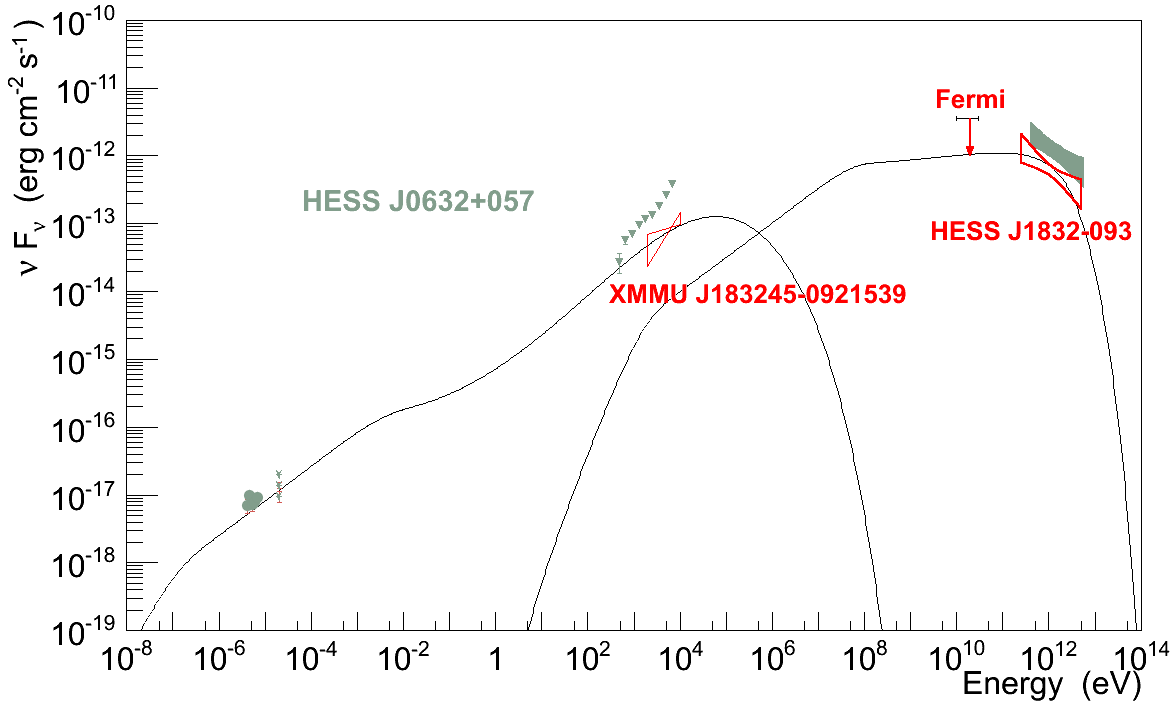
Since the MWL features of HESS J1832093 do not resemble commonly observed extragalactic sources, we assume in the following that the source originates in a Galactic binary system. We note that there is only one object firmly identified as a gamma-ray binary which does not exhibit any GeV emission: HESS J0632057 (Caliandro et al., 2013). Interestingly, the TeV and X-ray spectra as well as the overall flux level seen from HESS J1832093 are remarkably similar to this TeV gamma-ray binary. To demonstrate this similarity, we compare the SEDs for both sources in Fig. 5. The X-ray data shown for both sources are from XMM-Newton observations during which the sources were in a low-flux state. The model curve overplotted is a one-zone time-dependent synchrotron and inverse Compton model, assuming an injection electron spectral index of 2.0, used to describe HESS J0632057 by Skilton et al. (2009) and scaled down by a factor 3 to fit the SED from HESS J1832093. Also, follow-up observations in radio of HESS J1832093 could further test this scenario, as known TeV gamma-ray binaries exhibit hard, non-thermal spectra in this wavelength regime.
Further similarities between HESS J1832093 and HESS J0632057 can be tentatively considered in light of the relative fluxes observed in their corresponding X-ray light-curves. Although the sampling for HESS J1832093 is rather sparse, it already provides a flux ratio 6 between high- and low/quiescent-states, here identified respectively with the Chandra and the XMM-Newton/Swift data points. About the same ratio is indeed observed in the X-ray light-curve of HESS J0632057 between peak-to-base-line flux levels, with maximum X-ray fluxes occurring at orbital phases 0.3 (Bongiorno et al., 2011). Furthermore, the typical time-scales of rise and decay of the X-ray flaring episodes in HESS J0632057 are found to be of the order of a few weeks, which is so far consistent with the X-ray measurements of HESS J1832093 presented here, constraining the variability timescale to 2 months. Interestingly, HESS J0632057 displays a double peak structure in the X-ray light-curve (see also the case for other gamma-ray binaries, e.g. LS I 61 303, Smith et al., 2009; Li et al., 2011 or 1FGL J1018.65856, An et al., 2015). The second X-ray peak occurs at orbital phases [0.6–0.9], being significantly shallower and more variable from orbit to orbit with respect to the main X-ray peak (Aliu et al., 2014). If similarities of HESS J1832093 were to extend also to the presence of such a secondary peak, future X-ray monitoring observations of the source may reveal it, further strengthening the gamma-ray binary scenario.
The X-ray spectra of HESS J1832093 obtained with the different instruments display a rather hard and relatively stable photon index (within statistical uncertainties) for the different observations (see Tab. 1). VHE emission in gamma-ray binaries is usually interpreted as Inverse Compton (IC) radiation of highly relativistic electrons scattering off the companion’s photon field. For typical companion temperatures, [22500 – 39000] K and TeV electrons, IC emission proceeds deep into the Klein-Nishina (KN) regime, with cooling time-scales s, where is the companion photon field energy density in units of 100 erg cm-3 and is the electron energy in TeV (see, e.g., Khangulyan et al., 2008). The X-ray emission is thought to originate from synchrotron radiation by the same population of relativistic electrons, with synchrotron emission time-scales , with the magnetic field in Gauss units.
The higher energy output observed in VHE gamma-rays compared to that in X-rays (see SED in Fig. 5) suggests that the IC channel is dominant over synchrotron. Given that and assuming that IC losses take place deep in the KN regime, it implies relatively hard electron spectra, with electron spectral indices , resulting in a hard synchrotron spectrum in X-rays.
In the case of HESS J1832093, marginal evidence that similar processes are responsible for the X-ray and TeV emission may come from the spectral properties measured at both energy bands, [1.3–1.5] and (H.E.S.S. Collaboration et al., 2015a). However, a strong caveat here is the non-detection of the optical counterpart of HESS J1832093, which prevents a more refined characterisation in such a gamma-ray binary scenario. Future observations, either with highly sensitive instruments operating in the optical-UV band and/or high-resolution IR spectrography in case absorption prevents a proper optical characterisation of the companion star, will hopefully provide in-depth information of the physical properties of this new TeV binary candidate.
5 Conclusion
The new X-ray observations of XMMU J1832450921539 using Chandra and Swift shed new light on the nature of the gamma-ray source HESS J1832093. The PWN scenario, as discussed as one of the possible origins in H.E.S.S. Collaboration et al. (2015a), is not supported due to the lack of any measured extension of the X-ray source beyond the Chandra resolution. The binary scenario seems most likely due to the detected X-ray flux variability and the broadband SED, although an extragalactic origin from a very unusual VHE gamma-ray emitting AGN, located directly in the line of sight of the Galactic plane is not excluded. Unfortunately, the currently scarce coverage of observations available in X-rays does not allow a precise measurement of the variability time scale of this object. Future monitoring of the source in X-rays with Swift will hopefully permit the orbital period of the system to be determined, as in the case of HESS J0632057 (Aliu et al., 2014). Deeper observations in IR and radio could also help to identify the nature of the IR source 2MASS J183245160921545.
Acknowledgements
This research has made use of data obtained from the Chandra Data Archive and software provided by the Chandra X-ray Center (CXC) in the application package CIAO. This publication makes use of data products from the Two Micron All Sky Survey, which is a joint project of the University of Massachusetts and the Infrared Processing and Analysis Center/California Institute of Technology, funded by the National Aeronautics and Space Administration and the National Science Foundation. We thank V. Zabalza for his useful input to the scientific discussion.
References
- Abramowski et al. (2011) Abramowski A., et al., 2011, A&A, 529, A49
- Aharonian et al. (2005a) Aharonian F., et al., 2005a, A&A, 432, L25
- Aharonian et al. (2005b) Aharonian F., et al., 2005b, A&A, 442, 1
- Aharonian et al. (2006) Aharonian F., et al., 2006, A&A, 460, 743
- Aharonian et al. (2007) Aharonian F. A., et al., 2007, A&A, 469, L1
- Albert et al. (2009) Albert J., et al., 2009, ApJ, 693, 303
- Aleksić et al. (2011) Aleksić J., et al., 2011, ApJ, 730, L8
- Aliu et al. (2014) Aliu E., et al., 2014, ApJ, 780, 168
- An et al. (2015) An H., et al., 2015, ApJ, 806, 166
- Arnaud (1996) Arnaud K. A., 1996, in G. H. Jacoby & J. Barnes ed., Astronomical Society of the Pacific Conference Series Vol. 101, Astronomical Data Analysis Software and Systems V. p. 17
- Blackburn (1995) Blackburn J. K., 1995, Astronomical Data Analysis Software and Systems IV, 77, 367
- Bongiorno et al. (2011) Bongiorno S. D., Falcone A. D., Stroh M., Holder J., Skilton J. L., Hinton J. A., Gehrels N., Grube J., 2011, ApJ, 737, L11
- Caliandro et al. (2013) Caliandro G. A., et al., 2013, MNRAS, 436, 740
- Carter et al. (2003) Carter C., Karovska M., Jerius D., Glotfelty K., Beikman S., 2003, in Payne H. E., Jedrzejewski R. I., Hook R. N., eds, Astronomical Society of the Pacific Conference Series Vol. 295, Astronomical Data Analysis Software and Systems XII. p. 477
- Dickey & Lockman (1990) Dickey J. M., Lockman F. J., 1990, ARA&A, 28, 215
- Eger & Haberl (2008) Eger P., Haberl F., 2008, A&A, 491, 841
- Garmire et al. (2003) Garmire G. P., Bautz M. W., Ford P. G., Nousek J. A., Ricker Jr G. R., 2003, in Society of Photo-Optical Instrumentation Engineers (SPIE) Conference Series.
- H.E.S.S. Collaboration et al. (2013) H.E.S.S. Collaboration et al., 2013, A&A, 554, A107
- H.E.S.S. Collaboration et al. (2015a) H.E.S.S. Collaboration et al., 2015a, MNRAS, 446, 1163
- H.E.S.S. Collaboration et al. (2015b) H.E.S.S. Collaboration et al., 2015b, A&A, 577, A131
- Hinton et al. (2009) Hinton J. A., et al., 2009, ApJ, 690, L101
- Khangulyan et al. (2008) Khangulyan D., Aharonian F., Bosch-Ramon V., 2008, MNRAS, 383, 467
- Li et al. (2011) Li J., et al., 2011, ApJ, 733, 89
- Monet (1998) Monet D. G., 1998, in American Astronomical Society Meeting Abstracts. p. 120.03
- Morris et al. (2009) Morris D. C., Smith R. K., Markwardt C. B., Mushotzky R. F., Tueller J., Kallman T. R., Dhuga K. S., 2009, ApJ, 699, 892
- Padovani et al. (1997) Padovani P., Giommi P., Fiore F., 1997, MNRAS, 284, 569
- Skilton et al. (2009) Skilton J. L., et al., 2009, MNRAS, 399, 317
- Smith et al. (2009) Smith A., Kaaret P., Holder J., Falcone A., Maier G., Pandel D., Stroh M., 2009, ApJ, 693, 1621
- Wilms et al. (2000) Wilms J., Allen A., McCray R., 2000, ApJ, 542, 914